HAL Id: hal-01754876
https://hal.archives-ouvertes.fr/hal-01754876
Submitted on 30 Mar 2018
HAL is a multi-disciplinary open access
archive for the deposit and dissemination of
sci-entific research documents, whether they are
pub-lished or not. The documents may come from
teaching and research institutions in France or
abroad, or from public or private research centers.
L’archive ouverte pluridisciplinaire HAL, est
destinée au dépôt et à la diffusion de documents
scientifiques de niveau recherche, publiés ou non,
émanant des établissements d’enseignement et de
recherche français ou étrangers, des laboratoires
publics ou privés.
Dynamics of anchored oscillating nanomenisci
Caroline Mortagne, Kevin Lippera, Philippe Tordjeman, Michael Benzaquen,
Thierry Ondarçuhu
To cite this version:
Caroline Mortagne, Kevin Lippera, Philippe Tordjeman, Michael Benzaquen, Thierry Ondarçuhu.
Dynamics of anchored oscillating nanomenisci. Physical Review Fluids, American Physical Society,
2017, 2 (10), pp.102201. �10.1103/PhysRevFluids.2.102201�. �hal-01754876�
O
pen
A
rchive
T
OULOUSE
A
rchive
O
uverte (
OATAO
)
OATAO is an open access repository that collects the work of Toulouse researchers and
makes it freely available over the web where possible.
This is an author-deposited version published in :
http://oatao.univ-toulouse.fr/
Eprints ID : 19813
To link to this article : DOI:
10.1103/PhysRevFluids.2.102201
URL
http://dx.doi.org/10.1103/PhysRevFluids.2.102201
To cite this version : Mortagne, Caroline and Lippera, Kevin and
Tordjeman, Philippe and Benzaquen, Michael and Ondarçuhu, Thierry
Dynamics of anchored oscillating nanomenisci (2017), Physical Review
Fluids, vol. 2, n°10, pp.1-9
Any correspondance concerning this service should be sent to the repository
administrator:
[email protected]
Dynamics of anchored oscillating nanomenisci
Caroline Mortagne,1,2Kevin Lippera,1,3Philippe Tordjeman,2Michael Benzaquen,3 and Thierry Ondarçuhu1,*
1CEMES-CNRS, UPR 8011, 29 rue Jeanne Marvig, 31055 Toulouse Cedex 4, France 2IMFT-Université de Toulouse, CNRS-INPT-UPS, UMR 5502,
1 allée du Professeur Camille Soula, 31400 Toulouse, France
3LadHyX-UMR CNRS 7646, École Polytechnique, Boulevard des Maréchaux, 91120 Palaiseau, France
We present a self-contained study of the dynamics of oscillating nanomenisci anchored on nanometric topographical defects around a cylindrical nanofiber with a radius below 100 nm. Using frequency-modulation atomic force microscopy (FM-AFM), we show that the friction coefficient surges as the contact angle is decreased. We propose a theoretical model within the lubrification approximation that reproduces the experimental data and provides a comprehensive description of the dynamics of the nanomeniscus. The dissipation pattern in the vicinity of the contact line and the anchoring properties are discussed as a function of liquid and surface properties in addition to the forcing conditions.
I. INTRODUCTION
The study of liquid dynamics in the close vicinity of the contact line is fundamental to understanding the physics of wetting [1,2]. The strong confinement inherent to this region leads, in the case of a moving contact line, to a divergence of the energy dissipation. This singularity can be released by the introduction of microscopic models based on long-range interactions, wall slippage, or diffuse interface [3], which are still difficult to determine experimentally. In most cases, the spreading is also controlled by the pinning of the contact line on surface defects [4,5]. For nanometric defects, the intensity and localization of the viscous energy dissipation is crucial to understanding the wetting dynamics. The aim of this paper is to study the hydrodynamics of a nanomeniscus anchored on nanometric topographic defects and subjected to an external periodic forcing. This configuration allows one to investigate the viscous dissipation in a meniscus down to the very close vicinity of the fixed contact line and to assess the dynamics of the pinning of nanometric defects. In addition to being an important step towards the elucidation of the wetting dynamics on rough surfaces, this issue is relevant for vibrated droplets or bubbles [6] and for the reflection of capillary waves on a solid wall [7].
Atomic force microscopy (AFM) has proven to be a unique tool to carry out measurements on liquids down to the nanometer scale: liquid structuration [8] or slippage [9] at solid interfaces was evidenced, while the use of specific tips fitted with either micro- or nanocylinders allowed quantitative measurements in viscous boundary layers [10] and at the contact line [11]. In this study, we have developed an AFM experiment based on the frequency modulation mode (FM-AFM) to monitor, simultaneously, the mean force and the energy dissipation experienced by an anchored nanomeniscus. Artificial defects with adjustable size are deposited on cylindrical fibers (radius below 100 nm) to control the pinning of the contact line and the meniscus stretching during the oscillation. The experiments are analyzed in the frame of a nanohydrodynamics model based on the lubrification approximation. Interestingly, the meniscus oscillation does not lead to any stress divergence at the contact line allowing a full resolution without the use of cutoff lengths in contrast with the case of a moving contact line. This study thus provides a comprehensive description of
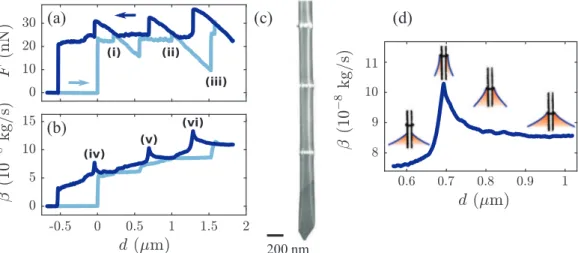
CAROLINE MORTAGNE et al. 200 nm
(c)
(b)
(a)
(d)
(iv) (v) (vi) (i) (ii) (iii)FIG. 1. FM-AFM spectroscopy curves performed on a 3EG liquid drop. (a) Force F and (b) friction coefficient β as a function of the immersion depth d. (c) SEM image of the 3.2 µm long and 170 nm diameter probe, covered by three platinum rings of thicknesses r0=10, 15, and 40 nm, from bottom to top. (d) Zoom
on the friction coefficient curve on the second defect with sketches of the meniscus.
dissipation mechanisms in highly confined menisci and an estimate of the critical depinning contact angle for nanometric defects.
II. EXPERIMENTAL METHODS
The fibers used in the experimental study were carved with a dual beam FIB (1540 XB Cross Beam, Zeiss) from conventional silicon AFM probes (OLTESPA, Bruker). Using a beam of Ga ions, a 2 to 3 µm long cylinder of radius R ∼ 80 nm is milled at the end of a classical AFM tip. An ELPHY MultiBeam (Raith) device allows to manufacture nanometric spots of platinum by electron beam induced deposition (EBID) in order to create ring defect of controlled thickness around the cylinders (see Supplemental Material [12]). An example of a homemade cylinder with three annular rings is displayed in Fig.1(d). The liquids used are ethylene glycol (1EG), diethylene glycol (2EG), triethylene glycol (3EG), and an ionic liquid, namely, 1-ethyl-3-methylimidazolium tetrafluoroborate. The liquids have a low volatility at room temperature. Their dynamic viscosities are η = 19.5, 34.5, 46.5, and 44 mPa · s, and their surface tensions are γ = 49.5, 49.5, 48, and 56 mN · m−1at 20◦, respectively. As surface conditions play a crucial role in wetting, measurements
are made before and after a 5 min UV/O3treatment aimed at removing contaminants and making
the surface more hydrophilic [13].
Using a PicoForce AFM (Bruker), the tips are dipped in and withdrawn from a millimetric liquid drop deposited on a silicon substrate. Prior to any experiment series, the cantilever quality factor Qand deflection sensitivity are measured, and its spring constant k is determined using standard calibration technique[14]. The experiments are performed in frequency modulation (FM-AFM) mode using a phase-lock loop device (HF2LI, Zurich Instrument) which oscillates the cantilever at its resonance frequency f . A proportional-integral-derivative controller is used to adjust the excitation signal Aexin order to maintain the tip oscillation amplitude A constant. The excitation signal Aexis
therefore a direct indication of the system dissipation. In particular, it is linearly related to the friction coefficient of the interaction through β = β0 (Aex/Aex,0−1), where Aex,0and β0=k/(ω0Q) are,
respectively, the excitation signal and the friction coefficient of the free system in air, measured far from the liquid interface [15]. We used cantilevers with quality factor Q ∼ 200 high enough to ensure that the resonant frequency is related to the natural angular frequency through ω0=2πf .
DYNAMICS OF ANCHORED OSCILLATING NANOMENISCI
measurements of dissipation in the viscous layer around the tip [10]. In the present case, it allows us to monitor, during the whole process, both the capillary force F and the friction coefficient β, which are related to the shape of the meniscus and to the viscous dissipation, respectively. Note that both values are obtained with a 20% accuracy mainly coming from the uncertainty in the determination of k.
III. RESULTS
Figure 1 shows the results of a typical experiment performed on a 3EG drop. The measured force F [Fig.1(a)] and friction coefficient β [Fig.1(b)] are plotted as a function of the immersion depth d for a ramp of 2.5 µm. The cylinder is dipped in (light blue curves) and withdrawn (dark blue curves) from the liquid bath at 2.5 µm · s−1. The tip oscillates at its resonance frequency (66 820 Hz in air) with an amplitude of 6 nm. The cantilever stiffness is k = 1.5 N · m−1, soft enough to perform deflection measurements while being adapted for the dynamic mode. The force curve can be interpreted using the expression of the capillary force [16]: F = 2π Rγ cos ¯θ, where R is the fiber radius and ¯θis the mean contact angle during the oscillation. After the meniscus formation at d =0, and until the contact line anchors on the first ring [at reference (i)] F and ¯θremain constant, consistent with Refs. [16–18]. A small jump of the force is observed when the contact line reaches a platinum ring on reference points (i), (ii), or (iii). Once the meniscus is pinned, the contact angle increases as the cylinder goes deeper into the liquid, leading to a decrease of the force F . Conversely, the withdrawal leads to a decrease of ¯θand an increase of the force F on the left of (i), (ii), and (iii). Hence, each ring induces two hysteresis cycles characteristic of strong topographic defects [4].
Different contributions to the probe-liquid system account for the friction coefficient behavior. The global increase of β with d observed on Fig.1(b)results from the contribution of the viscous layer around the tip which is proportional to the immersion depth [10]. At withdrawal, β increases dramatically when the probe reaches the reference points (iv), (v), and (vi) of Fig. 1(b). In those regions, the force curve indicates that the meniscus is pinned on a defect. The dissipation growth is therefore attributed to the decrease of the contact angle before depinning as schematized on the zoom on the friction coefficient curve [Fig.1(c)]. This large effect can be qualitatively understood considering that small contact angles—corresponding to reduced film thickness—generate strong velocity gradients in the meniscus and thus a large dissipation. Note that a similar behavior is observed on a moving contact line for which the friction coefficient also displays a strong dependance upon the contact angle β ∼ 1/ ¯θ[1].
IV. THEORETICAL MODEL
In order to account for the experimental results, we developed a theoretical model for the oscillation of a liquid meniscus in cylindrical geometry (see the Supplemental Material [12]). We consider the problem in the frame of reference attached to the cylinder (see Fig.2). The flow induced by the interface motion leads to a friction coefficient βmen. The latter is related to the mean energy
loss P during an oscillation cycle, through P = βmen(Aω)2/2 [19]. Since the capillary number is
small (see Ref. [20]) we may safely state that viscous effects do not affect the shape of the liquid interface. Therefore, the meniscus profile is solution of the Laplace equation resulting from the balance between capillary and hydrostatic pressures, which in turn yields the well-known catenary shape [21–23]: h =(R + r0) cos θ cosh · z (R + r0) cos θ −ln(ζ ) ¸ (1) were ζ = cos θ/(1 + sin θ ). The meniscus height Z0 is given, in the limit of small contact angles,
by Z0=(R + r0) cos θ · ln µ 4 lc R + r0 ¶ −γE ¸ (2)
CAROLINE MORTAGNE et al.
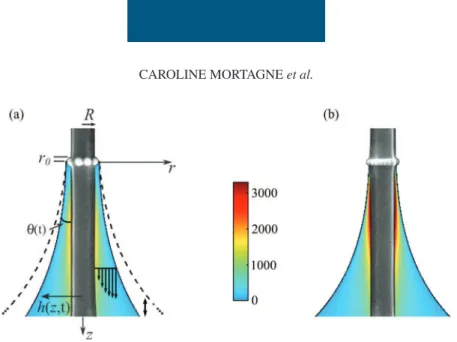
FIG. 2. (a) Oscillating meniscus anchored on a defect, displayed in the frame of reference of the fiber. The velocity profile (black arrows) is calculated from Eq. (4). The stress field η∂rv(color gradient) is computed for
R =100 nm, r0=40 nm, lc=2 mm, A = 10 nm, f = 65 kHz, ¯θ = θcrit=6.73◦, and η = 30 mPa · s. Color
bar in Pa. (b) Same with r0=10 nm and ¯θ = θcrit=7.5◦.
with γE≃0.577 the Euler constant and lc the capillary length. Since Z0(t ) oscillates around its
mean position as Z0[θ (t )] = Z0( ¯θ) + A cos(ωt ), we can derive the temporal evolution of the contact
angle:
cos θ (t ) = cos ¯θ + Acos(ωt ) (R + r0)£ln¡R+r4lc
0¢ − γE
¤ . (3)
Note that our model is meant to deal with positive contact angles only, even if the defect thickness could in principle allow slightly negative ones. This defines a critical contact angle θcrit related to the minimum value of ¯θ allowed by the model. One has cos θcrit=
1 − A/((R + r0){ln[4 lc/(R + r0)] − γE}). This critical depinning angle on an ideally strong defect
increases with respect to A and decreases with respect to R + r0. The interface motion being known,
the velocity field is derived using the Stokes equation. Indeed, gravity and inertia can be safely neglected (Re ∼ 10−8 and l
c≃2 mm). Moreover, the viscous diffusion time scale τν=R2/ν is
much smaller than the oscillation period (τνf ∼10−7), such that the Stokes equation reduces to the
simplest steady Stokes equation. Using the lubrication approximation, we have finally ∂zP = η1rv
where P is the hydrodynamic pressure and v is the velocity component in the z direction. Finally, combining the mass conservation equation, ∂t(π h2) + ∂zq =0, where q is the local flow rate through
a liquid section of normal z, the no-slip (at r = R), and free interface (at r = h) boundary conditions yields the velocity profile:
v(r,z,t) = 2[R
2+
2 h2ln(r/R) − r2]R0zdu ∂t(h2)
R4+3 h4−4 h2R2−4 h4ln(h/R) . (4)
From Eq. (4) we derive the expression of βmen:
βmen( ¯θ) = ¿ 4π η A2ω2 Z Z0 0 Z h R (∂rv)2r dr dz À t , (5)
where h it, designates the temporal average over an oscillation cycle (see the Supplemental Material
[12]). Figure 2 displays an example of viscous stress field (color gradient) and velocity profile (vertical dark arrows) inside a nanomeniscus. The latter are computed from Eqs. (1), (3), and (4) for a fiber of radius R = 85 nm and a defect with r0=10 nm, for typical operating conditions
(f = 65 kHz and A = 10 nm). We observe that the stress is essentially localized at the fiber wall and is at maximum at a distance of the order of R beneath the contact line. Interestingly, the
DYNAMICS OF ANCHORED OSCILLATING NANOMENISCI
degrees
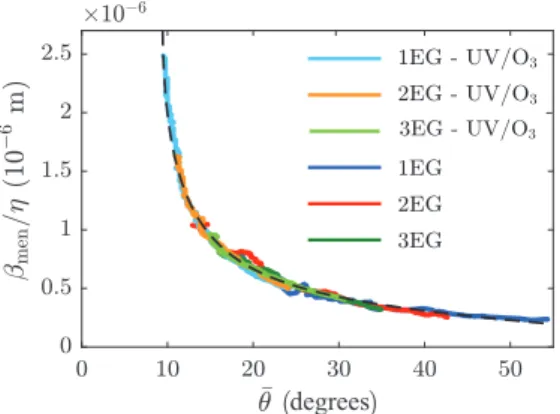
FIG. 3. Normalized friction coefficient βmen/η plotted as a function of ¯θ [see Eq. (5)]. The dashed line
signifies the theoretical model, and the experimental dotted curves are performed over all the studied liquids, before and after UV/O3 treatment, with R = 85 nm, A = 18 nm, and r0=40 nm. The values of the free
parameters used are θbreak=18.5◦, 12.6◦, 15.1◦, 9.5◦, 10.9◦ and 14.9◦and βbottom/ηR =8.7, 4.5, 10.2, 8.9,
13.2, 9.1 for 1EG, 2EG and 3EG, before and after UV/O3treatment, respectively.
meniscus oscillation does not lead to any stress singularity at the contact line. It does not require the introduction of a slippage in the vicinity of the (moving) contact line as in the case of wetting dynamics [24,25]. We therefore used the standard no-slip boundary condition, validated by the molecular scale values of slip lengths measured on hydrophilic surfaces [26]. The viscous stress maps also allow one to check a posteriori the interface profile hypothesis. The local capillary number is Calocal=η∂zv/1P where 1P ≃ γ /R − γ /(R + A) ≃ Aγ /R2. Taking a maximum
value of η∂zv =3000 Pa obtained for 10 nm defects [see Fig.2(b)] we find that Ca 6 5 × 10⁻², thus
validating the hypothesis. The fact that the viscous stress strongly decays when z becomes of the order of a few probe radii also strengthens the lubrication approximation, only valid for small surface gradients (∂zh ≪1).
When the mean contact angle ¯θis decreased, a strong increase of the viscous stress is observed but its localization remains mostly unchanged (see the Supplemental Material [12]). Another striking result is the influence of the defect height r0: for contact angles close to the critical one, a reduction
in size of the defect increases significantly the viscous stress but also affects its localization, which becomes concentrated closer from the contact line as r0 is decreased (Fig. 2). This effect is not
straightforward and may have important consequences on the wetting on surfaces with defects. Finally, the integration of the stress according to Eq. (5) leads to the normalized friction coefficient βmen/ηas a function of ¯θ, an example of which is plotted in Fig.3(dashed line). A significant increase
of βmenis observed for decreasing contact angles in agreement with the experimental observations.
V. DISCUSSION
To quantitatively confront the FM-AFM experiments to the theoretical model, we use the force signal to determine the experimental contact angles ¯θ. We assume that, due to the inhomogeneous thickness of the platinum rings, the meniscus depins from the defect for a contact angle θbreak
larger than θcritvalue expected for an ideal defect. The maximum force before depinning then reads
Fmax=2π γ (R + r0) cos θbreak, which allows one to calculate the experimental contact angle for any
d values using cos ¯θ =(F /Fmax) cos θbreak. The latter equation enables us to determine the contact
angle for each d position without using the cantilever stiffness k only known within 20% error. For each experiment, we make a linear fit of the friction coefficient curve only taking into account the regions which are not influenced by the defects such as, for example, the portion between points (iv) and (v) in Fig. 1(b). The subtraction of this fit allows one to dispose of the viscous layer
CAROLINE MORTAGNE et al. degrees degrees d eg re es
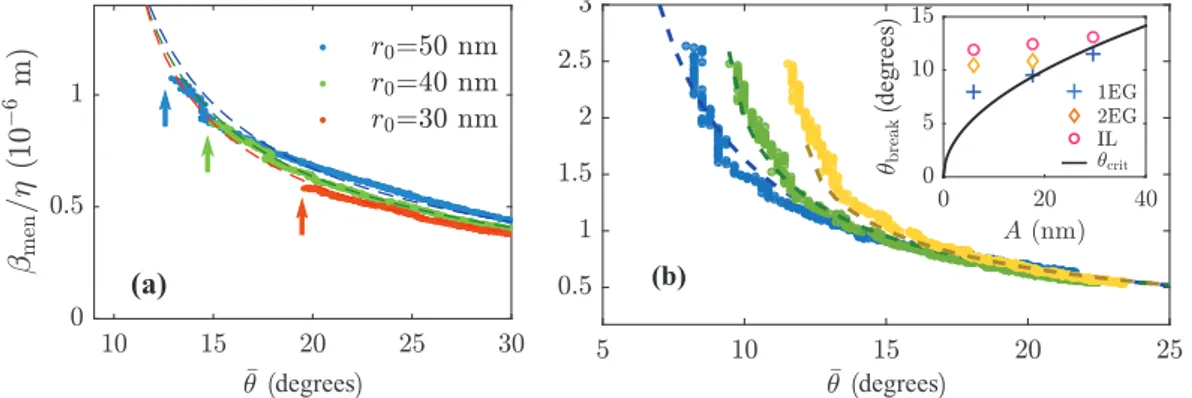
FIG. 4. Normalized friction coefficient βmen/ηvs mean contact angle ¯θfor different operating conditions.
The dashed lines are plots of the theoretical model [Eq. (5)]. (a) Influence of ring thickness r0 on 2EG for
A =6 nm. The arrows indicate the value of θbreak. The values of the free parameters used are θbreak=19.6◦,
15◦, and 12.5◦ and β
bottom/ηR =8.6, 8.2, and 7 for r0=30, 40, and 50 nm, respectively. (b) Influence of
oscillation amplitude A for 1EG on a defect with r0=40 nm: A = 6 nm, 17.7 nm, and 29.5 nm are plotted in
blue, green, and yellow, respectively. The values of the free parameters used are θbreak=7.9◦,9.5◦, and 11.5◦
and βbottom/ηR =0.13, 0.89, and 2.7 for A = 6 nm, 17.7 nm, and 29.5 nm, respectively. Inset: plot of θbreak
(symbols) and θcrit(solid line) as a function of the oscillation amplitude for a defect of thickness r0=40 nm.
Symbol size corresponds to the error bar in θbreakmeasurements.
contribution on the side of the fiber, leaving only βmenand a constant term induced by the dissipation
associated with the bottom of the tip, called βbottom. The data are then fitted by computing the two
free parameters βbottomand θbreak which minimize the standard deviation between the experimental
data and the theoretical curve [Eq. (5)]. The routine is performed withMATLAB, using the Curve Fitting toolbox. It (independently) determines the values of the adjusting parameters βbottom and
θbreakusing the nonlinear least squares method. As for R and r0, we use effective values measured by
SEM. FM experiments were then performed over all the studied liquids. More than 90 experiments were carried out with two different home-made probes (R = 80 nm and 85 nm), defect thicknesses r0 between 10 and 50 nm and oscillation amplitudes A ranging from 5 to 35 nm. Additionally,
experiments were performed before and after surface cleaning by UV/O3 treatment to assess the
influence of tip wettability.
As an example, Fig.3displays six curves performed with three different liquids, before and after UV/O3treatment, on the same defect (R = 85 nm and r0 =40 nm) with an amplitude A = 18 nm.
The agreement between the experimental data and the theoretical model is remarkable. A 10-fold enhancement of dissipation is observed when the contact angle is decreased from 50◦ to 10◦. As expected, the 5 min surface cleaning does not affect the dissipation process since all curves superpose on a same master curve. Yet ozone cleaning has a strong impact on the θbreak values.
The hydrophilic surfaces obtained after UV/O3 treatment lead to a strong pinning which allows
to reach smaller contact angle values. For example, for 1EG θbreak decreases from 18.5◦ to 9.5◦,
the latter value being very close to the value of θcrit=9.4◦. Consequently, the dissipation can
reach larger values after ozone treatment. This is a common observation on all the measurements. When the tip is more hydrophobic, the liquid may detach between the dots forming the defect before the θcrit value is reached. Note that, while the model is developed for small contact angles,
confrontation with experiments demonstrates that it remains valid until θbreak∼50◦, values giving
a weak dissipation. This is consistent with previous observations that the lubrication approximation yields good predictions for moderately large contact angles [2].
In order to discuss further the influence of the various parameters and the resulting values of the fitting variables θbreak and βbottom, we report in Fi.4(a)a comparison between the theoretical
DYNAMICS OF ANCHORED OSCILLATING NANOMENISCI
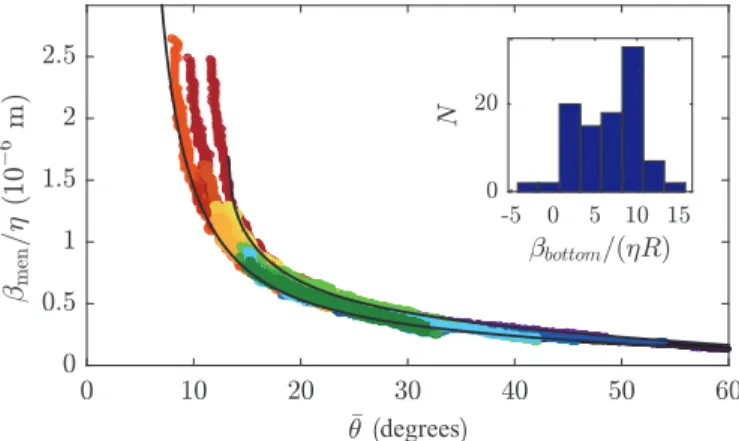
degrees
FIG. 5. Superposition of 30 experimental curves. In order to visualize different curves, the color is related to the θbreakvalue. The range of theoretical values is limited by two solid lines (r0=5 nm, A = 33 nm for the
higher one and r0=50 nm, A = 6 nm for the lower one); Inset: Histogram of the βbottomvalues extracted from
the experimental data.
oscillation amplitudes. Figure4(a)shows that the ring thickness r0has a low impact on the friction
coefficient curve for 30 nm 6 r0650 nm. Nevertheless, a systematic evolution of θbreakis observed:
larger defect thicknesses lead to a stronger pinning of the defect, which results in a smaller θbreak
value, as marked by the arrows on the curves. We also found that the oscillation amplitude plays a significant role only for contact angles close to θcrit. Therefore its influence can be noticed only after
the UV/O3treatment. The theoretical model reproduces well the influence of amplitude observed
for contact angles smaller than 15◦[see Fig.4(b)]. A larger amplitude increases the value β menat
low ¯θand also leads to an increase of the θbreakvalue, a general trend observed on all experiments.
These results show that the experimental conditions, namely, the defect size r0, the oscillation
amplitude A, and the surface wettability, have a small influence on the shape of the friction coefficient as a function of the contact angle. We therefore report in Fig.530 curves obtained using different tips, defects, liquids, and amplitudes. All curves superimpose in a rather thin zone which is nicely bounded by the theoretical curves giving the extreme cases within the range of experimental conditions (10 nm 6 r0 650 nm and 6 nm 6 A 6 33 nm). The highest dissipation is obtained for small defect
and high amplitude (r0=5 nm and A = 33 nm). From all the measurements (more than 90), we
extracted values of the two adjustable parameters, namely, θbreak and βbottom. The value of θbreak
gives an indication of the pinning behavior. Strong pinning, which corresponds to low θbreakvalues,
is reached for large defects on hydrophilic tips under weak forcing. This trend, consistent with macroscopic expectation, therefore remains valid down to nanometer-scale defects. In the optimal case, the θcrit value expected for an ideal defect could be approached [see Fig. 4(c)]. Dynamic
effects are also probably involved in the depinning transition since three liquids with similar surface tension and contact angle but varying viscosities show different pinning behaviors. This result, which has important consequences for the description of wetting dynamics on real surfaces, requires further investigations. Unlike θbreak, βbottomdoes not show any systematic influence of amplitude,
defect size, and wettability as expected from the model. Statistics over all experiments (see inset of Fig.5) show that βbottomis proportional to the liquid viscosity and is centered around a mean value
βbottom/(ηR) = 7. This is consistent with expected values for a either a flat end or an hemispherical
end leading to βbottom=8η R [27] or βbottom=3π η R. This large dispersion comes from the fact
that the tip end is ill-defined and moreover may evolve with time since measurements on hard surfaces are required, after each series of measurements, for calibration purposes. This hinders a more quantitative comparison with the theory.
CAROLINE MORTAGNE et al.
VI. CONCLUSION
In conclusion, this work provides a comprehensive investigation of the viscous dissipation in anchored oscillating menisci. We find an excellent agreement between the experimental results and our lubrication-based theoretical model describing the flow pattern inside the oscillating meniscus. The confinement induced by the stretching of the meniscus leads to a strong increase of viscous stress which accounts for the surge of dissipated energy observed at a small angle. Note that this effect is amplified for small defect sizes, in which case the stress is strongly localized at the contact line with important consequences for the wetting dynamics on surfaces with defects. The fabrication of artificial nanometric defects also gives new insights on the depinning of the contact line which appears for a contact angle value θbreak larger than the theoretical one θcrit obtained for a perfect
pinning. The latter value could be approached using hydrophilic tips showing that the pinning is all the stronger that the oscillation amplitude A is small and the defect size r0 is large. This study
demonstrates that FM-AFM combined with the nanofabrication of dedicated probes with controlled defects is a unique tool for quantitative measurements of dissipation in confined liquids, down to the nanometer scale, and paves the way for a systematic study of open questions in wetting science regarding the extra dissipation which occurs when the contact line starts to move. In particular, our approach brings new insights for the role of surface defects, their pinning behavior, and the associated induced dissipation, down to the nanometer scale.
ACKNOWLEDGMENTS
The authors thank P. Salles for his help in the development of tip fabrication procedures, Dominique Anne-Archard for viscosity measurements, and J.-P. Aimé, D. Legendre, and E. Raphaël for fruitful discussions. This study has been partially supporter through the ANR by the NANOFLUIDYN project (Grant No. ANR-13-BS10-0009).
[1] P. G. de Gennes, Wetting: Statics and dynamics,Rev. Mod. Phys. 57,827(1985).
[2] D. Bonn, J. Eggers, J. Indekeu, J. Meunier, and E. Rolley, Wetting and spreading,Rev. Mod. Phys. 81,
739(2009).
[3] J. H. Snoeijer and B. Andreotti, Moving contact lines: Scales, regimes, and dynamical transitions,Ann. Rev. Fluid Mech. 45,269(2013).
[4] J. F. Joanny and P.-G. De Gennes, A model for contact angle hysteresis,J. Chem. Phys. 81,552(1984). [5] H. Perrin, R. Lhermerout, K. Davitt, E. Rolley, and B. Andreotti, Defects at the Nanoscale Impact Contact
Line Motion at all Scales,Phys. Rev. Lett. 116,184502(2016).
[6] X. Noblin, A. Buguin, and F. Brochard-Wyart, Vibrated sessile drops: Transition between pinned and mobile contact line oscillations,Eur. Phys. J. E 14,395(2004).
[7] G. Michel, F. Pétrélis, and S. Fauve, Acoustic Measurement of Surface Wave Damping by a Meniscus,
Phys. Rev. Lett. 116,174301(2016).
[8] T. Fukuma, Water distribution at solid/liquid interfaces visualized by frequency modulation atomic force microscopy,Sci. Technol. Adv. Mater. 11,033003(2010).
[9] A. Maali, T. Cohen-Bouhacina, and H. Kellay, Measurement of the slip length of water flow on graphite surface,Appl. Phys. Lett. 92,053101(2008).
[10] J. Dupré de Baubigny, M. Benzaquen, C. Mortagne, C. Devailly, S. Kosgodagan Acharige, J. Laurent, A. Steinberger, J.-P. Salvetat, J.-P. Aimé, and T. Ondarçuhu, AFM study of hydrodynamics in boundary layers around micro- and nanofibers,Phys. Rev. Fluids 1,044104(2016).
[11] S. Guo, M. Gao, X. Xiong, Y. J. Wang, X. Wang, P. Sheng, and P. Tong, Direct Measurement of Friction of a Fluctuating Contact Line,Phys. Rev. Lett. 111,026101(2013).
DYNAMICS OF ANCHORED OSCILLATING NANOMENISCI
[12] See Supplemental Material athttp://link.aps.org/supplemental/10.1103/PhysRevFluids.2.102201for tip fabrication, velocity profile and friction, and low patterns inside the meniscus.
[13] J. R. Vig, UV/ozone cleaning of surfaces,J. Vac. Sci. Technol. A 3,1027(1985).
[14] H.-J. Butt and M. Jaschke, Calculation of thermal noise in atomic force microscopy,Nanotechnology 6,
1(1995).
[15] F. J. Giessibl, Advances in atomic force microscopy,Rev. Mod. Phys. 75,949(2003).
[16] M. Delmas, M. Monthioux, and T. Ondarcuhu, Contact Angle Hysteresis at the Nanometer Scale,Phys. Rev. Lett. 106,136102(2011).
[17] A. H. Barber, S. R. Cohen, and H. D. Wagner, Static and Dynamic Wetting Measurements of Single Carbon Nanotubes,Phys. Rev. Lett. 92,186103(2004).
[18] M. M. Yazdanpanah, M. Hosseini, S. Pabba, S. M. Berry, V. V. Dobrokhotov, A. Safir, R. S. Keynton, and R. W. Cohn, Micro-Wilhelmy and related liquid property measurements using constant-diameter nanoneedle-tipped atomic force microscope probes,Langmuir 24,13753(2008).
[19] J. Pérez, Mécanique: fondements et applications: avec 300 exercices et problèmes résolus (Dunod, Paris, 2001).
[20] The global capillary number can be evaluated to Ca = Aωη/γ ∼ 10−3. However, this general criterion
is not rigorously sufficient. It must be completed by its local counterpart (see the end of the theoretical model section for an a posteriori consistency check).
[21] B. V. Derjaguin, Theory of the distortion of a plane surface of a liquid by small objects and its application to the measurement of the contact angle of the wetting of thin filaments and fibres, Dokl. Akad. Nauk SSSR 51, 517 (1946).
[22] D. F. James, The meniscus on the outside of a small circular cylinder,J. Fluid Mech. 63,657(1974). [23] J. Dupré de Baubigny, M. Benzaquen, L. Fabié, M. Delmas, J.-P. Aimé, M. Legros, and T. Ondarçuhu,
Shape and effective spring constant of liquid interfaces probed at the nanometer scale: finite size effects,
Langmuir 31,9790(2015).
[24] E. Kirkinis and S. H. Davis, Hydrodynamic Theory of Liquid Slippage on a Solid Substrate Near a Moving Contact Line,Phys. Rev. Lett. 110,234503(2013).
[25] P. A. Thompson and M. O. Robbins, Simulations of Contact-Line Motion: Slip and the Dynamic Contact Angle,Phys. Rev. Lett. 63,766(1989).
[26] L. Bocquet and E. Charlaix, Nanofluidics, from bulk to interfaces,Chem. Soc. Rev. 39,1073(2010). [27] W. Zhang and H. A. Stone, Oscillatory motions of circular disks and nearly spherical particles in viscous