HAL Id: hal-01216804
https://hal.archives-ouvertes.fr/hal-01216804
Submitted on 17 Oct 2015
HAL is a multi-disciplinary open access
archive for the deposit and dissemination of
sci-entific research documents, whether they are
pub-lished or not. The documents may come from
teaching and research institutions in France or
abroad, or from public or private research centers.
L’archive ouverte pluridisciplinaire HAL, est
destinée au dépôt et à la diffusion de documents
scientifiques de niveau recherche, publiés ou non,
émanant des établissements d’enseignement et de
recherche français ou étrangers, des laboratoires
publics ou privés.
properties
H Ayeb, J Grand, H Sellame, S Truong, J Aubard, N Felidj, Adnen Mlayah,
Emmanuelle Lacaze
To cite this version:
H Ayeb, J Grand, H Sellame, S Truong, J Aubard, et al.. Gold nanoparticles in a cholesteric
liq-uid crystal matrix: self-organization and localized surface plasmon properties. Journal of Materials
Chemistry, Royal Society of Chemistry, 2012, �10.1039/c2jm30622k�. �hal-01216804�
1
Gold Nanoparticles in a Cholesteric Liquid Crystal Matrix:
Self-organization and Localized Surface Plasmon Properties
H. Ayeb
a,b, J. Grand
c, H. Sellame
a,b, S. Truong
c, J. Aubard
c, N. Felidj
c, A. Mlayah
dand
E. Lacaze
a,b*
By combining experimental and calculated optical extinction spectra, scanning electron microscopy and optical microscopy, we investigate the optical properties of a hybrid system consisting of a cholesteric liquid crystal and gold nanoparticles. Close to the air-exposed surface, the liquid crystal film exhibits a structural modulation. In this article, we explore how to use this modulation to drive the formation of gold nanoparticle assemblies and thus to control their localized surface plasmon properties. We found that the penetration of the gold nanoparticles within the liquid crystal modulation depends on the initial concentration of nanoparticles in the colloidal solution. Two distinct regimes are pointed out: (i) at low concentration the nanoparticles are weakly interacting and embedded in a homeotropic environment at the film surface (ii) at high concentration the penetration of the NPs occurs within the modulation, and their localized surface plasmon resonance is strongly red-shifted due to nanoparticles packing and electromagnetic interactions between the nanoparticles. This surface plasmon resonance shows sensitivity to the light polarization attributed to the formation of anisotropic aggregates oriented by the structural modulation of the liquid crystal.
1. Introduction
During these last years, a large number of hybrid systems combining soft matter films and nanoparticles (NPs) have been described, in which soft matter, for example gel-like materials, polymer brushes, is often used to accurately control the inter-NPs interaction1-3. Many outcomes are in particular expected from hybrid liquid crystals (LCs)/nanoparticles (NPs) systems4, 5.The LC and NPs properties are expected to be modified and even new properties may come out from the LC/NPs
interaction, core-shell NPs embedded in nematic liquid crystals may exhibit negative refraction6. Several works7-9 reported
that ferroelectric and ferromagnetic NPs may drive the phase transitions and the optical properties of LCs under applied electric or magnetic fields7-8. As pointed out in these studies7,8, aggregation of the NPs within the LC matrix should be
avoided in order to control the physical properties of the LC. Gold NPs have also been used to modify the electro-optical response or memory effects of LCs5. To avoid aggregation of gold NPs, usually grafting of appropriate molecules is
performed on NPs4,5. One drawback of these gold NPs with grafted molecules is the size-dependent electron-NP surface
scattering which leads to a strong surface plasmon damping and a resonance broadening, since these NPs are rarely of diameter larger than 3nm.
2
One main interest in hybrid LC/NPs systems lies in the possibility of controlling the metal NPs. In particular, the localized surface plasmon resonance (LSPR) of metal NPs is very sensitive to the optical index of the surrounding medium. Thus, owing to the anisotropy of the optical index of CLCs, the so-called LC birefringence, fine and reversible tuning of the LSPR wavelength and intensity by an applied electric field10 or by light polarization11 can be foreseen.
However, a well-defined orientation of the LC molecules around the NPs is mandatory, though being difficult to realize for large NPs without any particular grafting of molecules. To achieve this proper LC orientation, high magnetic fields have been used12. Alignment layers, mainly rubbed polymers13-15, have been used to force the orientation of the LC molecules
located in the vicinity of the NPs. Nevertheless, the question of the local molecular disorder around the NPs remains open 14-15. Despite the local orientational disorder of the LC molecules, a shift of LSPR associated with the variation of the incident
light polarization has been evidenced in smectic LCs14-15. These results open the route for smart systems based on complex
LC textures.
Spherical gold NPs have been widely used in association with LCs due to their well-controlled synthesis. The main drawback of spherical particles of few tens of nanometers is the rather small shift of the LSPR associated with typical birefringence of liquid crystals. It is thus interesting to consider other nano-objects. Nano-materials of non spherical shape are particularly promising11, but still difficult to synthesize. It has been shown that NPs agglomeration may enhance the
sensitivity of the LSPR to changes in the optical index16,17. On the other hand, anisotropic agglomeration allows for
controlling the LSPR when light polarization is monitored with respect to the agglomeration orientation18. However, if
suitable organic molecules are not grafted on NPs, when embedded in thermotropic nematic LCs, uncontrolled agglomeration of NPs takes place and eventually leads to a phase segregation between the NPs and LC4.
In this paper we report on the study of the optical properties of a hybrid LC/NP nanomaterial consisting of gold nanospheres embedded in a Cholesteric Liquid Crystal (CLC) matrix. We take advantage of the presence of a structural modulation close to the CLC/air interface, to control the NPs optical properties. We address the following experimental issues: (i) What is the impact of the NPs distribution induced by the LC, on their surface plasmon properties and (ii) could the LC be used for tailoring these properties? To carry out this study we have combined optical imaging, Scanning Electronic Microscopy (SEM), extinction spectroscopy and numerical simulations.
2. Experimental method
2.1 Preparation and optical imaging
Polyvinyl alcohol (PVA) was spin coated onto clean glass slides and subsequently rubbed unidirectionally to allow for planar LC alignment. The CLC was prepared by mixing 2% in weight of a chiral agent S-2011 (also known as MLC-6247 from Merck), with the nematic liquid crystal E7 (from Merck) in order to set the helix pitch of the CLC film at p= 5.5µm. The E7 liquid crystal is in the nematic phase for temperature ranging from Tmin =-20°C to Tmax=58°C with a high optical
3
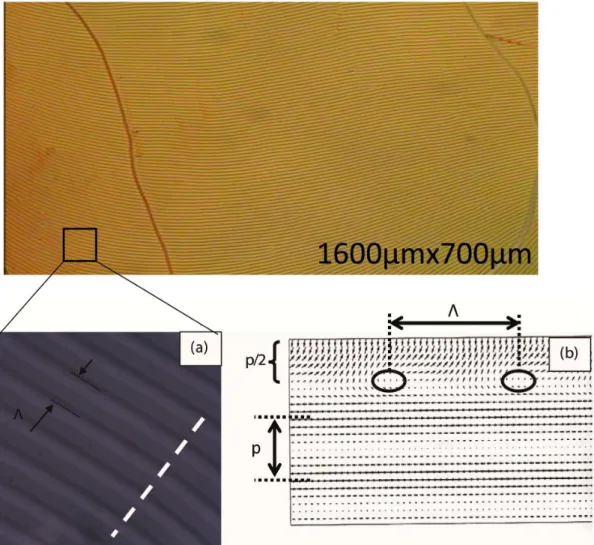
anisotropy ∆n = ne -no =0.23 (ne=1.75, parallel to optical axis and no=1.52, perpendicular to optical axis, where ne and no are respectively the extraordinary and ordinary optical indices). The prepared CLC was spin-coated on the unidirectionally rubbed PVA layer to obtain a CLC film with an average thickness of 12µm. The CLC film thus yields a planar anchoring onto the substrate and a homeotropic arrangement (perpendicular CLC director) at the CLC/air interface. The cholesteric texture was observed using Optical Microscopy (Leica DMRX) and crossed polarizer and analyzer. Periodic dark and bright textural stripes can be seen on a large scale (Fig 1).
This CLC texture has been interpreted earlier by Baudry et al.19 using a phenomenological model. According to this
model, the CLC director, which corresponds to the average molecular orientation, rotates, in the bulk of the film, in a plane parallel to the substrate; the cholesteric helix is thus perpendicular to the substrate (Fig 1. b). While approaching the CLC/air interface, the CLC helix rotates in order to let the director match the homeotropic arrangement at the surface. This rotation occurs within an elastic boundary layer of thickness p/2, as shown in the schematic of Fig 1.b19,20. In this layer, the
orientation of the molecules alternatively changes from perpendicular to parallel with respect to the plane of the substrate, thus forming stripes of alternating planar and homeotropic molecular orientations. These stripes are visible under optical microscopy (fig. 1a) and are associated with optical index varying between no and ne when the light polarization is parallel to
the stripes. Their orientation is determined by the planar anchoring and the CLC film thickness19, 20. Λ is the distance between
two dark or bright lines. One expects Λ ~ 2p with p the CLC pitch19, 20. From Fig 1a we find Λ = 12.4 ± 0.3 µm which is
indeed slightly larger than 2p = 11 µm. Since the modulation orientation can be controlled by the CLC film thickness, our aim is to take advantage of the CLC modulated texture (Fig 1a) in order to monitor the NPs LSPR.
4
Figure 1. Upper panel: Texture of the CLC film deposited on a glass plate coated with a rubbed PVA layer. The texture
shows periodic dark and bright lines (modulation).
(a) Zoom on the modulation texture. The dashed lines mark the CLC modulation period Λ = 12.4 µm. (b) Schematic of the
cholesteric director rotation in side view. According to Baudry’s model, the figure shows a cross-section in a plane perpendicular to the stripes, along the white dashed line. In the lower part of the sample, the director is in a planar orientation and the cholesteric helix is perpendicular to the substrate. When approaching the CLC/air interface, the helix rotates and the director matches the homeotropic anchoring at the LC/air interface. This leads to the presence of a boundary layer of thickness p/2 in which the CLC helix is parallel to the substrate19, 20.
5
20 nm spherical NPs coated with citrate ions and prepared in water solution (25.1014 NPs/l) were synthesized following
Reference21. PolyVinylPyrrolidone (PVP at 0.2% in wt) was added in order to avoid NPs aggregation in water22. To improve
the miscibility of the NPs in the liquid crystal, 50% of acetonitril was added to the NPs/0.2%PVP solution. This NPs concentration corresponds to the sample referred to as S1. Another sample, S2, with a NP concentration 10 times larger than S1, was also studied.
20 µl of NPs solution was dropped onto the liquid crystal heated up at 55°C. This temperature was chosen to favor the NP mobility and to have the LC in its cholesteric phase. In all cases, the surface modulation of the CLC texture (Fig 1) is preserved after incorporation of the NPs. The modulation period is increased to about 15 µm compared to the initial value Λ= 12.4µm with no agglomeration between NPs visible by Optical Microscopy.
2.2 Extinction spectroscopy and SEM
The optical properties of the hybrid CLC/NPs system have been investigated by micro-spectrometry. The sample is illuminated using linearly polarized white light. In order to avoid the twisted structure of the CLC film that is likely to change the polarization of the incoming light, we performed the measurements by illuminating the CLC surface. The transmitted light is collected with a 50X objective (0.55 numerical aperture) and dispersed with a LOT Oriel MS260i spectro-photometer. Along with a 2 mm pinhole, this objective allows to probe a 100x100 µm2 area. In order to extract the extinction spectrum of
the gold NPs, a CLC film without gold NPs was used as reference. Both the CLC/NPs sample and the CLC reference were carefully aligned with respect to the incident polarization. All spectra were collected at room temperature in the 400-1000 nm spectral range.
We have also performed SEM measurements on a field emission, Zeiss Supra 40, Scanning Electron Microscope (SEM). Since a conductive substrate is required, we have prepared a sample similar to S2 but with the CLC film deposited on top of a conductive MoS2 substrate. Planar anchoring23 and formation of modulation stripes were confirmed by optical microscopy.
After deposition of the NPs the sample was heated at 80°C, in isotropic phase, in order to let the CLC slowly penetrate the bulk layered structure of MoS2 until it is completely drained. The agglomeration of the NPs, directly deposited on top of the
6
3. Results and discussion
3. 1 Non interacting and weakly interacting nanoparticles
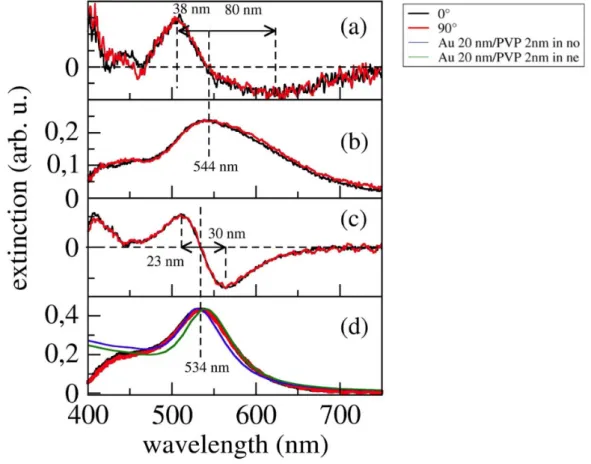
Figure 2. Extinction spectra (b and d) measured on sample S1 for incident light polarizations parallel (red) and perpendicular
(black) to the modulation stripes. Spectra (b) and (d) were recorded on two different points of the sample. Their first derivative are plotted in (a) and (c), respectively. In (d) are also shown the spectra calculated for 20 nm gold NP coated with 2nm PVP and surrounded by a medium with optical index no = 1.52 (blue) or ne = 1.75 (green).
Figures 2b and 2d show the extinction spectra of the hybrid CLC/20nm gold NPs film recorded on two different typical areas of sample S1 and for two perpendicular incident polarizations oriented with respect to the modulation stripes. From the inflexion points of the first derivative spectra shown in Fig2a and 2c we found the LSPRs at 544 ± 1nm and 534 ± 1nm, respectively (for both polarizations). The LSPRs are red-shifted with respect to that of NPs in water which has been found at 525 ± 1nm. It is well-known that increasing the optical index of the surrounding medium (from water to CLC) leads to a red-shift of the LSPR, in agreement with a CLC environment around the NPs. However, here the LSPR red-red-shift depends on the
7
considered area on the sample (Fig 2a, b and 2c, d) and attests of the sample inhomogeneity, certainly due to non-uniform evaporation of the solvent after drop deposition. This inhomogeneity is also attested by the dependence of the transmitted intensity on the probed area. Moreover, from the first derivative spectra (Fig 2b and 2d) one can notice that the LSPR lineshape (linewidth and asymmetry) also depends on the considered area. Indeed, in Fig2a and 2b, the LSPR is much broader (118 nm linewidth) and asymmetric (80 nm/38 nm = 2.1) than in Fig 2c and 2d (53 nm linewidth and 30 nm/23 nm = 1.3 asymmetry).
It is now a well-documented fact that the electromagnetic interaction between metal NPs leads to a hybridization of the surface plasmons which resonance wavelength increases with decreasing separation between the NPs (i.e. with increasing interaction)18, 24-27. Such interaction is responsible for red shift, broadening and asymmetry of the LSPR as observed in Fig
2a, b. Since in our sample the NPs concentration may fluctuate from area to area we expect a relatively narrow LSPR from isolated NPs (Fig2c, d) and a much broader LSPR, with asymmetry towards the red spectral region, from weakly interacting NPs (Fig 2a, b). The inter-particles interaction may also explain the slightly different LSPR wavelengths (534 and 544 nm in Fig 2c,d and Fig 2a,b, respectively). Indeed, weakly interacting NPs with randomly fluctuating inter-particles separations give rise to a spectral distribution of red-shifted surface plasmon resonances.
The incident light polarization has been oriented with respect to the modulation stripes (see Fig.1) in order to monitor the evolution of the LSPR with respect to the change of the CLC optical index from ne to no. The extinction spectra recorded with
incident light polarization parallel and perpendicular to the CLC modulation are very similar (Fig 2): the LSPRs are located at nearly the same wavelength and have the same intensity for both polarizations (Fig2b and 2d). This indicates that the NPs did not penetrate the modulated texture and should be located close to the CLC/air interface in a homeotropic environment. It is indeed known that a localization close to the air/ interface can correspond to a stable localization for NPs embedded in cholesteric materials28, 29. The presence of the NPs close to the CLC/air interface modifies the LC anchoring at air, which
explains the observed variation of the modulation period Λ upon deposition of the NPs19, 20.
In order to determine the environment of the NPs, we have simulated the optical extinction spectra using the discrete dipole approximation (DDA) as implemented in ddscat software30. We consider an isolated spherical gold NP, 20 nm in
diameter coated with a shell of PVP31. This core-shell NP is surrounded by a medium with optical index n
o = 1.52 or ne =
1.75. We used the dielectric properties of bulk gold32 corrected for the size dependent plasmon damping33.
The simulated spectra are compared in Fig 2d with the spectra measured for the isolated NPs. As expected, the LSPR shifts to longer wavelengths with optical index of the surrounding medium increasing from no to ne (Fig 2d). We found that
the PVP shell has an important influence on the LSPR red-shift. Indeed, without the PVP shell, the red-shift of the LSPR is overestimated. This is due to the fact that the optical index of PVP is 1.35 i.e. smaller than no and ne. Because of the PVP
shell, the sensitivity of the LSPR wavelength to the optical index of the environment is reduced. A good agreement between the measured and calculated spectra is obtained (Fig 2a) for an optical index no = 1.52 and a PVP shell of 2nm, which is
8
spectra in fig. 2b and fig. 2d show that the solvent evaporation was inhomogeneous, thus leading to (i) low density areas where the NP are well-separated and non-interacting and (ii) higher NP density areas where NPs are weakly interacting.
3.2 Strongly interacting nanoparticles
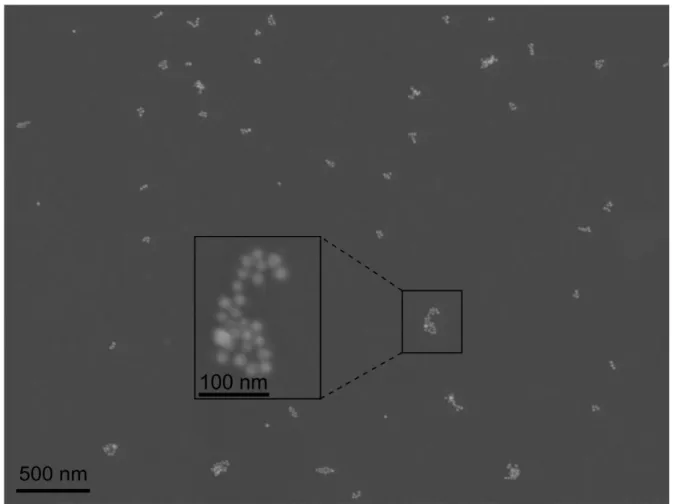
Figure 3. SEM image of sample prepared in the same conditions as sample S2, and deposited on a conducting MoS2
substrate. The CLC has been removed prior to SEM measurements.
The initial concentration of NPs in the colloidal solution has been increased by a factor 10 and a drop was deposited on the CLC film (sample S2). The SEM measurements (Figure 3) show that NPs clusters (from few tens to few hundreds of nanometers in size, with an average length of the order of 10 NPs) are formed as well as NPs chains. In these aggregates, the separation between NPs is well defined; the average separation was determined 0.6 ± 0.5 nm from the SEM.
Optical spectra were acquired from 10 different areas of sample S2 in order to probe the sample homogeneity. Unlike the case of sample 1, we found a good homogeneity attested by small spectral changes, suggesting that the solvent evaporation becomes more homogeneous when the NPs concentration is increased. Figure 4 shows typical extinction spectra measured
9
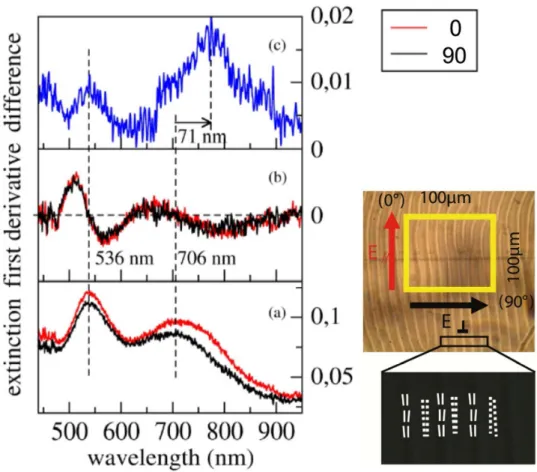
with incident polarization either parallel or perpendicular to the modulation stripes. The spectra from sample S2 exhibit two LSPRs (Fig. 4a). One is located at 536 ±2 nm, and was already observed in sample S1 (Fig.2a). In sample S2, there is an additional LSPR around 706 ± 8 nm. The indicated uncertainty reflects the LSPR wavelength variation with the probed areas on the sample for 10 measured areas. In contrast with sample S1, sample S2 exhibits changes of the LSPRs with orientation of the incident light polarization. No clear evidence for a red-shift of the LPSRs is found when changing the polarization from parallel to perpendicular with respect to the modulation stripes: the LSPR wavelengths, as determined from the first derivative of the extinction spectra (Fig 4b), are nearly the same for both polarizations. However, one notices a change of the red-shifted LSPR lineshape with polarization. Indeed, for polarization parallel to the modulation stripes, the extinction spectrum systematically exhibits an excess of red components (Fig 4a) as shown by the red-shifted band in the difference spectrum (Fig 4c). Moreover, for nearly half of the probed areas, when the incident polarization is changed from perpendicular to parallel to the modulation stripes, we observe an increase of the LSPRs intensities at 536 and 706 nm. This intensity dependence is systematically observed when both LSPR bands are spectrally well separated as in Fig 4a. This effect is pointed out in the difference spectrum shown in Fig 4c and was completely absent for isolated and weakly interacting NPs (Fig 2).
10
(black) to the modulation stripes. (b) First derivative of the measured spectra and (c) the difference between the spectra obtained for the two polarizations. Right: Optical microscopy image of the CLC texture modulation. The square represents the surface (100x100µm2) of the probed area. The orientations of the LC molecules are also sketched in this figure.
Since in sample S2 the NPs density is 10 times higher than in sample S1, interactions between the NPs are more likely to occur and it is well-known that such interactions may lead to red-shifted LSPRs18, 24-27, 34. In order to relate the LSPR band at
706 nm (Fig 4a) to an average separation between NPs we have performed DDA simulations. The fact that this LSPR comes out for both polarizations suggests that interactions between NPs take place in these both directions. Therefore, we considered two types of NPs arrangements: (i) NPs chains with randomly distributed orientations and (ii) NPs clusters. These two types of arrangements were indeed observed by SEM.
According to previous theoretical studies35, 36, small NP aggregates, like NPs dimers and trimers, cannot account for the
large LSPR red-shift observed in Fig 4a, while keeping within physically reasonable inter-particle separations. This suggests that the NPs agglomerates should contain a large number of NPs. Therefore, we have calculated the optical extinction spectra of NPs chains and aggregates containing up to 21 NPs. The calculations were performed for 20 nm gold NPs without the PVP shell in order to keep within a reasonable computation time. Nevertheless, instead of using no and ne for the optical
indices of the surrounding medium, we have determined effective optical indices noeff = 1.38 and neeff= 1.53. These values
give the same LSPR wavelengths for a 20 nm gold NP and for a 20 nm gold/2 nm PVP core-shell NP surrounded by medium with optical index equal to no or ne. In that way the effect of the PVP shell on the LSPR wavelength is somehow taken into
11
Figure 5. (a) Simulated extinction spectra for NP chains separated by 1 nm gap, in an optical index neeff. The number of NPs
within the chain is increased from N = 2 (dimer, in the lower trace) to N = 20 by increment of 2. The spectra are normalized to the geometric section πa2, a being the radius of the sphere of equivalent volume. The inset shows the red-shift of the LSPR
wavelength with increasing N and for 3 nm (blue), 2 nm (green), 1.5 nm (orange) and 1 nm (red) separations between the NPs. (b) Simulated extinction spectra for 21-NPs chains for 1.5 nm (blue lines) and 1 nm (red lines) gaps between NPs and embedded either in noeff=1.38 (full lines) or neeff= 1.53 (dashed lines).
12
Figure 5a shows the calculated spectra for nanoparticle chains with 1nm gap between nanoparticles. The incident polarization is parallel to the chain and the optical index of the surrounding medium is neeff. As already reported in several
studies18, 24-27, because of the electromagnetic interaction between the nanoparticles, the collective electronic oscillations
along the chain give rise to a longitudinal surface plasmon resonance. The resonance wavelength is red shifted with increasing length of the chain as shown in Fig 5a. The red shift becomes very pronounced with decreasing separation between the NPs (see inset in Fig. 5a). The interesting point is that, for a given separation between the NPs, the red shift comes to saturation with increasing chain length37-39. This saturation effect occurs because the surface plasmons have a finite
coherence length that decreases with increasing separation between neighboring NPs.
For polarization perpendicular to the stripes, the NPs embedded in the modulated texture should experience the effect of a surrounding medium with noeff as well as the NP located at the LC/air interface. In the former case, the LC director rotates
around an axis perpendicular to the stripe and is therefore always perpendicular to the polarization (see figure 1). Figure 5b shows that, for 21 NPs chains and gaps between NPs of 1nm, when the optical index is changed from neeff to noeff, the LSPR
wavelength drops down to 670nm. This value is somewhat smaller but close to the experimental value of 706 nm suggesting a separation between the NPs smaller than 1nm and a PVP shell compressed in the gap region between NPs, which could be indeed the case since PVP consists in quite flexible organic chains. This result is in agreement with the SEM images, which indicate a separation of 0.6 nm between NPs. We have thus calculated the LSPR wavelength at saturation (31 NPs) for a 0.6nm separation between NPs and an optical index noeff. We found a value λ = 753nm which is higher than the measured
13
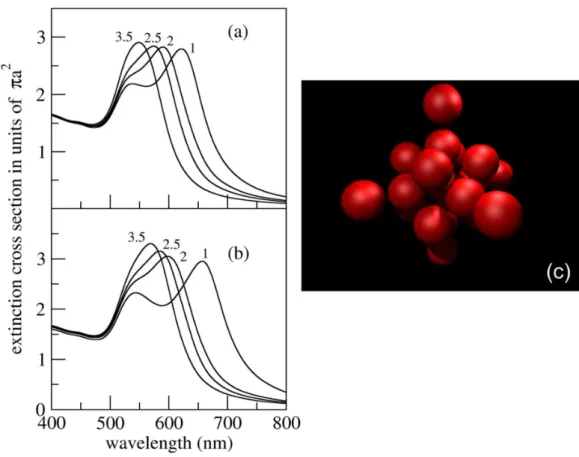
Figure 6. Simulated extinction spectra of NPs aggregates embedded either in noeff = 1.38 (a) or neeff =1.53 (b). The spectra
are normalized to the geometric section πa2, a being the radius of the sphere of equivalent volume. The NPs size is 20 nm and
the separation between first neighboring NPs has been varied from 1 nm to 3.5 nm as indicated by the numbers attached to each spectrum. (c) Schematic of the model aggregate.
As mentioned above, the NPs could also form aggregates. The interaction between the NPs within an aggregate may lead to a red-shifted LSPR as well. Therefore we simulated the extinction spectra of aggregates consisting of 21 NPs with separations between first neighboring NPs ranging from 1 to 3.5 nm (Figure 6). The NPs inside each cluster are distributed as shown in Figure 6c. Both red-shifted and single particle like LSPR come out (for both incident polarizations) because the cluster contains NPs chains, that are both parallel and perpendicular to the incident polarization, and quasi-isolated NPs (at the cluster periphery) with resonance close to the 536 nm isolated NP LSPR. As expected, the resonance wavelength of the red-shifted LSPR decreases with increasing separation between the NPs (Figure 6). It is around 640 nm for 1nm separation between first neighboring NPs and for noeff =1.38. This value is smaller than the saturation wavelength 670nm calculated for
the chain consisting of 21 NPs separated by 1 nm, because the 21 NPs cluster has a smaller size than the equivalent chain. Indeed, as can be seen in the model cluster (Fig. 6c), there are only 5 NPs along the aggregate diameter and the LSPR
14
wavelength is very close to the one of a 5-NPs chain (fig. 5a and 6b). This means that to account for the measured LSPR wavelength (706 nm ± 8 nm), 0.6 nm separation between NPs is required as shown by SEM results, but also cluster lengths in average smaller than 31 NPs, still in agreement with SEM results (Figure 3).
Let us now comment on the dependence of the red-shifted LSPR lineshape on the polarization orientation reported in Fig. 4. As shown in the difference spectrum in Fig 4c, changing the polarization from perpendicular to parallel to the modulation stripes gives rise to additional red spectral components in the extinction spectrum. This polarization effect can be accounted for by (i) the birefringent character of the modulated texture, (ii) an anisotropic distribution of the NPs agglomerations connected with the orientation of the modulation stripes.
For (i), when the polarization is changed from perpendicular to parallel to the modulation stripes, the optical index increases within the modulation texture and could lead to a red-shift of the 706nm LSPR, as evidenced by the simulations (fig. 5b, fig. 6). However it appears that the separation between NPs is around 0.6 nm whereas the LC molecular length is of the order of 2 nm. Thus LC molecules cannot be parallel to the coupling direction due to the small inter-particle space. In other words, the optical environment in the gap between NPs should be associated with an optical index close to noeff
corresponding to a LC optical axis tilted with respect to the coupling direction. Therefore, we do not expect a significant influence of the birefringence in the case of strongly coupled NPs.
For (ii), the modulated texture of the LC could drive the formation of NPs chains and/or clusters orientated along the stripes. NPs chains aligned along the stripes should lead to red-shifted LSPR associated with increase of extinction when polarization is changed from perpendicular to parallel to the stripes, in agreement with the experimental observations in figure 4. This is also expected for elongated clusters orientated along the stripes. Therefore, we may conclude that in our system, part of the NPs chains and/or clusters is oriented by the modulation stripes associated with the LC texture. According to the SEM, chains and anisotropic clusters are indeed present. However, no preferential orientation has been evidenced (Fig. 3). On MoS2, the orientation of the NPs chains and clusters may have been lost due to the spreading/removal of the CLC
required for SEM visualization.
These results finally demonstrate that, for high concentration, the NPs penetrate the modulated texture. It has been reported for small NPs (diameter 3nm), that demixing of NPs in CLC is favored, thus leading to localization of the NPs at the air/CLC interface28, 29. Such demixing may also take place in our system as observed at low NPs concentration (sample S1).
However this demixing may be competing with cluster formation induced by Van der Waals interactions between the NPs. Large NPs clusters, observed by optical microscopy, have been shown to coexist with NPs self-organization at the CLC/air interface for small NPs27. However, in our system, the cluster size remains limited, of the order of 10NPs in length, in
agreement with the fact that they remain invisible by optical microscopy. It is known that in nematic LCs4, 5, contrary to
smectics15, aggregation between NPs occurs easily. Due to the large CLC pitch (compared to the NPs diameter), the
15
with a preferred orientation along the modulation stripes. This phenomenon may be associated with the attraction between LC defects and colloids in nematics40 which is known to increase with the size of the colloids41. A critical size of the NPs
clusters may be defined, below which aggregation between NPs is favored, and above which attraction occurs between clusters of NPs and the highly deformed area located between bulk and modulation. This would lead to the observed stabilization of the hybrid system with an anisotropy of the clusters, preferably oriented along the modulation stripes. In order to confirm and better explore this phenomenon, further studies in which cholesteric pitch would be varied are now highly desirable.
4. Conclusion
We have investigated a hybrid LC/NPs nano-material that makes use of the LC texture modulation, characteristic of CLC films, for the control of NPs agglomeration and localisation. We found that, owing to the penetration of the NPs within the CLC texture at high concentrations, strong interactions between the NPs take place. This was evidenced by the observation of a strongly red-shifted LSPR that exhibited sensitivity to the polarization of the incident light. The interaction between the NPs within simple configurations of chains and regular aggregates has been investigated using DDA simulations. The latter allowed for addressing the main physical parameters that determine the red-shifted LSPR wavelength (chain length, aggregate size, inter-particle separation, optical index of surrounding medium). Our results show that in the hybrid LC/NPs nanomaterial the control of the optical response of the metal NPs could be achieved not only by monitoring the LC birefringence, but also by driving the formation of NPs aggregates using the LC texture. Our results point out the potential use of the molecular organization in LCs for the engineering of new smart nanomaterials.
Acknowledgements
This work was supported by the French National Research Agency (ANR contract N° ANR-07-Nano-032, “NP/CL”) and by CALMIP Computing facilities at Paul Sabatier University of Toulouse.
Notes and references
a CNRS, UMR 7588, Institut des NanoSciences de Paris (INSP), 4 place Jussieu 75005 PARIS, France, emmanuelle.lacaze@insp.jussieu.fr
b UPMC Univ Paris 06, UMR 7588, Institut des NanoSciences de Paris (INSP), 4 place Jussieu 75005 PARIS, France c Laboratoire Interfaces, Traitements, Organisation et Dynamique des Systèmes (ITODYS), Université Paris Diderot, Sorbonne Paris Cité, ITODYS, UMR 7086 CNRS, 15 rue J-A de Baïf, 75205 Paris Cedex 13, France.dc Centre d’Elaboration de Matériaux et d’Etudes Structurales, CNRS/Université de Toulouse, 29 rue Jeanne Marvig, 31055 Toulouse, France.
16
1 V. Kozlovskaya, E. Kharlampieva, B. P. Khanal, P. Manna, E. R. Zubarev and V. V. Tsukruk, Chem. Mater. 2008, 20, 7474-7485.
2 A. Cunningham, S. Mühlig, C. Rockstuhl and T. Bürgi, J. Phys. Chem. C 2011, 115, 8955-8960.
3 G. Raschke, S. Brogl, A.S. Susha, A. L. Rogach, T.A. Klar and J. Feldmnn, Nano. Lett. 2004, 10, 1853-1857.
4 T. Hegmann, H. Qi and V. M. Marx, J. of Inorg. and Organometallic Poyl. and Mat., 2007, 17, 483.
5 H. K. Bisoyi and S. Kumar, Chem. Soc. Rev., 2011, 40, 306.
6 I. C. Khoo, D. H. Werner, X. Liang, A. Diaz and B. Weiner, Opt. Lett. 2006, 31, 2592.
7 O. Kurochkin, H. Atkuri, O. Buchnev, A. Glushenko, O. Grabar, R. Karapinar, V. Reshetnyak, J. West and Y. Reznikov,
Cond. Mat. Phys. 2010, 13, 337001.
8 N. Podoliak, O. Buchnev, O. Buluy, G. d’Alessandro, M. Kaczmarek, Y. Reznikov and T. Sluckin, Soft Matter. 2011, 7, 4742.
9 C. Da Cruz, O. Sandre and V. Cabuil, J. Phys. Chem. B 2005, 109, 14292.
10 P. A. Kossyrev, A. Yin, S. G. Cloutier, D. A. Cardimona, D. Huang, P. M. Alsing, and J. M. Xu, Nanoletters, 2005, 5, 1978.
11 K. C. Chua, C. Y. Chao, Y. F. Chen, Y. C. Wu and C. C. Chen, Appl. Phys. Lett. 2006, 89, 103107.
12 Q. Liu, Y. Cui, D. Gardner, X. Li, S. He and I. Smalyukh, Nano. Lett. 2010, 10, 1347.
13 J. Müller, C. Sönnichsen, H. Von Poschinger, G. Von Plessen, T. A. Klar and J. Feldmann, Appl. Phys. Lett. 2002, 81, 171.
14 R.Pratibha, K. Park, I. I. Smalyukh and W. Park, Optics Express, 2009, 17, 19459.
15 R. Pratibha, K. Park and I. I. Smalyukh, J. Appl. Phys. 2010, 107, 063511.
16 B. Kletsov, V. Zharov, A. Melnikov, V. Tuchin and N. Khlebtsov, Nanotechn. 2006, 17, 5167.
17 J.M. Romo-Herra, R.A. Alvarez-Puebla and L.M. Liz-Marzan Nanoscale, 2011, 3, 1304-1315.
18 N. G. Khlebtsov and L. A. Dykman, Journal of Quantitative Spectroscopy & Radiative Transfer 2010, 111, 1.
17
20 A. Bosco, Mahthild, G. M.Jongejan, R. Eelkema, N. Katsonis, E. Lacaze, A. Ferrarini and Ben L. Feringa, J. AM. CHEM.
SOC. 2008, 130, 14615.
21 G. Frens, Nature Phys. Sci. 1973, 241, 20.
22 M. Bardají, P. Uznanski, C. Amiens, B. Chaudret and A. Laguna, Chem. Commun. 2002, 6, 598.
23 E. Lacaze, J. P. Michel, M. Goldmann, M. Gailhanou, M. Boissieu and M. Alba, Phys. Rev. E, 2004, 69, 041705.
24 H. Yockell-Lelievre, D. Gingras, R. Vallée and A. M. Ritcey, J. Phys. Chem. C 2009, 113, 21293.
25 M. Pelton, J. Aizpurua and G. Bryant, Laser & Photon. Rev. 2008, 2, 136.
26 C. Girard, Rep. Prog. Phys. 2005, 68, 1883.
27 S. Tripathy, R. Marty, V. K. Lin, S. L. Teo, Ye E. Arbouet, A. Arnaud, L. Saviot, C. Girard, M. Y. Han and A. Mlayah,
Nanolett. 2011, 11, 431.
28 M. Mitov, C. Portet, C. Bourgerette, E. Snoeck and M. Verelst, Nature mat. 2002, 1, 229.
29 R. Bitaar, G. Agar and M. Mitov, Soft Matter 2011, 7, 8198.
30 B. T. Draine and P. J. Flatau, J. Opt. Soc. Am. A 2008, 25, 2693; B. T. Draine and P. J. Flatau, User Guide to the Discrete Dipole Approximation Code DDSCAT 7.0, arXiv:0809.0337v5.
31 P.B. Johnson and R.W. Christy, Phys Rev B, 1972, 6, 4370.
32 F. Hache, D. Richard and C. Flytzanis, Journ. Opt. Soc. Am. B 1986, 3, 1647.
33 U. Kreibig and M. Vollmer, Springer Series in Material Science 1995, 25.
34. Ch. Girard and E. Dujardin, J. Opt. A: Pure Appl. Opt. 2006, 8, S73.
35 M. Dridi and A. Vial, Opt. Lett. 2009, 34, 2652.
36 K. P. Jain and M. A. El-Sayed, Chem. Phys. Lett., 2010, 487, 153.
37 F. Bonell, A. Sanchot, E. Dujardin, R. Péchou, C. Girard, J. Chem. Phys. 2009 130, 034702.
38 S. Lin, M. Li, E. Dujardin, C. Girard, and S. Mann, Adv. Mater. 2005, 17, 2553.
39 S. J. Barrow, A. M. Funston, D. E. Gomez, T. J. Davis and P. Mulvaney, NanoLett. 2011, 11, 4180-4187.