HAL Id: cea-01400872
https://hal-cea.archives-ouvertes.fr/cea-01400872
Submitted on 12 Feb 2018
HAL is a multi-disciplinary open access
archive for the deposit and dissemination of
sci-entific research documents, whether they are
pub-lished or not. The documents may come from
teaching and research institutions in France or
abroad, or from public or private research centers.
L’archive ouverte pluridisciplinaire HAL, est
destinée au dépôt et à la diffusion de documents
scientifiques de niveau recherche, publiés ou non,
émanant des établissements d’enseignement et de
recherche français ou étrangers, des laboratoires
publics ou privés.
Magnetic Configurations in Co/Cu Multilayered
Nanowires: Evidence of Structural and Magnetic
Interplay
David Fernando Reyes Vasquez, Nicolas Biziere, Bénédicte Warot-Fonrose, T.
Wade, Christophe Gatel
To cite this version:
David Fernando Reyes Vasquez, Nicolas Biziere, Bénédicte Warot-Fonrose, T. Wade, Christophe
Gatel.
Magnetic Configurations in Co/Cu Multilayered Nanowires:
Evidence of Structural
and Magnetic Interplay .
Nano Letters, American Chemical Society, 2016, 16, pp.1230-1236.
�10.1021/acs.nanolett.5b04553�. �cea-01400872�
Magnetic configurations in Co/Cu multilayered nanowires: Evidence of
structural and magnetic interplay
D. Reyes1, N. Biziere1, B. Warot-Fonrose1, T. Wade2, C. Gatel1*
1 CEMES CNRS-UPR 8011, Université de Toulouse, 31055 Toulouse, France
2
Laboratoire des Solides Irradiés, Ecole Polytechnique, CNRS, CEA, Université Paris Saclay, F 91128 Palaiseau, France
Corresponding author: gatel@cemes.fr
Abstract: Off-axis electron holography experiments have been combined with micromagnetic simulations to study the remnant magnetic states of electrodeposited Co/Cu multilayered nanocylinders. Structural and chemical data obtained by transmission electron microscopy have been introduced in the simulations. Three different magnetic configurations such as an antiparallel coupling of the Co layers, coupled vortices and a mono-domain like state have been quantitatively mapped and simulated. While most of the wires present the same remnant state whatever the direction of the saturation field, we show that some layers can present a change from an antiparallel coupling to vortices. Such a configuration can be of particular interest to design nano-oscillators with two different working frequencies.
Keywords: magnetic configuration, electron holography, micromagnetic simulation, nanowire, vortex state,
INTRODUCTION
Nanowires are one of the essential components of new technologies due to their potential in the field of spintronics1–4 , gas sensors5,6 and energetic storage7. Magnetic nanowires have raised significant interest in the last 15 years due to their potential for spintronics devices. Among them, multi-layered nanowires are particularly interesting for fundamental studies of magnetic interactions at the nanoscale and very good candidates to produce spin-torque nano-oscillators connected in series in order to increase RF output power8–
10
. Therefore, technical achievements in spintronics require a detailed description of the magnetic states in each layer at the remnant state. These states reflect the competition between the shape and crystal anisotropies, the exchange interactions and the interlayer dipolar coupling.
The magnetic properties of nanowires have been studied in different systems through several works11–15. However, few studies have focused on the magnetic states of isolated nanowires 16-18. The observation of magnetization in individual nanowires requires techniques combining high sensitivity and spatial resolution. Transmission Electron Microscopy (TEM) is the appropriate tool: its broad sensitivity ranges from atomic structure to electromagnetic fields and includes atomic-scale analysis of valence states and chemistry. Its ability to probe individual nano-objects instead of assemblies of nano-objects provides a remarkable potential for discoveries. Among the different TEM methods, off-axis electron holography (EH)19 is a powerful interferometric method, giving access to the in-plane induction inside and outside of the nano-object.20,21 A recent study has for instance presented the 3D vectorial magnetic analysis using EH on two Fe platelets separated by a Cr layer. They demonstrated the appearance of coupled vortices between Fe disks. 22
Very few studies using EH have been performed on magnetic nanowires23-25, particularly for multilayered nanowires26–28. Beeli et al.26 have studied the stray field of Co/Cu nanowires and observed that their remnant states vary with both their diameter and the direction of the magnetic field applied before the observations. Several magnetic configurations were confirmed, changing from parallel to antiparallel coupling between the Co layers. More recently, Akhtari-Zavareh et al.27 have analyzed the magnetic states of Cu/CoFeB multilayered nanowires after applying a magnetic field parallel or perpendicular to the axis of the wire. They found an antiparallel coupling between the magnetic layers and a flower state in other cases. Two others recent studies have mapped the magnetic induction of Co and CoNi nanowires and correlated the magnetization distribution with the structural and chemical properties obtained by different TEM methods.24,28
In our work Co/Cu multilayers in nanocylinders are grown by template synthesis 29–32. This method is one of the most used techniques due to the ability to obtain nanowires with different sizes, shapes and composition in a relatively easy and inexpensive way. The magnetic configurations of these nanocylinders are quantitatively mapped by electron holography with a spatial resolution of 2 nm while the structural and chemical characterizations of the layers are performed by high resolution TEM (HRTEM) associated with electron energy-loss spectroscopy and imaging. Using 3D micromagnetic simulations including the geometrical parameters extracted from electron microscopy experiments, we recover the different remnant configurations by electron
phase shift reconstruction. We show that three different states can clearly be identified. Moreover, the appearance of each state depends on the direction of the saturation field. More particularly a transition from an antiparallel magnetic coupling of the Co layers to coupled vortices can be obtained in particular cases. The study of several cobalt layers is mandatory to observe transitions between these states, as dipolar coupling between the layers has to be taken into account. These magnetic configurations could be of great relevance for spin torque nanoscillators as it gives access to two different working frequencies. We succeeded to reproduce the different magnetic behaviors within a model for which the magnetic parameters reflect the polycrystalline nature of the layers.
EXPERIMENT
Multilayered nanowires with diameters ranging from 55 to 80 nm were grown by electrodeposition in commercial polycarbonate membranes (Maine Manufacturing, LLC). Details about the process and methods can be found in reference [32]. The deposition was carried out using a potentiostat in pulsed mode, with a reference electrode of Ag/AgCl and a gold film deposited on one side of the membrane acting as the working electrode. The membrane is immersed in a single bath solution containing 74 g/L CoSO4
.
H2O, 1.6 g/L CuSO4 and
45 g/L H3BO4. The potential used for the Co and Cu deposition are -1.0 V for 1 s and -0.3 V for 10 s respectively.
Pulse cycles are repeated about 150 times. Special care was taken during the dissolution of the membrane in dichloromethane before depositing nanowires on a holey carbon grid for electron microscopy observation. The cleaning procedure allowing minimization of noise and artifacts coming from the membrane is detailed in the Supporting Information. Structural and chemical characterizations were performed by transmission electron microscopy on a Tecnai F20 FEG at 200keV equipped with an aberration corrector and a GIF Tridiem to acquire elementary maps of Cu and Co using the three windows method33.
Off-axis electron holography19 (EH) was performed using a dedicated HF3300 Hitachi TEM fitted with a cold field emission gun to achieve a high phase shift sensitivity, and a special corrected Lorentz mode allowing an unprecedented spatial resolution of 0.5 nm in a perfect magnetic field-free sample environment. Holograms have been acquired with 1 nm fringe spacing. The magnetic and electric contributions to the total phase are separated by subtracting two holograms where the sample is flipped thanks to a special sample holder that allows 180° rotation of the sample. The final spatial resolution of the magnetic induction mapping is 2 nm, only limited by the post-data processing (see Supporting Informations for more details).
One of the major interests of our work consists in quantitatively mapping the magnetic configurations at remanence on the same layers of the same nanowire. Prior to the first EH observation, the nanowires have been saturated using a magnetic field of 1.3T produced by an external electromagnet in the direction parallel to the wire axis. Then a second observation is performed for an ex situ saturation field perpendicular to the wire axis. The magnetic phase images have been extracted for each applied magnetic field and directly simulated and compared.
RESULTS AND ANALYSIS
As already mentioned, the magnetic interactions strongly depend upon the structural properties of the layers like the diameter, the thickness and spacing as well as chemical composition. Therefore, the structural and chemical properties of the nanocylinders have to be first studied before performing EH experiments. Micromagnetic simulations will have to include these parameters in order to precisely describe the magnetic behavior.
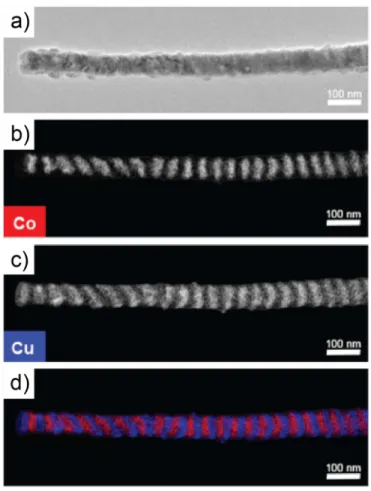
Figure 1a shows a TEM image of a representative wire with a mean diameter of 64 ± 2 nm. Local chemical analysis has been performed by electron energy loss spectroscopy (EELS) and energy filtered TEM to distinguish the layers. Figures 1b and 1c present the elemental maps of Co and Cu respectively for the same wire as the one shown on Figure 1a. Figure 1d is the combination of the previous maps where the alternation of Co and Cu layers is clearly seen in red and blue respectively. We also observed that some of the layers are rotated a few degrees with respect to the wire axis. While Co impurities are barely visible in the Cu layers, a non-negligible amount of Cu seems to be present into the Co layers.
Figure 1. a) TEM image of a wire. b) EFTEM image of the wire recorded at the cobalt edge, c) EFTEM image of
the wire recorded at the copper edge. d) Cobalt (red) and copper (blue) map as the result of the superimposition of b) and c) maps.
In order to quantify the proportion of the Cu impurities, EELS spectra have been recorded on Co/Cu multilayered nanocylinders (see Supporting Information). The extracted data confirm that very little Co is included into the Cu layers, but give a Cu amount of about 15% in the Co part. This result, already reported in other works18,34,35 dealing with electrodeposition process, is explained by the single bath method: as the deposition potential is lower for Co (-1 V) than for the Cu (-0.3 V), a small amount of Cu is co-deposited during the Co deposition.
Statistical analysis performed from energy filtered TEM (EFTEM) images on tens of layers observed in the different wires gives an average thickness of 24 +/- 4 nm and 14 +/- 4 nm for the cobalt and copper layers respectively. The tilt angle of the layers with respect to the wires axis ranges from 0 to 40 degrees with an average of 10 degrees. HRTEM and diffraction experiments have also been performed to determine the structural properties and particularly to know the orientation of the grains inside the layers as well as their size. The cobalt presents a polycrystalline texture with a preferential fcc structure (see Supporting Information). This observation is corroborated by the presence of Cu into the Co layers which favors the fcc structure36,37. Our statistical analysis shows that the grain orientation within the layers is randomly distributed with no preferential orientation. The grain size is quite difficult to determine from this polycrystalline texture but can be evaluated to a few nanometers from HRTEM images.
Figure 2 presents two different remnant magnetic states on the same part of a typical nanocylinder. Figures 2a and 2b show the hologram and the chemical map obtained by EFTEM. The magnetic phase images extracted from the holograms are given in Figure 2c and 2d. They correspond respectively to the remnant magnetic states of the same layers for an applied field parallel (defined as the Z direction) and perpendicular (X direction) with respect of the wire axis. The positions of the Co and Cu layers deduced from the EFTEM chemical maps have been added for clarity on each figure. We can clearly observe that the two experimental remnant states are different as a function of the direction of the applied field. In Figure 2c the isophase lines parallel to the Z direction reflects an integrated magnetization pointing toward the wire axis. Differently, Figure 2d shows an alternation of contrasts corresponding to magnetizations in opposite X-directions from one Co layer to the other (see simulations in Figure 4b and d). However, as EH is sensitive to the in plane components of the magnetic induction one needs both qualitative and quantitative analysis of the experimental phase shift in order to deeper understand the magnetic configurations related to each magnetic phase images. For example, such features in Figure 2c could be characteristic of a monodomain state (uniform magnetization) or a vortex state along the wire axis.
Figure 2. a) TEM image of the observed wire. b) EFTEM image of the same area to distinguish the copper (blue)
and cobalt (red) layers. c) Magnetic phase shift map obtained after the application of the parallel saturation field with respect to the wire axis. d) Magnetic phase shift map obtained after the application of the saturation field perpendicularly to the wire axis.
To accomplish this, the 3D remnant magnetic states and stray fields of 20 bilayers of Co/Cu have been calculated using the 3D 38 freeware in a universe of 1000 x 500 x 500 nm3 with a cell size of 2 nm corresponding to the spatial resolution of the experimental magnetic phase images. The saturation field is applied at 10° from the Z or X axis in order to reproduce the uncertainty of the experimental conditions. However, we verified that all simulations performed with angles less than 10 ° lead to similar results.. Geometrical parameters obtained from structural and chemical studies are implemented in the 3D calculations (averaged tilted angle of the layers, thicknesses and diameter). More precisely, the magnetic diameter used for the simulations is the one measured by TEM (64 nm) and corresponds to the Co diameter without considering the oxidation layer estimated at about 1 nm (included within the incertitude of measurement). The magnetization of the Co layers was set to be 1200 103 A/m (µ0Ms 1.5 T) which is the averaged value determined from electron holography
experiments on Co nanocylinders grown from the same electrochemical bath (not shown here). This value is slightly lower than for the bulk most probably due to Cu impurities into the Co. Finally, the adjustable magnetic parameters in the simulations are the direction and amplitude of the crystal anisotropy constant as well as the exchange value A. In order to take into account the polycrystalline nature of the Co layers, we choose to define
a simple model with an uniaxial crystal anisotropy which is randomly distributed from one layer to the other, instead of a cubic anisotropy as for fcc materials.
Based on these simulations we calculated the corresponding in plane components of the induction field B before integrating them along the electron path (direction Y in the figures) to obtain the electron phase shift map using the Aharanov-Bohm equation (see Supporting Information). This simulated magnetic phase image was then quantitatively compared to the experimental one to discretize between the different observed magnetic states. The exchange and anisotropy values were adjusted in order to reproduce the magnetic behavior as a function of the saturation field but also to get a quantitative agreement between the experimental and the calculated magnetic phase shift.
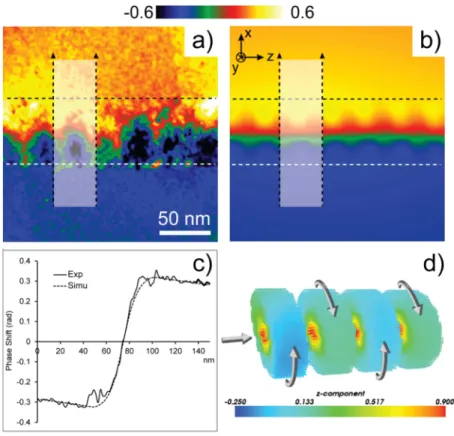
The results of our method are presented in Figures 3 and 4 which correspond to the magnetic states observed in Figures 2c and d. The remnant state in Figure 3 corresponds to magnetic vortices in each Co layers, with the cores of the vortices pointing along the wire axis (see 3D simulation in Figure 3d). It is worth mentioning that vortices often show an alternatively clockwise and anticlockwise orientation due to the initial inter layer coupling when the field is decreased from saturation. But it is not possible to discern between these clockwise or anti-clockwise orientations using EH, only the direction of the vortex core can be determined. The magnetic state in Figure 4 is found as an antiparallel coupling of the magnetizations in the Co layers. The variation of the phase shift is located within the Co layers and remains the same in the Cu layers where no magnetic signal is present. Interestingly, we note that the amplitude varies from one layer to another. The magnetization direction in each individual Co layer is slightly different because of the randomly distributed anisotropy direction in each layer (see discussion below). Here we succeed to adjust this parameter for a few layers in order to fit the experiment.
These conclusions are based on the direct quantitative comparison of the simulated (Figures 3b and 4b) and experimental (Figures 3a and 4a) phase images. The magnetic simulations reproduce the experimental magnetic behavior as a function of the direction of the applied field and propose a perfect quantitative agreement as shown by the extracted phase profiles (located by the arrows in Figures 3a and 3b) averaged over one or two Co/Cu periods. To get such agreement, the exchange constant A has been set to 22. 10-12 J.m-1. This exchange value is especially important because it defines (also with the anisotropy constant but to a much less extent) the size of the vortex core. As the component of the magnetization pointing in the Z direction sets the amplitude of the phase shift, a direct correlation between the phase shift amplitude and the exchange constant in the vortex state can be established. In order to reproduce the transition between the antiparallel state to the coupled vortices, with the quantitative agreement of the phase shift amplitude in the vortex state, the anisotropy constant has been set to 100.103J.m-3 and the direction of the anisotropy has been randomly distributed from one layer to the other in a cone with a 20° aperture angle from the normal of the layers.
The antiparallel coupling is the most difficult configuration to fit (Figure 4). Indeed, if the random distribution of the anisotropy axis has a small effect on the vortices amplitude, its impact upon the
magnetization orientation in the antiparallel state, and so on the related phase shift is important. Indeed, the phase shift amplitude will be maximum (resp. minimum) if the magnetization points in the X (resp. Y) direction. While the global behavior of the numerous layers is faithfully reproduced, it is very challenging to recover the anisotropy directions of all the layers by fitting quantitatively the experimental signal. However, we show that our method is powerful enough to recover the magnetic parameters of the different layers.
Figure 3.a) Experimental magnetic phase shift map extracted from the holograms. b) Result of the simulated magnetic phase map. c) Comparison of the experimental and simulated profiles of the phase shift obtained on the dotted rectangle drawn on a). d) 3D magnetic configuration of the cobalt layers corresponding to the simulated phase image in b).
As already mentioned, our model for micromagnetic simulations is simplified in order to take into account the polycristallinity of the layers (uniaxial anisotropy instead of cubic for fcc materials). While the magnetization decrease can be accounted by Cu impurities in the Co, the lower values of the exchange and anisotropy constants have been observed in others studies39–42. For example, Henry et al. found that the anisotropy axis of electrodeposited hcp Co nanocylinders rotates from perpendicular to almost parallel to the wire axis at a critical diameter value around 60 nm, leading to a decrease of the measured anisotropy constant down to 200.103 J.m-3 at the transition due to the random distribution of the grains. In our study, we believe we encounter a similar situation. It is worth reminding that the exchange and anisotropy parameters we deduce here rely on the averaged magnetization value of 1200.103 A.m-1 set for the simulations. For another set of parameters, one could obtain slightly different values.
Figure 4. a) Experimental magnetic phase shift map extracted from the holograms. b) Result of the simulated
phase shift map. c) Comparison of the experimental and simulated profiles of the magnetic phase shift obtained along the white arrow on a). d) 3D magnetic configuration of the cobalt layers corresponding the simulated phase image in b).
Reproducing our methodology for the 20 different wires, we demonstrate that another remnant magnetic state can appear in others nanocylinders. Additionally to the antiparallel and vortices configurations presented above, we also observed a monodomain like state for which all the magnetizations of the Co layers point uniformly in the wire axis direction (Figure 5). The phase image shows similar features as coupled vortices but the amplitude of the phase shift extracted on one Co/Cu period is here about 3 times higher. Then it is interesting to note that discretization between the vortex and monodomain states can be done only by quantitative analysis.
Figure 5. a) EFTEM image of the studied wire. b) Experimental magnetic phase shift map with the
corresponding induction lines (in black). c) Comparison of the experimental and simulated profiles of the phase shift obtained for the rectangle drawn on figure 5b. d) Simulated magnetic phase shift map with the
corresponding induction lines (in black).e) 3D magnetic configuration of the cobalt layers corresponding to the simulated phase image in d).
Finally, we can also do some statistics on the different magnetic behavior as a function of the saturation field direction. Indeed, while some layers show a transition from antiparallel to vortices, some layers always exhibit the same remnant state which can be either antiparallel coupling or monodomain like. These different behaviors can be explained by the competition between the different magnetic interactions. Typically in a
single magnetic disk43, with similar diameter and thickness, one could expect vortex or in plane magnetization. In the case of multilayers, the dipolar coupling plays a crucial role. In order to fully explain every magnetic configuration one should lead a full micromagnetic analysis to get the phase diagram of the magnetic states Vs. the amplitude and direction of anisotropy. Even if this is far beyond the scope of this paper we are able to give some limit cases depending on the magnetic behavior observed.
First if the averaged anisotropy direction in the Co layers is mostly in plane, the magnetizations will remain in plane whatever the direction of the applied field with a preferred antiparallel coupling due to the dipolar interaction between Co layers. This configuration is the most common in our wires (≈ 70%). If the anisotropy direction is mostly oriented around the normal of the layers, several configurations can arise. If the combined effect of the crystal anisotropy and dipolar coupling between layers is sufficient to counter balance the shape anisotropy, the magnetizations will exhibit a mono domain like behavior. This configuration has been obtained on a few wires (≈ 10%) and has been reproduced in the simulations (as for example in Fig 5e) for an anisotropy constant above 200.103 J.m-3 randomly orientated around the normal of the Co layers in a cone with an aperture angle up to 20°. It is interesting to note that such values of anisotropy amplitude and direction are similar to the one observed in 39–42 in hcp electrodeposited Co. Generally in such nanowires with a polycrystalline texture, Co presents many structural defects as stacking faults. It can become difficult to make the difference between hcp and fcc structures: it is then possible to get polycrystalline Co with structural properties mainly similar to fcc but with some magnetic characteristics corresponding to an hcp structure. For lower values of the anisotropy constant, the crystal anisotropy will still tend to keep the magnetization out of plane but the shape anisotropy will push the spin parallel to the wire axis. This leads to transition between vortices when the field is parallel to the wire axis to antiparallel coupling for the perpendicular field. This configuration appears for about 20% of the wires. Typically such magnetic transitions appear if the anisotropy constant is below 180. 103 J/m3 and if the anisotropy is distributed within a 40° cone aperture. Details about our procedure to obtained these values are given in the SI.
Obviously, every configuration will be strongly dependent upon the structural properties and intrinsic magnetic parameters of the individual layers. Therefore, in order to get a much better control on the magnetic behavior of such a multilayer system and then considering spintronics devices, our study shows that a good control of the material growth conditions must be achieved.
CONCLUSIONS
Electron holography has been used to reveal the different remnant magnetic states in Co/Cu multilayered nanocylinders. We demonstrated that the magnetizations can show an antiparallel coupling, coupled vortices or monodomain configurations as a function of the direction of the saturation field and structural properties. Combining structural characterization at the nanometer scale with micromagnetic simulations allowed qualitative and quantitative analysis to reproduce the magnetic history of the magnetic layers. Taking into account the mean structural parameters, we demonstrated that the magnetic parameters are smaller than in bulk, but in agreement with previous papers, most probably due to the polycrystalline nature of the layers and the presence of Cu impurities within the Co layers. We then demonstrated that small variation of the
anisotropy direction and amplitude lead to radically different remnant states, highlighting the importance of the structural properties upon the magnetic states. However, our study demonstrates that under proper control of the structural properties, spin torque nano-oscillators with two distinct resonance frequencies is achievable. Indeed the resonance frequency of the system could be tuned well below or above the GHz range depending if we have vortices or AP state respectively 44,45
SUPPORTING INFORMATION
Diffraction pattern and EELS profiles obtained on Co/Cu multilayered
Figure S1: TEM diffraction pattern obtained on the Co layer of a Co/Cu multilayered nanowire.
Figure S2: (a) STEM dark field image of Co/Cu multilayered nanowire (layer of 100nm each) where is located the line profile used for the EELS quantification presented in (b).
Methods
Cleaning procedure for membrane removal Off-axis electron holography
Magnetic states
Micromagnetic simulation
Figure S3: (a) TEM image of the observed wire, (b) EFTEM image of the same area to distinguish the copper (blue) and cobalt (red) layers, (c) phase shift map obtained for the application of the saturation field along the wire axis, (d) phase shift map obtained on the same area than (c) for the application of a perpendicular saturation field with respect to the wire axis.
ACKNOWLEDGMENTS
This work was performed using HPC resources from CALMIP (Grant 2015-1428), the ANR EMMA 12-BS10-0013 and NASSICS 12-JS10-008 01 projects, and the French microscopy network METSA.
LEGEND
Figure 1. a) TEM image of a wire. b) EFTEM image of the wire recorded at the cobalt edge, c) EFTEM image of
the wire recorded at the copper edge. d) Cobalt (red) and copper (blue) map as the result of the superimposition of b) and c) maps.
Figure 2. a) TEM image of the observed wire. b) EFTEM image of the same area to distinguish the copper (blue)
and cobalt (red) layers. c) Magnetic phase shift map obtained after the application of the parallel saturation field with respect to the wire axis. d) Magnetic phase shift map obtained after the application of the saturation field perpendicularly to the wire axis.
Figure 3.a) Experimental magnetic phase shift map extracted from the holograms. b) Result of the simulated magnetic phase map. c) Comparison of the experimental and simulated profiles of the phase shift obtained on the dotted rectangle drawn on a). d) 3D magnetic configuration of the cobalt layers corresponding to the simulated phase image in b).
Figure 4. a) Experimental magnetic phase shift map extracted from the holograms. b) Result of the simulated
phase shift map. c) Comparison of the experimental and simulated profiles of the magnetic phase shift obtained along the white arrow on a). d) 3D magnetic configuration of the cobalt layers corresponding the simulated phase image in b).
Figure 5. a) EFTEM image of the studied wire. b) Experimental magnetic phase shift map with the
corresponding induction lines (in black). c) Comparison of the experimental and simulated profiles of the phase shift obtained for the rectangle drawn on figure 5b. d) Simulated magnetic phase shift map with the
corresponding induction lines (in black). e) 3D magnetic configuration of the cobalt layers corresponding to the simulated phase image in d).
REFERENCES
(1) Mourachkine, A.; Yazyev, O. V.; Ducati, C; Ansermet, J.-P. Template Nanowires for Spintronics Applications: Nanomagnet Microwave Resonators Functioning in Zero Applied Magnetic Field. Nano Lett. 2008, 8, 3683– 3687.
(2) Piccione, B.; Cho, C.-H.; van Vugt, L. K; Agarwal, R. All-optical active switching in individual semiconductor nanowires. Nature Nanotechnol. 2012, 7, 640–645.
(3) Silva, T. J; Rippard, W. H. Developments in nano-oscillators based upon spin-transfer point-contact devices. J. Magn. Magn. Mater. 2008, 320, 1260–1271.
(4) Parkin, S. S.; Hayashi, M.; Thomas, L. Magnetic domain-wall racetrack memory. Science 2008, 320, 190–194. (5) Chen, X.; Wong, C. K. Y.; Yuan, C. A.; Zhang, G. Nanowire-based gas sensors. Sens. Actuators B 2013, 177, 178–195.
(6) Demami, F.; Ni, L.; Rogel, R.; Salaun, A. C.; Pichon, L. Silicon nanowires based resistors as gas sensors. Sens. Actuators B 2012, 170, 158–162.
(7) Edström, K.; Brandell, D.; Gustafsson, T.; Nyholm, L. Electrodeposition as a tool for 3D microbattery fabrication. Electrochem. Soc. Interface 2011, 20, 41-46.
(8) Rippard, W. H.; et al. Injection Locking and Phase Control of Spin Transfer Nano-oscillators. Phys. Rev. Lett.
2005, 95, 067203.
(9) Kim, J.-V. Spin-Torque Oscillators. In Solid State Physics; Camley, R. E.; Stamps, R. L.; Elsevier 2012; 63, Chapter 4, pp 217–294.
(10) Stiles, M. D.; Miltat, J. Spin-transfer torque and dynamics. In Spin dynamics in confined magnetic structures III; Springer 2006; pp 225–308.
(11) Wong, J.; Greene, P.; Dumas, R. K.; Liu, K. Probing magnetic configurations in Co/Cu multilayered nanowires. Appl. Phys. Lett. 2009, 94, 032504.
(12) Ahmad, N.; Chen, J. Y.; Shi, D. W.; Iqbal, J.; Han, X. Magnetic anisotropy and magnetization reversal in Co/Cu multilayers nanowires. J. Appl. Phys. 2012, 111, 07C119.
(13) Zhang, J.; et al. Nanoscale characterisation and magnetic properties of Co81Cu19 /Cu multilayer nanowires.
J. Mater. Chem. C 2015, 3, 85–93.
(14) Da Col, S.; et al. Observation of Bloch-point domain walls in cylindrical magnetic nanowires. Phys. Rev. B
2014, 89, 180405.
(15) García, J.; et al. Template-assisted Co-Ni alloys and multisegmented nanowires with tuned magnetic anisotropy: Co-Ni alloys and multisegmented NWs with tuned magnetic anisotropy. Phys. Status Solidi A 2014, 211, 1041–1047.
(16) Gan, W. L. ; et al., Multi-Vortex States in Magnetic Nanoparticles. Appl. Phys. Lett. 2014, 105, 152405 (17) Vila, L. ; et al., Magnetic Vortices in Nanowires with Transverse Easy Axis, Phys. Rev. B 2009, 79, 172410 (18) Bryan, M. T. et al., Transverse and Vortex Domain Wall Structure in Magnetic Nanowires with Uniaxial in-Plane Anisotropy, Journal of Physics. Condensed Matter 2012, 24, 024205
(19). McCartney, M. R.; Smith, D. J. Electron holography: phase imaging with nanometer resolution. Annu. Rev. Mater. Res. 2007, 37, 729–767.
(20) Snoeck, E.; et al. Magnetic Configurations of 30 nm Iron Nanocubes Studied by Electron Holography. Nano Lett. 2008, 8, 4293.
(21) Gatel, C.; et al.. Size-Specific Spin Configurations in Single Iron Nanomagnet: From Flower to Exotic Vortices. Nano Lett. 2015, 15, 6952.
(22) Tanigaki, T. et al., Three-Dimensional Observation of Magnetic Vortex Cores in Stacked Ferromagnetic Discs, Nano Letters 2015, 15, 1309
(23) Biziere, N.; et al. Imaging the fine structure of a magnetic domain wall in a Ni nanocylinder. Nano Lett.
2013, 13, 2053–2057.
(24) Cantu-Valle, J.; et al. Mapping the magnetic and crystal structure in cobalt nanowires. J. Appl. Phys. 2015, 118, 024302.
(25) Dunin-Borkowski, R. E.; et al. Off-axis electron holography of magnetic nanowires and chains, rings, and planar arrays of magnetic nanoparticles. Microsc. Res. Tech. 2004, 64, 390–402.
(26) Beeli, C.; Doudin, B.; Ansermet, J.-P.; Stadelmann, P. Study of Co, Ni and Co/Cu nanowires: Magnetic flux imaging by off-axis electron holography. J. Magn. Magn. Mater. 1996, 164, 77–90.
(27) Akhtari-Zavareh, A.; et al. Off-axis electron holography of ferromagnetic multilayer nanowires. J. Appl. Phys. 2014, 116, 023902.
(28) Cantu-Valle, J.; et al. Quantitative magnetometry analysis and structural characterization of multisegmented cobalt–nickel nanowires. J. Magn. Magn. Mater. 2015, 379, 294–299.
(29) Kartopu, G.; Yalçın, O. Fabrication and Applications of Metal Nanowire Arrays Electrodeposited in Ordered Porous Templates. In Electrodeposited nanowires and their applications; InTech 2010; Chapter 5, pp 113-140. (30) Schlörb, H.; et al. Magnetic nanowires by electrodeposition within templates. Phys. Status Solidi B 2010, 247, 2364–2379.
(31) Kawamura, G.; Muto, H.; Matsuda, A. Hard template synthesis of metal nanowires. Front. Chem. 2014, 2, 1-4.
(32) Wade, T. L.; Wegrowe, J.-E. Template synthesis of nanomaterials. Eur. Phys. J. Appl. Phys. 2005, 29, 3–22. (33) Verbeeck, J.; Van Dyck, D.; Van Tendeloo, G. Energy-filtered transmission electron microscopy: an overview. Spectrochim. Acta, Part B 2004, 59, 1529–1534.
(34) Darques, M.; et al. Controlled growth of CoCu nanowires and application to multilayered CoCu/Cu nanowires with selected anisotropy. J. Phys. Appl. Phys. 2006, 39, 5025–5032.
(35) Almasi Kashi, M.; Ramazani, A.; Najafabadi, F. A.; Heydari, Z. Controlled Cu content of electrodeposited CoCu nanowires through pulse features and investigations of microstructures and magnetic properties. Appl. Surf. Sci. 2011, 257, 9347–9350.
(36) Maurice, J.-L.; et al. Microstructure of magnetic metallic superlattices grown by electrodeposition in membrane nanopores. J. Magn. Magn. Mater. 1998, 184, 1–18.
(37) Scarani, V.; Doudin, B.; Ansermet, J.-P. The microstructure of electrodeposited cobalt-based nanowires and its effect on their magnetic and transport properties. J. Magn. Magn. Mater. 1999, 205, 241–248.
(38) Donahue, M. J.; Porter, D. G. OOMMF User’s Guide; http://math.nist.gov/oommf.
(39) Henry, Y.; et al. Magnetic anisotropy and domain patterns in electrodeposited cobalt nanowires. Eur. Phys. J. B 2001, 20, 35–54.
(40) Rivera, M.; Rios-Reyes, C. H.; Mendoza-Huizar, L. H. Magnetic transition phase diagram of cobalt clusters electrodeposited on HOPG: Experimental and micromagnetic modelling study. J. Magn. Magn. Mater. 2011, 323, 997–1000.
(41) Dumas-Bouchiat, F.; et al. Cobalt cluster-assembled thin films deposited by low energy cluster beam deposition: Structural and magnetic investigations of deposited layers. J. Appl. Phys. 2006, 100, 064304. (42) Grujicic, D.; Pesic, B. Micromagnetic studies of cobalt microbars fabricated by nanoimprint lithography and electrodeposition. J. Magn. Magn. Mater. 2005, 285, 303–313.
(43) Chung S.-H.; et al., Phase Diagram of Magnetic Nanodisks Measured by Scanning Electron Microscopy with Polarization Analysis. Physical Review B, 2010, 81, 024410
(44) Pigeau B. ; et al., Optimal Control of Vortex-Core Polarity by Resonant Microwave Pulses. Nature Physics,
2011, 7, 26–31
(45) Biziere N. ; et al., Microwave Spin-Torque Excitation in a Template-Synthesized Nanomagnet. Phys. Rev. B,