HAL Id: hal-03017418
https://hal.archives-ouvertes.fr/hal-03017418
Submitted on 20 Nov 2020HAL is a multi-disciplinary open access archive for the deposit and dissemination of sci-entific research documents, whether they are pub-lished or not. The documents may come from teaching and research institutions in France or abroad, or from public or private research centers.
L’archive ouverte pluridisciplinaire HAL, est destinée au dépôt et à la diffusion de documents scientifiques de niveau recherche, publiés ou non, émanant des établissements d’enseignement et de recherche français ou étrangers, des laboratoires publics ou privés.
Sharing wintering grounds does not synchronize annual
survival in a high Arctic seabird, the little auk
S Descamps, B Merkel, H Strøm, R Choquet, H Steen, Jérôme Fort, M
Gavrilo, D Grémillet, D Jakubas, K Jerstad, et al.
To cite this version:
S Descamps, B Merkel, H Strøm, R Choquet, H Steen, et al.. Sharing wintering grounds does not synchronize annual survival in a high Arctic seabird, the little auk. Marine Ecology Progress Series, Inter Research, 2020, SEA, �10.3354/meps13400�. �hal-03017418�
1
Sharing wintering grounds does not synchronize annual survival in a high
1Arctic seabird, the little auk
23
Sébastien Descamps*, 1, Benjamin Merkel1, Hallvard Strøm1, Rémi Choquet2, Harald Steen1, Jérome 4
Fort3, Maria Gavrilo4, David Grémillet2, Dariusz Jakubas5, Kurt Jerstad6, Nina J. Karnovsky7, Yuri 5
V. Krasnov4, Børge Moe8, Jorg Welcker9and Katarzyna Wojczulanis-Jakubas5 6
7
1 Norwegian Polar Institute, Fram Centre, 9296 Tromsø, Norway
8
2 Centre d’Ecologie Fonctionnelle et Evolutive, UMR 5175, CNRS - Université de Montpellier -
9
Université Paul-Valéry Montpellier - EPHE, 34293 Montpellier, France 10
3 Littoral, Environnement et Sociétés (LIENSs), UMR 7266 CNRS – La Rochelle Université, 17000
11
La Rochelle, France 12
4 Association Maritime Heritage, Saint Petersburg, Russia
13
5 University of Gdańsk, Faculty of Biology, Department of Vertebrate Ecology and Zoology, 80-308
14
Gdańsk, Poland 15
6 Aurebekksveien 61, 4515 Mandal, Norway
16
7 Pomona College, Department of Biology, Claremont, California, 91711 USA
17
8 Norwegian Institute for Nature Research, 7034 Trondheim, Norway
18
9 BioConsult SH, 25813 Husum, Germany
19
Running page head: Little auk winter distribution and survival 20 21 * Corresponding author 22 Sébastien Descamps 23 [email protected] 24 25
2
ABSTRACT
26
Sharing the same wintering grounds by avian populations breeding in various areas may 27
synchronize fluctuations in vital rates, which could increase the risk of extinction. Here, by 28
combining multi-colony tracking with long-term capture-recapture data, we studied the winter 29
distribution and annual survival of the most numerous Arctic seabird, the little auk Alle alle. We 30
assessed whether or not little auks from different breeding populations in Svalbard and Franz Josef 31
Land use the same wintering grounds and if this leads to synchronized survival. Our results indicate 32
that birds from the Svalbard colonies shared similar wintering grounds, though differences existed 33
in the proportion of birds from each colony using the different areas. Little auks from Franz Josef 34
Land generally spent the winter in a separate area but some individuals wintered in the Iceland Sea 35
with Svalbard populations. Survival data from three Svalbard colonies collected in 2005-2018 36
indicated that sharing wintering grounds did not synchronize little auk annual survival rates. 37
However, it is clear that the Iceland Sea is an important wintering area for little auks and 38
environmental changes in this area could have widespread impacts on many populations. 39
40
Key-words: migration, synchrony, Alle alle, non-breeding distribution, geolocator, capture-mark-41
recapture 42
3 1. INTRODUCTION
43
Knowledge about the migratory connectivity, i.e. the link between breeding and non-breeding areas, 44
(Taylor & Norris, 2010), is required to understand the degree of dependency among populations on 45
a specific environment or geographic area, and their sensitivity to environmental changes occurring 46
in this area. Sharing the same environment during winter may synchronize fluctuations of distant 47
populations through a so-called Moran effect. This effect corresponds to the synchronization in the 48
dynamics of populations by density-independent factors (like climate) that are correlated across 49
wide regions (Moran 1953, Bjørnstad et al. 1999). and which may increase the risk of extinction 50
(Heino et al. 1997, Palmqvist & Lundberg 1998, Engen et al. 2005). Moreover, knowledge of 51
migratory connectivity, and more specifically inter-population mixing in the wintering grounds, will 52
help to define appropriate conservation or management units (Webster et al. 2002, Runge et al. 53
2015). Protecting a specific wintering area will have different effects in the case of low or high 54
inter-population mixing, i.e. if it is used by individuals from only one or from several breeding 55
populations (Finch et al. 2017). 56
To assess such migratory connectivity and its potential importance for population or species 57
dynamics, it is necessary to (i) assess the winter distribution of several populations of the same 58
species, and (ii) determine whether or not sharing this wintering ground synchronizes the 59
populations’ trajectories. Many migratory species are long-lived and their population dynamics and 60
viability are particularly sensitive to changes in adult survival (Saether & Bakke 2000) and to 61
changes that occur during the non-breeding season (e.g., Gaston 2003, Descamps et al. 2013, 62
Reiertsen et al. 2014). It is therefore especially important to understand the potential relationships 63
between conditions in the wintering grounds and adult survival. Mapping the winter distribution of 64
migratory species has, until recently, been extremely challenging, especially for small species that 65
cannot be equipped with large telemetry devices (Ropert-Coudert & Wilson 2005). However, the 66
4 development of new technologies in the last three decades and the miniaturization of data loggers 67
and transmitters has led to a large increase in our understanding of migratory species movements 68
(Ropert-Coudert & Wilson 2005). To link these movements and migratory behaviours to population 69
dynamics, long-term monitoring data of population size and/or vital rates are needed. These data are 70
particularly valuable for Arctic species experiencing rapid and large scale environmental changes 71
(Intergovernmental Panel on Climate Change 2013, AMAP 2017, Descamps et al. 2017), and for 72
whom long-term data are challenging to collect. (Mallory et al. 2018). 73
Here, we studied the annual survival of the most numerous Arctic seabird, the little auk Alle 74
alle, in relation to its winter distribution. More specifically, using individual tracking data, we
75
mapped the winter distribution of little auks breeding in five Arctic colonies to assess whether or 76
not individuals from different breeding populations use the same wintering grounds. Using long-77
term (2005-2018) Capture-Mark-Resighting (CMR) data from three of these colonies, we tested the 78
hypothesis that sharing the same wintering ground leads to synchronized survival rates. 79
80
2. MATERIALS AND METHODS
81
2.1. Study sites and little auk life history
82
The little auk is a seabird with a single-egg clutch and strong mate and nest fidelity (Stempniewicz 83
2001). It adopts a life-history strategy typical of long-lived species with a population dynamic 84
highly sensitive to changes in adult survival. As with most seabirds, little auks have a delayed age 85
of first reproduction and do not start breeding before the age of three (unpubl. results). The little auk 86
is zooplanktivorous and during the summer, preferentially forages on high-lipid copepods 87
associated with Arctic waters. Calanus glacialis generally represents the main prey in Svalbard 88
(Węsławski et al. 1999, Harding et al. 2009, Kwasniewski et al. 2010, Jakubas et al. 2012, Hovinen 89
et al. 2014b) while both C. hyperboreus and C. glacialis are the main prey species in Franz Josef 90
5 Land (Wesławski et al. 1994, Gremillet et al. 2015). During the non-breeding season, the diet of the 91
little auk is less known but may be based on krill spp., Themisto spp. and capelin Mallotus villosus 92
at least in some parts of its wintering range (Rosing-Asvid et al. 2013a). 93
We collected tracking data (details below) from five colonies: Kongsfjorden (Svalbard, 94
78°00'N, 12°24'E), Isfjorden (Svalbard, 78°14'N, 15°19'E), Bjørnøya (Svalbard, 74°31'N, 19°01'E), 95
Hornsund (Svalbard, 77°00'N, 15°33'E) and Franz Josef Land (Russia, 80°20'N, 52°49'E ; Fig.1). 96
Kongsfjorden and Isfjorden are located in the middle of the west Spitsbergen coast, which is 97
influenced by the warm West Spitsbergen Current (WSC), while Bjørnøya is located in the Barents 98
Sea between the north Norwegian coast and Svalbard. Little auks from these three colonies thus 99
forage in an environment with low Arctic conditions. The Hornsund area is characterized by high 100
Arctic conditions and is typically surrounded by water masses colder than Isfjorden and 101
Kongsfjorden due to the influence of the coastal Sørkapp Current, carrying cold, less saline Arctic-102
type water from the northeast Barents Sea (Swerpel 1985, Jakubas et al. 2013). Franz Josef Land is 103
also characterized by high Arctic environmental conditions (Wesławski et al. 1994). 104
We collected CMR data in three Svalbard colonies: Kongsfjorden, Isfjorden, and Bjørnøya 105
from 2005 (Isfjorden and Bjørnøya) or 2006 (Kongsfjorden) to 2018. 106
107
2.2. Identification of the wintering grounds
108
We identified wintering grounds by deploying light-level geolocators on the little auks (Wilson et 109
al. 1992, Fort et al. 2013). Raw positions obtained by geolocation have a relative high average error, 110
which is usually ~200 km (Phillips et al. 2004, Lisovski et al. 2012). As such, they are appropriate 111
to answer research questions about large-scale movements and distribution (Lisovski et al., 2012, 112
2019). The geolocators were mounted on a plastic leg band on tarsus. During the period 2010 to 113
2017 we deployed more than 524 geolocators in the five study colonies, of which 242 geolocators 114
6 were retrieved between 2011 and 2018 (Table SM1). The available tracking data resulted in 248 115
annual tracks from 188 individuals (tracking data were not obtained in the same years for all 116
colonies; see details in Table SM1). We used several geolocator models (mk18l from British 117
Antarctic Survey, mk4093 from Biotrack, c65 from Migrate Technology, all from Cambridge, UK), 118
and different light thresholds were used in subsequent processing of the light data (1-16, in arbitrary 119
units or lux). After calibration, we assigned appropriate sun elevation angles (-2.5° - -4.5°) to the 120
different light thresholds and geolocator models. The tracking data for 2010/11 is part of the study 121
by Fort et al. (2013), and we applied the same calibration process as Fort et al. (2013) for the 122
geolocators retrieved in period 2010-2014. This method is based on plotting estimated latitudes 123
over time using a range of sun elevation angles and selecting the angle that minimized the variance 124
of latitudes around the equinox periods. Geolocators retrieved after 2014 were part of the 125
SEATRACK project (http://www.seapop.no/en/seatrack/) and were calibrated using a slightly 126
different approach (Strøm et al. 2019) that followed the same general principles as described above. 127
When using the approach by Fort et al. (2013) most geolocators were assigned with the same sun 128
elevation angle (representing the best average), while in the latter approach we allowed individual 129
angles for each geolocator/track. This inconsistency has only a limited potential effect on the 130
estimated latitudes and does not affect the conclusions of this study. 131
In order to reduce the influence of inaccurate positions, we used the double smoothing 132
procedure described by Hanssen et al. (2016). Latitudes obtained by geolocation are unreliable 133
around the equinoxes, when day length is constant at all latitudes. In this study, we used positions 134
from winter only, defined as December and January, which are not affected by equinox. 135
136
2.3. Statistical analyses
137
2.3.1. Little auk wintering areas
7 We performed kernel analysis to determine high-density aggregations of little auks during winter, 139
defined as December and January, when birds are assumed to occupy their main wintering range 140
(Fort et al. 2012). To estimate colony-specific little auk distributions during the winter, we 141
calculated individual kernel utilization distributions (UD) for tracked birds on a 25x25 km grid in 142
an azimuthal equidistant projection centered on 66°N and 4°W. We used the package AdehabitatHR 143
(Calenge 2006) from R version 4.0.0 software (R Development Core Team 2016) and a constant 144
smoothing parameter of 50 km. For individuals with more than one year of tracking data, a random 145
year was selected for further analyses to avoid pseudo-replication. We extracted the 75% kernel 146
contour for each individual, rasterized them (with a value of 1) on the same 25x25 km grid and 147
combined all of these individual raster layers to establish colony-specific winter aggregations. To 148
estimate overall little auk wintering areas across colonies, we summed up all colony-specific raster 149
layers. As sample size differed between colonies (table SM1), we rescaled all rasterized winter 150
distributions to 1 before combining them. Finally, we defined the area of highest-density 151
aggregation of little auks from all investigated colonies as the area encompassed by the 90% 152
quantile. We calculated the proportional use of this area by each colony as the number of individual 153
75% kernel contours of tracked birds overlapping with this area compared to the total number of 154
tracked individuals, while taking into account the fraction of individuals without positional data due 155
to a lack of twilight events during polar night. We quantified inter-colony overlap in winter 156
distribution using Bhattacharyya’s affinity (Fieberg & Kochanny 2005), which we estimated 157
between colony-specific kernel UDs of all tracked individuals (same parameters as above). 158
159
2.3.2. Little auk survival modeling
160
We captured, marked and re-sighted little auks in specific study plots in three colonies 161
(Kongsfjorden, Isfjorden and Bjørnøya), with slightly different methods. We ringed birds with both 162
8 steel and plastic color bands, which allowed identification at a distance. We only included in this 163
study those birds captured for the first time as adults (of unknown age). In all three colonies, we 164
carried out fieldwork from approximately mid-June (incubation) to late July (chick-rearing). In 165
Kongsfjorden and Isfjorden, we captured birds using nylon loops deployed on top of random rocks 166
within the study plots, while at Bjørnøya, we captured birds by various methods, including nets at 167
nest entrance and remote snare traps. In total, 781, 592 and 972 adult little auks were ringed in 168
Kongsfjorden, Isfjorden and Bjørnøya, respectively, in the period 2005-2018 (average of 71 new 169
rings/year, range [6, 336] in Kongsfjorden, of 46 new rings/year, range [8, 108] in Isfjorden, and of 170
75 new rings/year, range [28, 132] on Bjørnøya). We used the software E-Surge (Choquet et al. 171
2009) to model CMR data to estimate survival rates (Lebreton et al. 1992a), with data from the 172
three colonies combined and defined as three different groups. The method cannot separate 173
permanent emigration from mortality and only estimates apparent survival. However, little auks 174
show a very high colony and nest fidelity (Stempniewicz 2001) and the assumption that apparent 175
survival reflects true survival is robust. We considered both males and females together to estimate 176
little auk adult survival as preliminary analyses indicated no sex-difference in survival. Details 177
about the CMR modelling, model selection procedure and goodness-of-fit tests are given in 178
supplementary material Text SM1. 179
To assess the synchrony among colonies in little auk survival rate fluctuations, we used two 180
different approaches. First, we compared additive and interactive time-dependent models. 181
Synchronous variation in survival should lead to survival varying in parallel through time among 182
colonies, so that a model with an additive time effect (model ɸ(g+t) where ɸ represents the survival, 183
g the group or colony and t the time) should be preferred over a model where each colony shows 184
different interannual variation (model ɸ(g.t)). Second, we considered the survival rates of each 185
colony (of the non-transient group, see details in Text SM1) estimated from time-dependent models 186
9 ɸ(g.t) and calculated the mean cross-correlation (which quantifies the synchrony) and associated 187
bootstrap confidence intervals using the mSynch function in the ncf package (Bjørnstad et al. 1999, 188
Bjørnstad 2009) in R software (R Development Core Team 2016). 189
190
3. RESULTS
191
3.1. Little auk wintering distribution
192
During the winter months (December-January), little auks from Svalbard and Franz Josef Land 193
dispersed to the area between eastern Canada and the Barents Sea (Fig. 1). Birds from Kongsfjorden 194
and Isfjorden were mostly distributed in eastern Canada (Labrador Sea), south Greenland and in the 195
Iceland Sea (Fig1). Kongsfjorden birds, however, migrated to the mouth of Hudson Strait and fewer 196
Kongsfjorden birds than Isfjorden ones went to southeast Greenland (Fig. 1). Birds from Hornsund 197
and Bjørnøya were mostly present in the Iceland Sea and around the southern tip of Greenland (Fig. 198
1). Birds from Franz Josef Land stayed mainly in the Barents Sea and in the Iceland Sea (Fig. 1). 199
Despite some differences among colonies in their winter distribution, the area in the Iceland Sea 200
was used by birds from all study sites in December and January (Fig. 2a). Approximately half of the 201
tracked birds from Hornsund and Bjørnøya and 20-30% of those from Kongsfjorden and Isfjorden 202
spent the winter in this area (Fig. 2b). The proportion of Franz Josef Land birds wintering in the 203
Iceland Sea was lower (approximately 10%, Fig. 2b). Most of the Franz Josef Land population 204
wintered in the Barents Sea and/or at high latitudes above the Arctic circle. Indeed, the majority of 205
the light data from Franz Josef land little auks did not include any twilight events (Fig. 2c) which 206
implies that the birds were staying at high latitudes where night was permanent. The proportion of 207
birds using the Iceland Sea throughout the winter followed a similar trajectory for all colonies. The 208
number of birds there increased until late November, was the highest in December/January and then 209
decreased from late January onwards, when birds most likely started their spring migration (Fig. 2b 210
and Fig. SM2). 211
10 When considering the entire winter distribution for each colony (as colony-specific kernel UD 212
in December/January), we found that the overlap was high among all Svalbard colonies (i.e. 213
Bhattacharyya’s affinity > 0.6) and not a function of the distance between these colonies (Table 1). 214
This overlap was smaller between Franz Josef Land and Svalbard colonies (Bhattacharyya’s affinity 215
<0.6; Table 1). Given that the majority of tracked individuals from Franz Josef Land spent the 216
winter where there is continuous polar night and thus where birds’ positions cannot be estimated 217
(Fig. SM1), the overlap between Svalbard colonies and Franz Josef Land is likely overestimated. 218
219
3.2. Synchrony in survival fluctuations
220
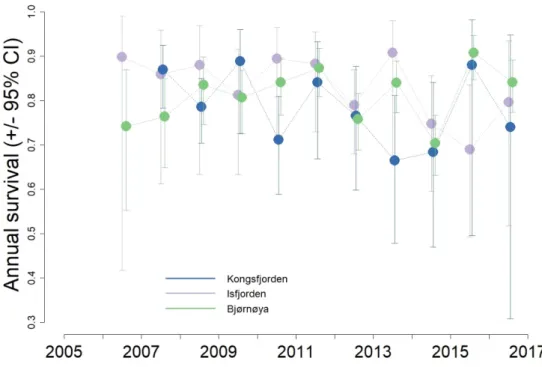
The average survival of little auks was different among colonies (model ϕ"#$was preferred over 221
model ϕ$; Table 2), being slightly higher in Isfjorden. (Isfjorden: 0.80, 95% CI: [0.77, 0.83]; 222
Kongsfjorden: 0.85, 95% CI: [0.82, 0.88] and 0Bjørnøya: 0.81, 95% CI: [0.79, 0.83]). Little auk 223
survival showed significant inter-annual fluctuations (Fig. 1; Table SM2) and a model constraining 224
survival to vary in parallel among colonies was preferred (i.e. lower AIC for the additive model 225
ϕ"#$ than for model ϕ".$; Table 2). However, this mostly reflects the rather large confidence 226
intervals around survival estimates, rather than the variation in their means (which are not parallel, 227
especially for Kongsfjorden). This result also seems mostly driven by Isfjorden and Bjørnøya, 228
which have more similar inter-annual variations as compared to Kongsfjorden (Fig. 2). This is 229
supported by the fact that a model constraining only Isfjorden and Bjørnøya survival to vary in 230
parallel (i.e. model ϕ"(').$#"(),+)#$) had a better fit than models constraining only Kongsfjorden and 231
Bjørnøya, or Kongsfjorden and Isfjorden to vary in parallel (Table 2). 232
The cross-correlation coefficient between the annual survival from these three colonies 233
(survival rates estimated from model ϕ".$) indicates that the overall synchrony was weak and non-234
significant (cross-correlation = 0.10, 95% CI: [-0.25, 0.30]). This coefficient is not taking the 235
11 uncertainty around the means (i.e. confidence intervals) into account and only reflects the lack of 236
synchrony in the variations of the mean annual survival rates (Fig.2). 237
238
4. DISCUSSION
239
By tracking little auks from five different colonies in the European Arctic, we found that birds 240
breeding in Svalbard had a similar winter distribution, though some differences exist (Fig. SM1). 241
Birds from Franz Josef Land differed more markedly and mostly stayed in the Barents Sea during 242
winter. The Barents Sea is rapidly changing and has become increasingly suitable habitat for 243
wintering little auks (Clairbaux et al. 2019). However the area used by Franz Josef Land little auks 244
has been mostly ice-free in winter, for at least the last 150 years (Shapiro et al. 2006). Therefore, 245
the current winter distribution of little auks in the Barents Sea may not represent contemporary 246
changes in the recent rapid loss of sea-ice (e.g. Parkinson et al. 1999, Li et al. 2017). Despite these 247
differences among colonies in their winter distribution, we identified a key wintering area in the 248
Iceland Sea, where some birds from all of Svalbard and Franz Josef Land colonies spent the winter 249
months. These results confirm that little auks from the European Arctic share, to varying degrees, 250
their wintering grounds. The proportion of tracked birds spending the winter north of Iceland varied 251
among colonies but was as high as 50-60% for birds breeding in Bjørnøya and Hornsund. Svalbard 252
and Franz Josef Land host more than 1.5 million breeding pairs of little auks (Keslinka et al. 2019), 253
indicating that a huge number of little auks likely spend the winter months in this area (though this 254
still represents a small proportion of the entire Atlantic population estimated at several 10s of 255
million pairs, del Hoyo et al. 1996). The importance of the Iceland Sea during winter for little auks 256
breeding in Svalbard and East Greenland had already been suggested (Fort et al. 2013). Our results 257
corroborate this finding by showing that even little auks from the Franz Josef Land population 258
utilize this area. The number of birds from Svalbard and Russia wintering there was highest in 259
12 December-January, and then gradually decreased from February onwards. Other Arctic seabirds 260
spend the winter in this region as well, such as Brünnich’s guillemots Uria lomvia from Bjørnøya 261
(Frederiksen et al. 2016) and other alcid species breeding in Iceland (Linnebjerg et al. 2018). The 262
Iceland Sea can therefore be considered as a hotspot for wintering Arctic seabirds, with hotspot 263
defined as “an area where high abundances of species overlap in space and time” (Davoren 2007). 264
This hotspot is located between Jan Mayen and Iceland over the Jan Mayen ridge and is 265
characterized by complex oceanic currents (Astthorsson et al. 2007, Mork et al. 2014). This ridge 266
separates the warm Atlantic waters in the Norwegian Sea from the cold Arctic ones in the Iceland 267
Sea. As with most oceanic front systems, it is associated with high marine productivity and 268
densities of zooplankton (e.g. Wiborg 1955, Trudnowska et al. 2012) and thus potentially high prey 269
availability for little auks. The winter diet of little auks is poorly known but krill (Euphausiacea) 270
may represent an important prey in parts of the wintering range (Fort et al. 2010, Rosing-Asvid et 271
al. 2013b). Recent studies have also suggested that the winter distribution of little auks is linked to 272
the distribution of the copepod Calanus finnmarchicus (Fort et al. 2012, Amélineau et al. 2018). 273
These species are among the most abundant zooplankton in the Iceland Sea, though the overall 274
plankton abundance declines in winter (Gislason & Silva 2012). However, despite such a seasonal 275
decline, zooplankton biomass in the core wintering areas of little auks, remains relatively high, at 276
least in some years (Fig. SM3). 277
Capture-recapture data were available from three of the five study colonies to determine the 278
level of synchrony in their survival rates. The average survival in the three colonies was similar 279
(approx. 0.80), though slightly higher in Isfjorden. This is also comparable with the survival of 280
Greenlandic little auks (Amélineau et al. 2019) and with other alcids of similar size and life-history 281
(i.e. single-egg layers)(e.g., average adult survival of 0.83 for the Marbled murrelet Brachyramphus 282
marmoratus, Cam et al. 2003, of 0.80 for the Kittlitz's murrelet Brachyramphus brevirostris,
13 Kissling et al. 2015). The survival of Svalbard little auks showed high inter-annual fluctuations, as 284
observed in previous studies both in Svalbard and Greenland (Hovinen et al. 2014a, Amélineau et 285
al. 2019). The magnitude of these fluctuations is surprising (and thus far unexplained) for a species 286
in which adult survival has the largest influence on the population growth rate (Stearns & Kawecki 287
1994). However, such large inter-annual fluctuations in survival seem to be common in alcids and 288
have been observed in Ancient Murrelets Synthliboramphus antiquus (Gaston & Descamps 2011), 289
least auklets Aethia pusilla (Jones et al. 2002), Brünnich’s guillemots Uria lomvia (Fluhr et al. 290
2017) and Atlantic puffins Fratercula arctica (Sandvik et al. 2005). 291
Two of the Svalbard little auk colonies (Kongsfjorden and Isfjorden) had a very similar 292
winter distribution. The third Svalbard colony (Bjørnøya) differed slightly with the majority of 293
birds staying north of Iceland or around the southern tip of Greenland and with very few birds 294
wintering along the Labrador coast. The synchrony in survival rates did not reflect these patterns in 295
wintering areas. Indeed, Bjørnøya and Isfjorden had more similar survival fluctuations throughout 296
the study period while survival fluctuations from Kongsfjorden differed markedly. Even if a model 297
with parallel survival for the three colonies was preferred, this was likely driven by the large 298
confidence intervals around the mean survival rates and overall, the synchrony in these mean 299
survival rates was very low. This shows that sharing part of the same wintering grounds was 300
insufficient to synchronize little auks' average annual survival rates. Several non-exclusive 301
explanations can be proposed. First, the survival of little auks may have been more affected by what 302
happened outside of the winter period (see for example Schaub et al. 2005 where survival of white 303
storks was mostly determined by conditions at one staging area used in the autumn). For instance, 304
little auks may be particularly vulnerable to environmental constraints during their flightless post-305
breeding moulting period, for which contrasting distributions between Svalbard colonies were 306
suggested (Fort et al. 2013). It has also been shown, though based on a very short time-series, that 307
14 an increase in the summer sea surface temperature resulted in a decrease in survival rates of adult 308
little auks at some Svalbard colonies, probably through impaired nutritional status during the 309
breeding season (Hovinen et al. 2014a). A study performed in one Greenland colony during a 310
breeding season with relatively poor foraging conditions (reflected in elevated levels of 311
corticosterone) found that little auk parents ended the reproductive season with low body mass and 312
suffered increased post-breeding mortality (Harding et al. 2011). These results stress the importance 313
of conditions experienced during the summer (i.e. breeding) period in driving little auk survival. 314
Assessing the overlap in little auk distribution outside the winter period (i.e. during the breeding 315
season, molting period and migration) would be needed but presents important challenges. In 316
particular, constant darkness and/or daylight for part of the year at high latitudes combined with the 317
difficulty of estimating bird positions around the equinoxes prevent the use of light data to map 318
little auk distribution during a large part of their annual cycle. Using different tracking devices 319
and/or supplementing the light data with other sources of information (see details in Merkel et al. 320
2016 for example) would be necessary. Second, even if little auks shared the same space on a large 321
scale during winter, birds from different breeding grounds may segregate at a finer scale (temporal 322
or spatial) and use different environments and potentially food sources. To test this hypothesis, fine-323
scale tracking data, potentially combined with diet information from wintering little auks, would be 324
necessary. 325
Conclusion
326
Our study identified a common wintering ground used by little auks from both Svalbard and Franz 327
Josef Land (Russian Arctic). This result has important management and conservation implications. 328
Even though sharing part of the wintering grounds did not lead to synchronized annual survival 329
during our study, what happens at these wintering grounds, and in particular in this common area 330
north of Iceland, may still have an effect on their population dynamics. Indeed, by using the same 331
15 wintering grounds, populations of little auks are likely to experience similar environmental
332
conditions during this season and are thus, to some extent, subject to the same environmental 333
drivers of population change. Any change in this region, like an increase in shipping or drilling 334
activities, modifications to resource availability or climate conditions, could thus have a widespread 335
effect on little auks breeding throughout the European Arctic. 336
16
Acknowledgements
338
This research was funded by the programs SEATRACK (http://www.seapop.no/en/seatrack/), 339
SEAPOP (http://www.seapop.no/en/) and MOSJ (http://www.mosj.no/en/). We thank all the field 340
workers that helped in collecting the data and in particular Delphin Ruché, Saga Svavarsdóttir, 341
Iñigo López Sarasa, Antonio Vilches, Charlotte Lassen, Bart Peeters, Ireen Vieweg, Coline 342
Marciau, and Benjamin Metzger for Kongsfjorden and Isfjorden fieldwork and Madeleine Stigner 343
for Hornsund fieldwork. 344
345
Literature cited
346
AMAP (2017) Snow, Water, Ice and Permafrost in the Arctic (SWIPA). In, Oslo, Norway 347
Amélineau F, Fort J, Mathewson P, Speirs D, Courbin N, Perret S, Porter W, Wilson R, Grémillet 348
D (2018) Energyscapes and prey fields shape a North Atlantic seabird wintering hotspot 349
under climate change. Royal Society open science 5:171883 350
Amélineau F, Grémillet D, Harding AM, Walkusz W, Choquet R, Fort J (2019) Arctic climate 351
change and pollution impact little auk foraging and fitness across a decade. Scientific 352
reports 9:1014 353
Astthorsson OS, Gislason A, Jonsson S (2007) Climate variability and the Icelandic marine 354
ecosystem. Deep Sea Research Part II: Topical Studies in Oceanography 54:2456-2477 355
Bjørnstad ON (2009) ncf: spatial nonparametric covariance functions. R package version 1.1-3. 356
http://CRAN.R-project.org/package=ncf. 357
Bjørnstad ON, Ims RA, Lambin X (1999) Spatial population dynamics: analyzing patterns and 358
processes of population synchrony. Trends Ecol Evol 14:427-432 359
Calenge C (2006) The package “adehabitat” for the R software: a tool for the analysis of space and 360
habitat use by animals. Ecol Modell 197:516-519 361
Cam E, Lougheed L, Bradley R, Cooke F (2003) Demographic assessment of a marbled murrelet 362
population from capture-recapture data. Conservation Biology 17:1118-1126 363
Choquet R, Rouan L, Pradel R (2009) Program E-SURGE: a software application for fitting 364
Multievent models. In: Thomson DL, Cooch EG, Conroy MJ (eds) Environmental and 365
Ecological Statistics, Book 3 366
Clairbaux M, Fort J, Mathewson P, Porter W, Strøm H, Grémillet D (2019) Climate change could 367
overturn bird migration: Transarctic flights and high-latitude residency in a sea ice free 368
Arctic. Scientific Reports 9:1-13 369
Davoren GK (2007) Effects of gill-net fishing on marine birds in a biological hotspot in the 370
Northwest Atlantic. Conservation Biology 21:1032-1045 371
del Hoyo J, Elliott A, Sargatal J (1996) Handbook of the Birds of the World, vol. 3: Hoatzin to 372
Auks. , Vol. Lynx Edicions, Barcelona, Spain 373
Descamps S, Aars J, Fuglei E, Kovacs KM, Lydersen C, Pavlova O, Pedersen AO, Ravolainen V, 374
17 Strøm H (2017) Climate change impacts on wildlife in a High Arctic archipelago - Svalbard, 375
Norway. Glob Change Biol 23:490-502 376
Descamps S, Strøm H, Steen H (2013) Decline of an arctic top predator: synchrony in colony size 377
fluctuations, risk of extinction and the subpolar gyre. Oecologia 173:1271-1282 378
Engen S, Lande R, Saether BE, Bregnballe T (2005) Estimating the pattern of synchrony in 379
fluctuating populations. J Anim Ecol 74:601-611 380
Fieberg J, Kochanny CO (2005) Quantifying home-range overlap: the importance of the utilization 381
distribution. The Journal of Wildlife Management 69:1346-1359 382
Finch T, Butler SJ, Franco AM, Cresswell W (2017) Low migratory connectivity is common in 383
long-distance migrant birds. J Anim Ecol 86:662-673 384
Fluhr J, Strøm H, Pradel R, Duriez O, Beaugrand G, Descamps S (2017) Weakening of the subpolar 385
gyre as a key driver of North Atlantic seabird demography: a case study with Brünnich’s 386
guillemots in Svalbard. Mar Ecol Prog Ser 563:1-11 387
Fort J, Beaugrand G, Grémillet D, Phillips RA (2012) Biologging, remotely-sensed oceanography 388
and the continuous plankton recorder reveal the environmental determinants of a seabird 389
wintering hotspot. PloS one 7:e41194 390
Fort J, Cherel Y, Harding AM, Egevang C, Steen H, Kuntz G, Porter WP, Grémillet D (2010) The 391
feeding ecology of little auks raises questions about winter zooplankton stocks in North 392
Atlantic surface waters. Biol Lett 6:682-684 393
Fort J, Moe B, Strom H, Gremillet D, Welcker J, Schultner J, Jerstad K, Johansen KL, Phillips RA, 394
Mosbech A (2013) Multicolony tracking reveals potential threats to little auks wintering in 395
the North Atlantic from marine pollution and shrinking sea ice cover. Divers Distrib 396
19:1322-1332 397
Frederiksen M, Descamps S, Erikstad KE, Gaston AJ, Gilchrist HG, Grémillet D, Johansen KL, 398
Kolbeinsson Y, Linnebjerg JF, Mallory ML (2016) Migration and wintering of a declining 399
seabird, the thick-billed murre Uria lomvia, on an ocean basin scale: Conservation 400
implications. Biol Conserv 200:26-35 401
Gaston A, Descamps S (2011) Population change in a marine bird colony is driven by changes in 402
recruitment. Avian Conservation and Ecology 6 403
Gaston AJ (2003) Synchronous fluctuations of thick-billed murre (Uria lomvia) colonies in the 404
eastern Canadian arctic suggest population regulation in winter. The Auk 120:362-370 405
Gislason A, Silva T (2012) Abundance, composition, and development of zooplankton in the 406
Subarctic Iceland Sea in 2006, 2007, and 2008. ICES J Mar Sci 69:1263-1276 407
Gremillet D, Fort J, Amelineau F, Zakharova E, Le Bot T, Sala E, Gavrilo M (2015) Arctic 408
warming: nonlinear impacts of sea-ice and glacier melt on seabird foraging. Glob Change 409
Biol 21:1116-1123 410
Hanssen SA, Gabrielsen GW, Bustnes JO, Bråthen VS, Skottene E, Fenstad AA, Strøm H, Bakken 411
V, Phillips RA, Moe B (2016) Migration strategies of common eiders from Svalbard: 412
implications for bilateral conservation management. Polar Biol 39:2179-2188 413
Harding AMA, Egevang C, Walkusz W, Merkel F, Blanc S, Grémillet D (2009) Estimating prey 414
capture rates of a planktivorous seabird, the little auk (Alle alle), using diet, diving 415
behaviour, and energy consumption. Polar Biol 32:785-796 416
Heino M, Kaitala V, Ranta E, Lindstrom J (1997) Synchronous dynamics and rates of extinction in 417
spatially structured populations. Proc R Soc Lond B 264:481-486 418
Hovinen JEH, Welcker J, Descamps S, Strøm H, Jerstad K, Berge J, Steen H (2014a) Climate 419
warming decreases the survival of the little auk (Alle alle), a high Arctic avian predator. 420
Ecol and Evol 4:3127-3138 421
Hovinen JEH, Wojczulanis-Jakubas K, Jakubas D, Hop H, Berge J, Kidawa D, Karnovsky NJ, 422
18 Steen H (2014b) Fledging success of little auks in the high Arctic: do provisioning rates and 423
the quality of foraging grounds matter? Polar Biol 37:665-674 424
Intergovernmental Panel on Climate Change (2013) Climate Change 2013: The Physical Science 425
Basis. Working Group II Contribution to the IPCC 5th Assessment Report, Vol. 426
http://www.ipcc.ch/report/ar5/wg2/
427
Jakubas D, Iliszko L, Wojczulanis-Jakubas K, Stempniewicz L (2012) Foraging by little auks in the 428
distant marginal sea ice zone during the chick-rearing period. Polar Biol 35:73-81 429
Jakubas D, Trudnowska E, Wojczulanis-Jakubas K, Iliszko L, Kidawa D, Darecki M, Błachowiak-430
Samołyk K, Stempniewicz L (2013) Foraging closer to the colony leads to faster growth in 431
little auks. Mar Ecol Prog Ser 489:263-278 432
Jones IL, Hunter FM, Robertson GJ (2002) Annual adult survival of Least Auklets (Aves, Alcidae) 433
varies with large-scale climatic conditions of the North Pacific Ocean. Oecologia 133:38-44 434
Keslinka LK, Wojczulanis-Jakubas K, Jakubas D, Neubauer G (2019) Determinants of the little auk 435
(Alle alle) breeding colony location and size in W and NW coast of Spitsbergen. PloS One 436
14:e0212668 437
Kissling ML, Lukacs PM, Gende SM, Lewis SB (2015) Multi-state mark–recapture model to 438
estimate survival of a dispersed-nesting seabird, the Kittlitz's Murrelet. The Journal of 439
Wildlife Management 79:20-30 440
Konyukhov N (2002) Possible ways of spreading and evolution of Alcids. Biology Bulletin of the 441
Russian Academy of Sciences 29:447-454 442
Kwasniewski S, Gluchowska M, Jakubas D, Wojczulanis-Jakubas K, Walkusz W, Karnovsky N, 443
Blachowiak-Samolyk K, Cisek M, Stempniewicz L (2010) The impact of different 444
hydrographic conditions and zooplankton communities on provisioning Little Auks along 445
the West coast of Spitsbergen. Prog Oceanogr 87:72-82 446
Lebreton J-D, Burnham KP, Clobert J, Anderson DR (1992a) Modeling survival and testing 447
biological hypotheses using marked animals: a unified approach with case studies. Ecol 448
Monogr 62:67-118 449
Lebreton JD, Burnham KP, Clobert J, Anderson DR (1992b) Modeling survival and testing 450
biological hypotheses using marked animals: a unified approach with case studies. Ecol 451
Monogr 62:67-118 452
Li D, Zhang R, Knutson TR (2017) On the discrepancy between observed and CMIP5 multi-model 453
simulated Barents Sea winter sea ice decline. Nature Communications 8:1-7 454
Linnebjerg JF, Frederiksen M, Kolbeinsson Y, Snaethórsson AÖ, Thórisson B, Thórarinsson TL 455
(2018) Non-breeding areas of three sympatric auk species breeding in three Icelandic 456
colonies. Polar Biol 41:1951-1961 457
Lisovski S, Hewson CM, Klaassen RH, Korner-Nievergelt F, Kristensen MW, Hahn S (2012) 458
Geolocation by light: accuracy and precision affected by environmental factors. Meth Ecol 459
Evol 3:603-612 460
Mallory ML, Gilchrist HG, Janssen M, Major HL, Merkel F, Provencher JF, Strøm H (2018) 461
Financial costs of conducting science in the Arctic: examples from seabird research. Arctic 462
Science 4:624-633 463
Merkel B, Phillips RA, Descamps S, Yoccoz NG, Moe B, Strøm H (2016) A probabilistic algorithm 464
to process geolocation data. Movement Ecology 4:26 465
Moran PAP (1953) The statistical analysis of the Canadian lynx cycle. II. Synchronization and 466
meteorology. Aust J Zool 1:291-298 467
Mork KA, Drinkwater KF, Jónsson S, Valdimarsson H, Ostrowski M (2014) Water mass exchanges 468
between the Norwegian and Iceland seas over the Jan Mayen Ridge using in-situ current 469
measurements. Journal of Marine Systems 139:227-240 470
19 Palmqvist E, Lundberg P (1998) Population extinctions in correlated environments. Oikos 83:359-471
367 472
Parkinson CL, Cavalieri DJ, Gloersen P, Zwally HJ, Comiso JC (1999) Arctic sea ice extents, areas, 473
and trends, 1978–1996. Journal of Geophysical Research: Oceans 104:20837-20856 474
Pereira SL, Baker AJ (2008) DNA evidence for a Paleocene origin of the Alcidae (Aves: 475
Charadriiformes) in the Pacific and multiple dispersals across northern oceans. Molecular 476
phylogenetics and evolution 46:430-445 477
Phillips RA, Silk JRD, Croxall JP, Afanasyev V, Briggs DR (2004) Accuracy of geolocation 478
estimates for flying seabirds. Mar Ecol Prog Ser 266:265-272 479
R Development Core Team (2016) R: a language and environment for statistical computing. In. R 480
Foundation for Statistical Computing, Vienna, Austria. http://www.R-project.org/. 481
Reiertsen TK, Erikstad KE, Anker-Nilssen T, Barrett RT, Boulinier T, Frederiksen M, Gonzalez-482
Solis J, Gremillet D, Johns D, Moe B, Ponchon A, Skern-Mauritzen M, Sandvik H, Yoccoz 483
NG (2014) Prey density in non-breeding areas affects adult survival of black-legged 484
kittiwakes Rissa tridactyla. Mar Ecol Prog Ser 509:289-+ 485
Ropert-Coudert Y, Wilson RP (2005) Trends and perspectives in animal-attached remote sensing. 486
Frontiers in Ecology and Evolution 3:437-444 487
Rosing-Asvid A, Hedeholm R, Arendt K, Fort J, Robertson G (2013a) Winter diet of the little auk 488
(Alle alle) in the Northwest Atlantic. Polar Biology 36:1601-1608 489
Rosing-Asvid A, Hedeholm R, Arendt K, Fort J, Robertson G (2013b) Winter diet of the little auk 490
(Alle alle) in the Northwest Atlantic. Polar Biol 36:1601-1608 491
Runge CA, Watson JE, Butchart SH, Hanson JO, Possingham HP, Fuller RA (2015) Protected areas 492
and global conservation of migratory birds. Science 350:1255-1258 493
Saether BE, Bakke O (2000) Avian life history variation and contribution of demographic traits to 494
the population growth rate. Ecology 81:642-653 495
Sandvik H, Erikstad KE, Barrett RT, Yoccoz NG (2005) The effect of climate on adult survival in 496
five species of North Atlantic seabirds. J Anim Ecol 74:817-831 497
Schaub M, Kania W, Köppen U (2005) Variation of primary production during winter induces 498
synchrony in survival rates in migratory white storks Ciconia ciconia. J Anim Ecol 74:656-499
666 500
Shapiro I, Colony R, Vinje T (2006) April sea ice extent in the Barents Sea, 1850–2001. Polar Res 501
22:5-10 502
Stearns SC, Kawecki TJ (1994) Fitness sensitivity and the canalization of life-history traits. 503
Evolution 48:1438-1450 504
Stempniewicz L (2001) Alle alle little auk. In: BWP Update The Journal of the Birds of the Western 505
Palearctic Book 3. Oxford University Press., Oxford 506
Strøm H, Helgason HH, Bråthen VS, Descamps S, Ekker M, Fauchald P, Merkel B, Moe B, 507
Tarroux A (2019) Large-scale tracking of seabirds in the Northeast-Atlantic 2014-2018 - 508
Final report from SEATRACK phase I. . In: Norsk Polarinstitutt (ed) Rapportserie 509
(Forthcoming) 510
Swerpel S (1985) The Hornsund fjord: water masses. Polish Polar research 475:96 511
Trudnowska E, Szczucka J, Hoppe L, Boehnke R, Hop H, Blachowiak-Samolyk K (2012) 512
Multidimensional zooplankton observations on the northern West Spitsbergen Shelf. Journal 513
of Marine Systems 98:18-25 514
Webster MS, Marra PP, Haig SM, Bensch S, Holmes RT (2002) Links between worlds: unraveling 515
migratory connectivity. Trends Ecol Evol 17:76-83 516
Wesławski J, Stempniewicz L, Galaktionov K (1994) The food and feeding of little auk from Franz 517
Josef Land. Polar Res 13:173-181 518
20 Węsławski J, Stempniewicz L, Mehlum F, Kwaśniewski S (1999) Summer feeding strategy of the 519
little auk (Alle alle) from Bjørnøya, Barents Sea. Polar Biol 21:129-134 520
Wiborg KF (1955) Zooplankton in relation to hydrography in the Norwegian Sea. In: Report on 521
Norwegian Fishery and Marine Investigations, Book XI 522
Wilson RP, Ducamp J, Rees WG, Culik BM, Niekamp K (1992) Estimation of location: global 523
coverage using light intensity. In: Priede IM, Swift SM (eds) Wildlife telemetry: remote 524
monitoring and tracking of animals. Ellis Horward, Chichester 525
526 527
21
528
Table 1. Overlap in the winter distribution of Svalbard and Franz Josef Land little auks. The distribution for 529
each colony is based on the months of December and January and was assessed as kernel UD. The overlap 530
was calculated using the Bhattacharyya’s affinity index (from 0 = no overlap to 1 = identical distribution; 531
see Methods for details). Distances between colonies (in km) are indicated in the lower part of the table 532
(gray area). 533
534
Colony Franz Josef
Land
Kongsfjorden Isfjorden Hornsund Bjørnøya
Franz Josef Land - 0.32 0.35 0.51 0.48
Kongsfjorden 795 - 0.72 0.66 0.65 Isfjorden 769 103 - 0.80 0.73 Hornsund 851 227 140 - 0.90 Bjørnøya 993 523 430 296 - 535 536
22 Table 2. Synchrony in the survival of little auks breeding at Isfjorden, Kongsfjorden and Bjørnøya. Subscript 537
“g” represents the colony (i.e. g(1) represents Kongsfjorden, g(2) Isfjorden and g(3) Bjørnøya) and “t” the 538
time dependence. The QAIC values have been calculated using an overdispersion parameter -. = 0. 12.
539
ΔQAIC corresponds to the difference between the QAIC of a given model and the lowest QAIC among the 540
different models considered. Np represents the number of identifiable parameters and Dev the deviance. The 541
survival ɸ represents the survival of the non-transient birds (age-class 2). Survival of age class 1 has been 542
modeled as time-dependent with a multiplicative colony/group effect (see Table SM1). Recapture rates have 543
been modelled as colony- and time-dependent with an additive trap-dependence (see table SM1 and 544
methods). 545
546
Model Np Dev QAIC ΔQAIC
34.5 110 13231.72 7411.15 17.73 67#8 92 13265.336 7393.42 0.00 35 90 13281.75 7398.34 4.92 34 81 13335.76 7409.70 16.28 39 79 13347.02 7411.82 18.40 34(').5#[4(),+)#5] 101 13243.11 7399.34 5.92 34()).5#[4(',+)#5] 102 13252.83 7406.63 13.21 34(+).5#[4(',))#5] 101 13247.98 7403.99 10.57 547
23 548
24 550
25 551
Figure 2. Winter distribution of little auks breeding in Svalbard (Kongsfjorden, blue circle; Isfjorden, purple circle; Hornsund, orange circle; Bjørnøya, green circle)
552
and Franz Josef Land (yellow circle). Distribution is based on 188 little auks tracked throughout the year with light loggers (details in Methods). Panel (a) represents the 553
winter distribution of little auks in Dec-Jan. The colour represents the overall area usage (details in Methods). Grey area denotes persistent seasonal sea ice cover (as 554
75% sea ice concentration across the study period). The dashed line represents the limit of the marginal sea ice zone (as 15% sea ice concentration across the study 555
period). Sea-ice data are from NOAA/OAR/ESRL PSL (https://psl.noaa.gov/). Panel (b) shows the proportion of individuals from each colony present in the area of 556
highest usage north of Iceland during winter (area delineated with a black line in panel (a)); grey areas in the graph represent equinox periods. Panel (c) shows the 557
proportion of individuals from each colony that experienced conditions without twilight events (i.e., polar night and midnight sun) throughout the year. Dotted lines in (b) 558
and (c) indicate the winter period used for analyses (Dec-Jan; area delineated with a black line in panel (a)). 559
26 560
561
Figure 3. Annual survival (±95% confidence intervals) of little auks breeding in Svalbard. Only the non-562
transient groups have been considered (see details in Methods) and each survival estimate represents the 563
survival between two consecutive breeding seasons. Survival in the last year (2017-2018) cannot be 564
estimated separately from the recapture rate (Lebreton et al. 1992b). 565