HAL Id: hal-02316829
https://hal.archives-ouvertes.fr/hal-02316829
Submitted on 25 Nov 2020
HAL is a multi-disciplinary open access
archive for the deposit and dissemination of sci-entific research documents, whether they are pub-lished or not. The documents may come from teaching and research institutions in France or abroad, or from public or private research centers.
L’archive ouverte pluridisciplinaire HAL, est destinée au dépôt et à la diffusion de documents scientifiques de niveau recherche, publiés ou non, émanant des établissements d’enseignement et de recherche français ou étrangers, des laboratoires publics ou privés.
Several Stories about Biological Evolution
Sabrina Renaud, Anne-Béatrice Dufour, Emilie Hardouin, Ronan Ledevin,
Jean-Christophe Auffray
To cite this version:
Sabrina Renaud, Anne-Béatrice Dufour, Emilie Hardouin, Ronan Ledevin, Jean-Christophe Auffray. Once upon Multivariate Analyses: When They Tell Several Stories about Biological Evolution. PLoS ONE, Public Library of Science, 2015, 10 (7), pp.e0132801. �10.1371/journal.pone.0132801�. �hal-02316829�
Once upon Multivariate Analyses: When They
Tell Several Stories about Biological Evolution
Sabrina Renaud1*, Anne-Béatrice Dufour1, Emilie A. Hardouin2,3, Ronan Ledevin1, Jean-Christophe Auffray4
1 Laboratoire de Biométrie et Biologie Evolutive, UMR5558, CNRS, University Lyon 1, 69622 Villeurbanne, France, 2 Max Planck Institute of Evolutionary Biology, August-Thienemann-Str. 2, Plön, Germany, 3 Faculty of Science and Technology, Bournemouth University, Christchurch House, Talbot Campus, Poole, Dorset, United Kingdom, 4 Institut des Sciences de l’Evolution de Montpellier, UMR 5554, CNRS, University Montpellier 2, Montpellier, France
Abstract
Geometric morphometrics aims to characterize of the geometry of complex traits. It is there-fore by essence multivariate. The most popular methods to investigate patterns of differenti-ation in this context are (1) the Principal Component Analysis (PCA), which is an eigenvalue decomposition of the total variance-covariance matrix among all specimens; (2) the Canoni-cal Variate Analysis (CVA, a.k.a. linear discriminant analysis (LDA) for more than two groups), which aims at separating the groups by maximizing the between-group to within-group variance ratio; (3) the between-within-group PCA (bgPCA) which investigates patterns of between-group variation, without standardizing by the within-group variance. Standardizing within-group variance, as performed in the CVA, distorts the relationships among groups, an effect that is particularly strong if the variance is similarly oriented in a comparable way in all groups. Such shared direction of main morphological variance may occur and have a bio-logical meaning, for instance corresponding to the most frequent standing genetic variation in a population. Here we undertake a case study of the evolution of house mouse molar shape across various islands, based on the real dataset and simulations. We investigated how patterns of main variance influence the depiction of among-group differentiation according to the interpretation of the PCA, bgPCA and CVA. Without arguing about a method performing‘better’ than another, it rather emerges that working on the total or between-group variance (PCA and bgPCA) will tend to put the focus on the role of direction of main variance as line of least resistance to evolution. Standardizing by the within-group variance (CVA), by dampening the expression of this line of least resistance, has the poten-tial to reveal other relevant patterns of differentiation that may otherwise be blurred.
Introduction
In the last few decades, geometric morphometrics [1,2] has been established as a powerful tool to characterize shape variation of complex morphological structures, in contexts as diverse as
OPEN ACCESS
Citation: Renaud S, Dufour A-B, Hardouin EA, Ledevin R, Auffray J-C (2015) Once upon Multivariate Analyses: When They Tell Several Stories about Biological Evolution. PLoS ONE 10(7): e0132801. doi:10.1371/journal.pone.0132801
Editor: Alistair Robert Evans, Monash University, AUSTRALIA
Received: April 16, 2014 Accepted: June 19, 2015 Published: July 20, 2015
Copyright: © 2015 Renaud et al. This is an open access article distributed under the terms of the
Creative Commons Attribution License, which permits unrestricted use, distribution, and reproduction in any medium, provided the original author and source are credited.
Data Availability Statement: All relevant data are within the paper and its Supporting Information files. Funding: BIGTOOTH, grant ANR-11-BSV7-008 to SR, JCA and RL from the Agence Nationale de la Recherche ECODEV, grant ANR-13-BSV7-005 to SR, ABD and RL from the Agence Nationale de la Recherche.
Competing Interests: The authors have declared that no competing interests exist.
phylogenetic diversification [3,4], developmental biology [5,6] and response to environment [7]. As geometric morphometrics aims to characterize the geometry of complex traits, it is inherently multivariate. The most commonly-used multivariate analysis in geometric morpho-metrics is probably the Principal Component Analysis (PCA) [8]. It is an eigenvalue decompo-sition of the total variance-covariance matrix among all specimens. It is especially used when looking at patterns of morphological variance (e.g. [9–11]). The Canonical Variate Analysis (CVA) has emerged as a popular and powerful way to investigate patterns of differentiation among groups (e.g. [12–14]). It corresponds to a linear discriminant analysis (LDA) for more than two groups [15,16]. CVA aims at separating the groups by looking for linear combina-tions of variables that maximize the between-group to within-group variance ratio [17]. Recently, the between-group PCA (bgPCA) [18]has emerged as a potential alternative to CVA to investigate patterns of among group differentiation, without standardizing for the within-group variance [19,20].
Building a biological interpretation of morphometric variation profoundly relies on the image that multivariate analyses provide of the pattern of differentiation. Standardizing within-group variance, as performed in the CVA, distorts the relationships among groups [21,
22]. This effect will be particularly strong if the variance is similarly oriented (anisotropic) in all groups, because in this case standardizing by within-group variance will correspond to dampen differences among groups along this particular direction. A preferred direction of vari-ance parallel among groups is not only a theoretical issue: Biological mechanisms can lead to such patterns. The direction of main morphological variance is related to the most frequent standing genetic variation in a population [23,24]. By providing frequent variants to the screening of selection, these directions of main variance have been proposed to constitute lines of least resistance to evolution [9,25].
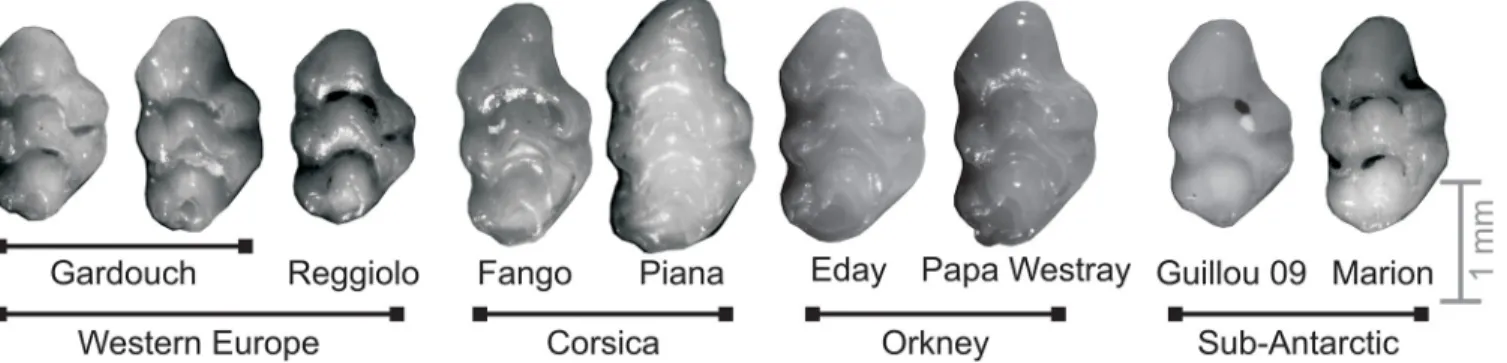
In this context, one can wonder how much a multivariate method will be sensitive to such biologically-relevant patterns of main variance, and how much this will influence the depiction of among-group differentiation offered to interpretation. We address here these issues using a case study: the evolution of house mouse molar shape across various islands. The mouse molar (Fig 1) has been shown to display directions of main variance shared among populations [26] that seems to constitute preferential directions of among-group differentiation [27]. In this case study, we (1) compared the pattern of among-group differentiation provided by three pop-ular multivariate analyses in geometric morphometrics: PCA, bgPCA and CVA; (2) tested on real and simulated data sets how far these patterns were influenced by directions of main
Fig 1. Mouse teeth exemplifying the morphological variation within and between populations. From left to right: Western European mainland populations (Gardouch, South France; Reggiolo, Northern Italy); insular populations: Corsica (Fango, Corsica mainland; Piana islet); Orkney (Eday and Papa Westray islands); sub-antarctic islands (Guillou, island part of the Kerguelen archipelago and Marion, part of Prince Edward islands). Anterior part to the top, lingual side to the right.
variance shared among groups; and (3) questioned the biological relevance of interpretations based on the among-group patterns provided by the various methods. Without arguing about one method performing‘better’ than another, it rather emerges that working on the total or between-group variance (PCA and bgPCA) will tend to put the focus on the role of direction of main variance as line of least resistance to evolution. Standardizing by the within-group vari-ance (CVA), by dampening the expression of this line of least resistvari-ance, has the potential to evidence other relevant patterns of differentiation that may otherwise be blurred.
Case study: molar shape divergence of house mice on islands
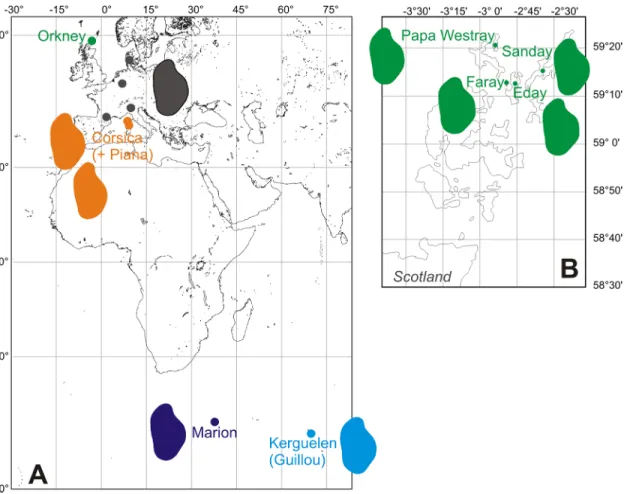
The house mouse (Mus musculus domesticus) is a highly successful colonizer because it accom-panied human travels since archaeological times [28,29]. This has led to a complex phylogeo-graphic pattern across worldwide populations of mice (e.g. [30–32]). This genetic structure is mirrored by differences in molar shape among continental stocks [33,34]. The house mouse also successfully colonized many islands [29]. Insular conditions are known to promote fast and pronounced morphological differentiation because of peculiar ecological conditions trig-gering adaptations, as well as due to random processes such as founder effect and subsequent drift in small and isolated populations [35,36]. As in other rodents, house mice are sensitive to such factors and cases of marked morphological differentiation have been reported for several islands [29,37–39]. Our data set included continental and insular populations from various environmental contexts (Fig 2). Phylogenetic relationships were assessed based on data from
Fig 2. Location of the studied populations. A. General map, with dots showing sampling localities: Western European mainland areas (in grey) and archipelagos (Orkney, in green; Corsica, in orange; Marion, in dark blue; Kerguelen, light blue). B. Close-up on Orkney archipelago, with the four islands sampled. Colored shapes correspond to reconstruction of the mean outline per population or area is represented (for Guillou, year 2009).
the literature, and compared to the pattern of morphological differentiation, as provided by the different multivariate methods (PCA, bgPCA, and CVA) applied to the same morphometric dataset.
Material
A total of 432 first upper molars were considered in the analyses (Table 1;Fig 2). All mice were sub-adults and adults, the criteria being the eruption of the third molars that occurs at weaning. Sexual dimorphism has not been documented so far in molar shape of wild mouse populations [37,40]. All animals were therefore pooled in subsequent analyses.
Seven populations from Western Europe were used to represent the continental variation in house mice, including samples from France (Montpellier, Gardouch), Italy (Reggiolo, San Ber-nardino and farms from the surroundings [Lombardy]), Germany (Cologne and Bonn sur-roundings) and Denmark (Egtved).
Insular populations were used to examine various archipelagos and environmental contexts. Corsica is a large Mediterranean island. It was sampled by mice from Fango valley and from the islet of Piana, a few kilometers off Corsica [26]. The Orkney archipelago is located in North Atlantic, 16 km off the coast of Scotland. Mice from four islands were included in the present study (Sanday, Faray, Eday, Papa Westray). Finally, sub-antarctic conditions were documented by mice from Marion Island, at latitude ~46°S some 1770 km off South Africa, and by popula-tions from the small Guillou Island, in the Kerguelen archipelago. It is located in the Indian Ocean about 4000 km away from African and Australian coasts, at latitude ~50°S. Samples from Guillou were trapped in four years spanning over more than 15 years (1993, 2001, 2008 and 2009) [37].
Mice from Montpellier, Corsica, Marion, and Orkney come from the collection of the Insti-tut des Sciences de l’Evolution, Montpellier, France. Mice from Gardouch have been trapped by Jean-Pierre Quéré and are deposited at the Centre de Biologie et Gestion des Populations,
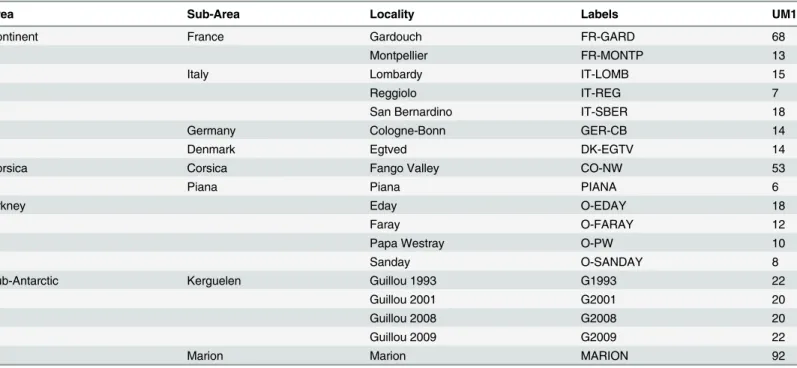
Table 1. Samples used in this study. Area and country/island are indicated, locality of trapping, labels used in the figures, and number of first upper molars (UM1) measured.
Area Sub-Area Locality Labels UM1
Continent France Gardouch FR-GARD 68
Montpellier FR-MONTP 13
Italy Lombardy IT-LOMB 15
Reggiolo IT-REG 7
San Bernardino IT-SBER 18
Germany Cologne-Bonn GER-CB 14
Denmark Egtved DK-EGTV 14
Corsica Corsica Fango Valley CO-NW 53
Piana Piana PIANA 6
Orkney Eday O-EDAY 18
Faray O-FARAY 12
Papa Westray O-PW 10
Sanday O-SANDAY 8
Sub-Antarctic Kerguelen Guillou 1993 G1993 22
Guillou 2001 G2001 20
Guillou 2008 G2008 20
Guillou 2009 G2009 22
Marion Marion MARION 92
France. Mice from Guillou have been trapped by the team of Jean-Louis Chapuis and Benoit Pisanu (Museum National d’Histoire Naturelle, Paris, France) and those from Cologne-Bonn by team of the Max Planck Institute for Evolutionary Biology, Plön, Germany. The correspond-ing skulls have been prepared and are presently stored at the Laboratoire de Biométrie et Biolo-gie Evolutive, Lyon, France. All mice were sacrificed after trapping according to the 2010/63/ UE directive. Authorizations: permit to Jean-Christophe Auffray C34-130 [préfecture de l’Hér-ault]; permit to Jean-Pierre Quéré 34–107 [préfecture de l’Hérault]; permit to Jean-Louis Cha-puis 68–013 [Comité Cuvier d’Ethique]; permit for mice from Cologne Bonn:
V312-72241.123–34 and approval by the ethics commission of the Ministerium für Landwirtschaft, Umwelt und ländliche Räume, Kiel (Germany) [41]. According to the French legislation, sacri-fice of wild animals for the purpose of taking samples, when performed according to autho-rized protocols, is not considered as an experiment (Journal Officiel de la République
Française, Décret n° 2013–118 du 1er février 2013, Section 6, Sous-section 1). As such, it is not submitted to the agreement of ethical committees.
Methods
Phylogenetic analyses
A total of 424 mitochondrial (mt) control region sequences of 834 bp were extracted from GenBank:
- France: 151 [30,42,43]; Jones et al unpubl.; - Germany: 71 [30,42,43]; Jones et al unpubl.; - Italy: 60 [31,44,45] and Jones et al unpubl.; - Denmark: 23 [45];
- Orkney: 21[32,44,45] - Corsica: 1 [46] - Marion Island: 18 [47] - and Guillou Island [47].
These sequences were extracted and aligned using BioEdit [48] and MEGA [49]. The HKY+I substitution model was selected using jmodeltest-2.1.4 [50]. Genetic distances were calculated using the software Mr Bayes [51] with the following conditions, 25% burn-in and 5 000 000 generations using Mus musculus musculus DQ266060.1 as an outgroup. Based on these distances, the final tree was visualized using FigTree 1.3.1 [52].
Outline analysis
The molar shape was approximated by the 2D outline of the tooth seen from the occlusal sur-face, the focus being made towards the base of the crown, which is only affected by heavy wear [53]. Each outline was defined by a set of 64 points, the starting point being tentatively posi-tioned at the anteriormost part of the tooth. This set of points was first analyzed using an Ellip-tic Fourier transform [54]. This method describes the outline as its x- and y-variations, as a function of the cumulative length along the outline, decomposed into a sum of trigonometric functions of decreasing wavelength (harmonics) by a Fourier approach. Each harmonic is weighted by four Fourier coefficients (FCs), two for x- and two for y-variations. This method allows the alignment of the outline along the first axis of the ellipse best fitting the outline, and
the adjustment of the starting point at the intersection of the outline with this first axis, corre-sponding to the major elongation of the object. A drawback is a high number of variables required to describe the outline (four FCs by harmonics). This method was used to reconstruct an outline with the starting point adjusted along the first axis of the major ellipse. This outline was then analyzed using a Fourier method decomposing the distance of each point to the center of gravity of the outline as a function of the distance along the outline. Each harmonic is weighted by two Fourier Coefficients (FCs) using this method, reducing the dataset required to describe the outline. The zero harmonic, proportional to the outline size, was used as size esti-mator and to standardize all other FCs so they represent shape variables only. The higher the rank of the subsequent harmonics, the more details they represent on the outline. The shape of a mouse molar is adequately described by the first seven harmonics, i.e. by 14 variables [26] (dataset:S1 Table).
Multivariate analyses of shape variation
A Principal Component Analysis (PCA) on the total variance-covariance (VCV) matrix T was performed on the set of the 14 FCs describing molar tooth outlines to study total shape varia-tion among specimens. This method is an eigenanalysis of T providing axes maximizing the variance among all specimens.
Variance between groups (here, localities) was first assessed using a between-group PCA (bgPCA). The total VCV matrix T is decomposed in two components: the between-group matrix B and the within group matrix W. B corresponds to the VCV between group means weighted by the sample size of each group. W is equal to T–B. The bgPCA corresponds to the eigenanalysis of B.
An alternative approach to study differences among groups is to use a canonical variate analysis (CVA), an extension of the linear discriminant (LDA) analysis to more than two groups [15,16]. This analysis provides axes maximizing the between-group to within-group variance ratio. It corresponds to an eigenanalysis of BW-1. Note that CVA presents computa-tional problems when number of variables is larger than number of cases. It may require a reduction of dimensionality of the data [21]. This is not an issue here because using Fourier methods allows for a thresholding of the number of variables before statistical analyses.
Multivariate analyses were performed under R [55] using the package ade4 [56].
Characterization of the direction of main variance in well-sampled
groups
The standardization by the intragroup variance W should impact CVA more if groups dis-played marked directions of main variance parallel in the different groups.
Such direction of main variance for a group i corresponds to the first eigenvector of a PCA on the total VCV matrix for the group i, i.e. Ti. This phenotypic VCV matrix is also called P (Pi
for group i). Its first eigenvector is called Pmax for direction of maximum phenotypic variance [23]. Its estimates requires a large sample size, i.e. ideally more than 30 specimens for the con-cerned group [27,57]. It was therefore assessed in the three well-sampled groups of Gardouch (mainland Western Europe), Corsica and Marion Island.
The concordance of the estimates of Pmax in these three groups was assessed by a boot-strapping procedure. Each group was bootstrapped 100 times, corresponding Pmaxbootsrap
were estimated and compared to Pmax estimated on the original samples. The distribution of the correlation R between Pmaxoriginaland the 100 Pmaxbootsrapprovided a‘confidence
between groupwas within the 95% distribution of Roriginal / bootstrap, it was considered that the
Pmax in two concerned groups could not be considered as different.
Comparison between patterns of differentiation provided by the different
multivariate methods
The representations of differentiation provided by the different multivariate methods applied to the same dataset (molar shape) were compared as follow. The scores of the group means on axes of a given analysis provide a configuration that can be compared to the configuration of group means as provided by another method. Such configurations can be compared using a Procrustes superimposition (Protest) [58]. This provides a measure of Procrustes distance between the two configurations (D) and a coefficient of correlation R. The probability that the configurations are more related than random is assessed using permutations.
As a way to assess how some multivariate methods applied to morphometric datasets may or may not favor an evolutionary hypothesis, the patterns of shape differences were compared to the genetic differentiation. In order to do so, the matrix of genetic distance was converted into a set of multivariate axes by using a Principal Coordinate Analysis (PCoA) [59]. Based on the genetic data available in the literature, groups as close as possible as the ones used for mor-phometric analyses were identified. Their means on the PCoA axes were computed, providing a configuration that was compared to the configurations provided using the morphometric analyses using a Protest. pcoa and protest are R functions from the package ‘vegan’ [60].
Impact of oriented within group variance on the output of multivariate
analyses: simulations
In order to assess the effect of an‘anisotropic’ within-group variance (i.e. oriented along a pref-erential direction shared among groups) on the output of PCA, bgPCA and CVA, simulations were performed. 999 datasets were built from the same seven populations and the same indi-viduals per population observed in the real dataset. For each simulated dataset, the seven popu-lations kept their observed means. However, the variance of each variable within each
population was modified to follow a same variance. This was done for each population sepa-rately by randomizing the simulated values from a multinormal distribution with the following parameters: the 14 observed means characteristic of the given population, and as variance the average of the 7 geometric means of the 14 variances per population. This was repeated inde-pendently for each of the 7 populations. PCA, bgPCA and CVA were performed on these simu-lated datasets. Three pairwise Protests were computed to compare the among-group
configuration obtained on four axes of each analysis (PCA vs. bgPCA, PCA vs. CVA, bgPCA vs. CVA). For each comparison, the 999 Protest distances from the simulated datasets gener-ated a simulgener-ated distribution function. The observed distances between analyses from the real dataset were compared to this simulated function. The script in R is provided as supplementary file (S1 Script).
Results
Phylogenetics: Independent colonization of the different archipelago
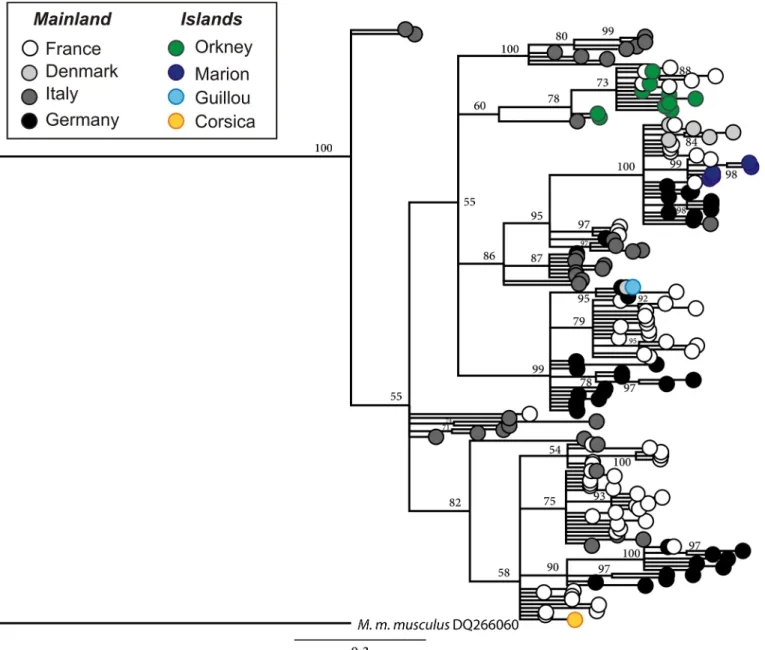
A total of 424 mt DNA control region sequences of 834 bp were obtained from GenBank. The populations from the four archipelagos are found on different branches of the phylogenetic tree, suggesting that Orkney, Guillou Island, Marion Island and Corsica were colonized by dif-ferent founder populations from Europe (Fig 3).
Patterns of molar shape differentiation
PCA. All continental localities from Western Europe cluster together. Insular groups scat-ter around this continental clusscat-ter (Fig 4A). The first axis (37.2% of the total variance) is char-acterized by the strong divergence of Piana, and to a lesser extent of Corsica, Papa Westray (Orkney) on one side, and from Faray and Eday (Orkney) on the other side. The second axis (24.7% of variance) mostly isolates samples from Guillou. No clear pattern emerges on axes 3 and 4 (PC3 = 10.5%, PC4 = 7.6%; data not shown).
bgPCA. The pattern of differentiation (Fig 4B) is close to the one observed based on a PCA on the total variance. The main pattern of differentiation, opposing Piana to Faray and
Fig 3. Phylogenetic tree for M. m. domesticus mt DNA control region. The tree includes mice from France, Denmark, Italy, Germany, Marion Island, Guillou Island, Corsica and Orkney (based on data available in GenBank). The tree was drawn after Bayesian analysis and shows the different origins of the island mouse populations.
Eday, is oblique to the first axis (42.3% of between-group variance) and second axis (35.1%). No clear pattern emerges on axes 3 and 4 (bgPC3 = 8.0%, bgPC4 = 6.9%; data not shown).
CVA. The main pattern of differentiation isolates the samples of Guillou from the cluster of mainland groups along the first axis (46.6% of among-group variance). Along the second axis (14.6%), various insular groups (Marion, Piana, Sanday and Papa Westray) tend to segre-gate from the mainland cluster. The third axis (12.7%) differentiates Faray, Eday and Papa Westray and to a lesser degree Sanday (all from Orkney archipelago). Piana strongly diverges along the fourth axis (9.0%).
Relationships between patterns of differentiation
Morphometric patterns of differentiation. The configuration between the 18 group means provided by the different analyses were compared using a Protest (999 permutations). In order to compare these configurations, the same numbers of axes have to be considered for all analyses, the only first four axes were retained (results based on the first two axes pro-vided similar results; data not shown). Since the PCA, bgPCA and CVA were based on the same morphometric data set, the resulting patterns were of course correlated. The PCA and bgPCA provided almost similar configurations (R2= 0.960; Procrustes Distance D = 0.078; P999 permutations= 0.001). The pattern of the CVA provided a pattern three times more distant
(CVA / PCA: R2= 0.866; Procrustes Distance D = 0.251; P999 permutations= 0.001; CVA/ bgPCA:
R2= 0.875; Procrustes Distance D = 0.234; P999 permutations= 0.001).
Relationship between genetic and morphometric pattern of differentiation. Most of the specimens used for the morphometric analysis come from skull collections, without direct match with a genetic sequence. To assess the match between the morphometric and the genetic patterns of differentiation, a compromise was reached between availability of genetic data in the literature, and a geographic match between the samples used in morphometrics. Two approaches have been used. (1) Averaging group means of continental localities per country for the morphometric data set, and deleting Piana for which no genetic data were available, leading to 14 group means. (2) Duplicate genetic data obtained per country to get data for each morphometric continental locality, and assess a Corsican genetic background for Piana, presumably a sink population highly related to the nearby Corsica (18 groups, as used for morphometrics).
Both procedures led to comparable results. The CVA provided a pattern of morphometric differentiation ~1.5 closer than the one provided by the PCoA on genetic data (Table 2).
Congruence between main directions of within-group variance among
well-sampled groups
The direction of main variance (Pmax) was assessed in the three well-sampled groups of Gar-douch (France) and the islands Marion and Corsica. 100 bootstrapped estimates were calcu-lated for each Pmax, providing a 95% confidence interval for the estimation of Pmax in each group. Pmax Gardouch (R95%= 0.817) appeared to be less robustly estimated than Pmax in the
two insular groups (R95%Corsica = 0.949; R95%Marion = 0.935).
The comparison between the original estimates of Pmax for these three groups showed that their correlation R fell within the 95% confidence interval of the less robustly estimated Pmax (Gardouch / Marion: R = 0.850; Gardouch / Corsica: R = 0.869; Corsica / Marion: R = 0.969). Hence, the hypothesis that Pmax are similar among groups cannot be rejected.
Fig 4. Differentiation in molar shape among populations, according to three different multivariate analyses. A. Principal Component Analysis (PCA); note that this analysis is performed on all specimens (grey dots). Group means are highlighted (large colored symbols). B. Between-group PCA. C and D. Canonical Variate Analysis (CVA), in C first vs. second axes, in D third vs. fourth axes.
Impact of similarly oriented within-group variance on PCA, bgPCA and
CVA: simulations
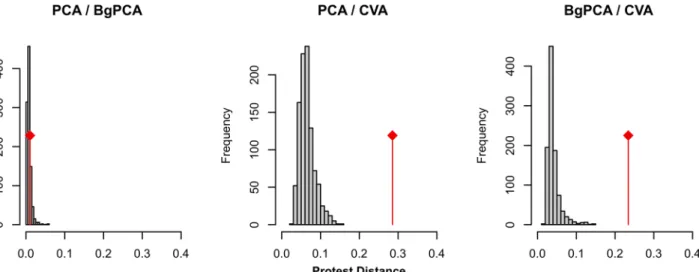
Since the CVA standardizes the within-group variance, it should be more impacted than the PCA and bgPCA by the occurrence of Pmax shared among groups. To validate this hypothesis, simulations were performed. The initial groups were bootstrapped, with the condition that the variance of all shape variables should follow a similar uniform distribution. The different groups should thus no longer share parallel Pmax. The resulting simulated configurations were compared using Protest (Fig 5). The simulated and the observed configurations provided by the PCA and the bgPCA were all very close. This shows that the PCA and bgPCA provided similar pictures of the morphometric differentiation, and that this picture was not impacted by Pmax. For the CVA cases, simulated datasets displayed configurations closer by 4 to 5 times compared to those provided by the PCA and the bgPCA than the original configuration. This is in agreement with the fact that the occurrence of a marked direction of main variance Pmax, parallel among groups, strongly impacts the pattern of differentiation as revealed by a CVA.
Table 2. Relationships between genetic and morphometric patterns of differentiation between groups. Patterns of genetic differentiation are based on coordinates of group means on the first four axes of a PCoA on the genetic distances. 14 groups: continental samples are averaged by country, Piana excluded; 18 groups: genetic data duplicated for continental samples of a same country; Piana included and considered as genetically identical to Corsica. Patterns of morphometric distances are based on the first four axes of a PCA, bgPCA and CVA on the same dataset (Fourier coefficients describing the molar shape outline). Coordinates of group means on the multivariate axes correspond to configurations compared using a Protest. It delivers a coefficient of determination (R2), a Procrustes distance between configurations (DProcrustes), and a probability P that the observed configurations are less correlated than
permuted configurations (999 permutations). In italics P< 0.05, in bold P < 0.001.
Morphometrics/genetics 14 groups 18 groups
R2 D Procrustes P R2 DProcrustes P PCA / PCoA 0.587 0.655 0.011 0.482 0.767 0.011 bgPCA / PCoA 0.591 0.651 0.009 0.451 0.797 0.042 CVA / PCoA 0.732 0.463 0.001 0.677 0.542 0.001 doi:10.1371/journal.pone.0132801.t002
Fig 5. Effect of homogeneizing variances on the pattern of differentiation provided by PCA, bgPCA and CVA. The initial groups were bootstrapped, with the condition that the variance of all shape variables should follow a similar uniform distribution. The 999 resulting data sets were analysed using PCA, bgPCA and CVA. The resulting configurations on the first four axes of each analysis were compared using a Protest, providing a Procrustes distance estimating how much the configurations differ. For each pairwise comparison between analyses (PCA vs. bgPCA, PCA vs. CVA, bgPCA vs. CVA), this provided a simulated distribution (histograms in grey) for data sets with homogeneous variances. The observed distances (red lines) between analyses based on the real data set, characterized by strongly anisotropic variances for each group, were compared to these simulated distributions.
The CVA assumes isotropic variation. In the case of anisotropic variance oriented along similar Pmax, this assumption is not fulfilled.
Discussion
The mathematical properties of common multivariate methods such as the Principal Compo-nent Analysis and the Canonical Variate Analysis (a.k.a Linear Discriminant Analysis) are well known [15,16]. These analyses are basic methods in the context of geometric morphometrics to visualize patterns of differentiation on which interpretative scenarios are based. The choice between methods is often rather based on the objective of expressing at best differences between the investigated groups (e.g. [6,12,13]).
Methodological considerations, such as the fact that the CVA standardizes the total variance by the within-group variance, are often not openly considered in this context. Yet, the CVA, by standardizing within-group variance, alters the pattern of differentiation among groups [21,
22]. This will especially occur when there is a pronounced direction of main variance Pmax parallel among groups. This does not only constitute a theoretical issue [21,22], but indeed, Pmax more emerges as a recurrent and biologically meaningful feature in phenotypic evolution [9,37,61,62]. The difference between patterns provided by PCA and CVA thus questions the (biologically meaningful) relationship between the pattern of variance in biological populations compared to differentiation between these populations.
Within-group variance: a mathematical description, a biological feature
Multivariate axes do not correspond to any biological reality. They are mathematical ways to describe variance. However, biological interpretations rely on this description. In the case of the variance within a group, there is even a semantic and conceptual overlap between the math-ematical description and the biological concept it describes. The genetic and the morphometric variances in a population are described by matrices (G and P, respectively), of which first eigenvector of each represents the direction of main variance [23,25]. The first axis of the G matrix has been proposed to be a‘line of least resistance to evolution’, because it represents the most abundant genetic variants to be screened by selection [25,63]. Although environmental factors also act on phenotypic development, P seems to be a fair estimate of G [24,64,65] The first axis of the two matrices (Gmax and Pmax) appear to be correlated as well [23]. Gmax and Pmax indeed emerged repeatedly as preferred axes of evolution [23,27,61–63].
This means that there are biological reasons why within-group variance may not be a ran-dom noise, but be oriented along certain directions and parallel across populations [23,62,64]. This represents cases where the results of PCA and CVA are expected to diverge most, and it is thus likely to occur in the description of variation of biological shapes.
Questioning the involvement of Pmax in evolutionary divergence may thus be relevant to understanding the differences between results of methods applied to a same dataset. Recipro-cally, contrasting the results of PCA and CVA may be enlightening to balance the role of differ-ent evolutionary processes.
Different methods, different evolutionary patterns, all biologically
relevant
Considering the present case study, the PCA and the CVA highlight different evolutionary pat-terns in the evolution of molar shape in insular populations of house mice (Fig 4; schematic representationFig 6). The PCA, be it on the total variance or on between-group variance, tended to promote a picture of evolution favored along lines of least resistance along the direc-tion of main variance existing within any populadirec-tion (Pmax). The important divergence within
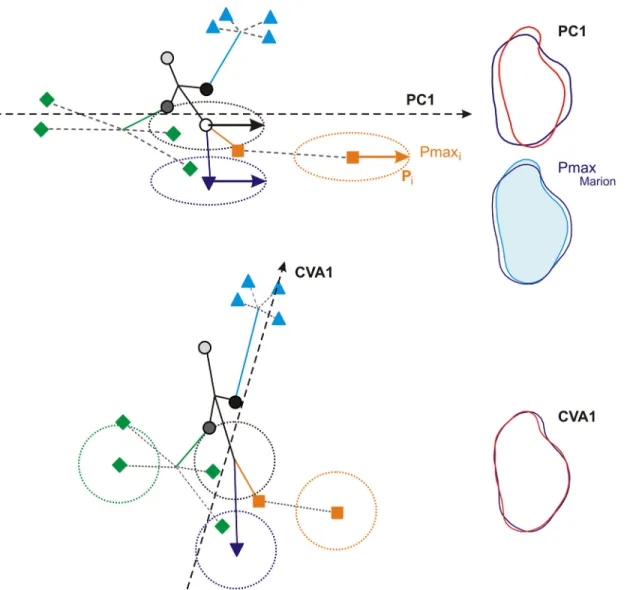
the Orkney archipelago particularly exemplifies this trend, as well as the divergence of molar shape on the small islet of Piana off Corsica. In contrast, the CVA provided a pattern of evolu-tion enhancing more basal phylogenetic divergence, such as shape features shared by all Ork-ney Islands. The shape changes involved (Fig 6) are a trend from slender to broad molars, when considering Pmax as divergence along the first axis of the PCA. This trend has repeatedly been shown to be a major direction of within-population variation and between-population divergence in recent and fossil murine rodents [26,27,62]. By standardizing by the within-group variance, the CVA puts to the front more subtle shape changes, such as a broader fore-part or a backward more prominent labial cusp (Fig 6).
How general are these results? At least regarding molar shape, they may reveal some general pattern. A study of molar shape divergence in European wood mice (Apodemus sylvaticus)
Fig 6. Diagrams showing how Pmax impacts the patterns of differentiation provided by a PCA and a CVA. Symbols represent group means, lines are phylogenetic relationships; full lines are‘ancient’ branches representing differentiations of clades, dotted lines represent recent diversification in an archipelago. Dotted ellipses represent the ellipse of variance of some groups; the vector inside Pmax. Dotted vector: first axis of the multivariate analysis. Above: the first axis of a PCA is aligned with Pmax; recent diversification events occurring along this line of least resistance are highlighted. Below: the standardization of the within-group variance in a CVA compresses the differentiation along Pmax up to make the variance per group circular; this dampens the representation of diversification along Pmax and promotes patterns of phylogenetic differentiation along other axes. To the right, reconstructed outlines (using an inverse Fourier transform) exemplifying the corresponding interpretation in the cases of molar shape. Pmax corresponds to a variance from thin to broad molars; so does the first axis of the PCA. The first axis of the CVA is oblique to this direction and corresponds to more localized, detailed features on the tooth.
recently evidenced that insular evolution was the most prominent feature when considering total shape variation on a PCA, and that it occurred along Pmax. In contrast, phylogenetic divergence was of smaller magnitude and was not parallel to Pmax [66].
Does that point to different evolutionary mechanisms for both aspects of morphological divergence? Insular divergence is known to occur fast and to drive marked morphological divergence [67,68]. Few founders have to face ecological conditions different from those pre-vailing in their source area. This presumably triggers a phase of intense selection. By providing variants available to the screening of selection, the main variance within a population consti-tutes a favored line of response in such a situation. Note that the morphological trend involved in Pmax may have the potential for a selective value, broader molars providing more surface to cope with abrasive matter, for instance [27]. In contrast, in most cases neutral evolution occurs at a slower pace than response to selection [69], and it should occur in any morphological direction, in an amount proportional to the frequency of the variants in the population, i.e. in any directions of variance within a population [70]. Phylogenetic divergence has no particular reason to constitute a response to selection, and may exemplify such neutral evolution, hard to detect because of slow accumulation, and in any direction, including away of Pmax. Because mice of the different clades may share similar environments while on the continent, stabilizing selection may even be involved and further dampen morphological divergence, making it diffi-cult to perceive.
How these hypotheses may be valid for other models of evolution, i.e. for other characters and animals, are challenges for further studies. In any case, a balanced and critical confronta-tion of the patterns provided by the different multivariate analyses may be fruitful, when including a reflection on the biological meaning beyond morphometric variance.
Supporting Information
S1 Table. Morphometric data used in this study.Loc: Locality of trapping. UM1A1 to UM1B7: Fourier coefficients A and B of the first seven harmonic of the first upper molar (UM1) outline.
(TXT)
S1 Script. Script of simulations testing the effect of homogeneizing variances on the pattern of differentiation provided by PCA, bgPCA and CVA.SeeresultsinFig 5. The procedure is the following: The initial groups is bootstrapped, with the condition that the variance of all shape variables should follow a similar uniform distribution. The resulting data set is analysed using PCA, bgPCA and CVA. The resulting configurations on the first four axes of each analy-sis were compared using a Protest, providing a Procrustes distance estimating how much the configurations differ.
(R)
Acknowledgments
Eleanor Jones is thanked for providing access to original mtDNA data from a currently submit-ted manuscript. Guila Ganem, Jean-Pierre Quéré, Jean-Louis Chapuis and Benoit Pisanu are deeply acknowledged for going to the field to sample wild mice, a role without which such study could not exist. We also thank the stimulating and constructive comments of the review-ers, Phillip Mitteroecker and an anonymous reviewer, as well as the very helpful contribution of the editor Alistair Evans for improving our final text. This is contribution ISEM 2015–082.
Author Contributions
Conceived and designed the experiments: SR ABD JCA EAH. Performed the experiments: SR ABD RL EAH. Analyzed the data: SR ABD EAH RL. Contributed reagents/materials/analysis tools: SR EAH JCA. Wrote the paper: SR ABD EAH RL JCA.
References
1. Mitteroecker P, Gunz P. Advances in Geometric Morphometrics. Evolutionary Biology. 2009; 36 (2):235–47.
2. Rohlf FJ, Marcus LF. A revolution in morphometrics. Trends in Ecology and Evolution. 1993; 8(4):129– 32. doi:10.1016/0169-5347(93)90024-JPMID:21236128
3. Drake AG, Klingenberg CP. Large-scale diversification of skull shape in domestic dogs: Disparity and modularity. 175. 2010;3: 289–301. doi:10.1086/650372PMID:20095825
4. Fadda C, Corti M. Three-dimensional geometric morphometrics of Arvicanthis: implications for system-atics and taxonomy. J Zool Syst Evol Res. 2001; 39:235–45.
5. Hallgrímsson B, Brown JJY, Ford-Hutchinson AF, Sheets HD, Zelditch ML, Jirik FR. The brachymorph mouse and the developmental-genetic basis for canalization and morphological integration. Evolution and Development. 2006; 8(1):61–73. PMID:16409383
6. Paradis MR, Raj MT, Boughner JC. Jaw growth in the absence of teeth: the developmental morphology of edentulous mandibles using the p63 mouse mutant. Evolution and Development. 2013; 15(4):268– 79. doi:10.1111/ede.12026PMID:23809701
7. Claude J, Pritchard P, Tong H, Paradis E, Auffray J-C. Ecological correlates and evolutionary diver-gence in the skull of turtles: A geometric morphometric assessment. Systematic Biology. 2004; 53 (6):933–48. PMID:15764561
8. Jolliffe IT. Principal Component Analysis: Springer New York; 2002. 478 p.
9. Boell L. Lines of least resistance and genetic architecture of house mouse (Mus musculus) mandible shape. Evolution and Development. 2013; 15(3):197–204. doi:10.1111/ede.12033PMID:23607303
10. Zelditch ML, Lundrigan BL, Garland TJ. Developmental regulation of skull morphology. I. Ontogenetic dynamics of variance. Evolution and Development. 2004; 6(3):194–206. PMID:15099307
11. Willmore KE, Leamy L, Hallgrímsson B. Effects of developmental and functional interactions on mouse cranial variability through late ontogeny. Evolution and Development. 2006; 8(6):550–67. PMID:
17073938
12. Gomes Rodrigues H, Renaud S, Charles C, Le Poul Y, Solé F, Aguilar J-P, et al. Roles of dental devel-opment and adaptation in rodent evolution. Nature Communications. 2013; 4:2504. doi:10.1038/ ncomms3504PMID:24051719
13. Helvaci Z, Renaud S, Ledevin R, Adriaens D, Michaux JR, Çolak R, et al. Morphometric and genetic structure of the edible dormouse (Glis glis): a consequence of forest fragmentation in Turkey. Biological Journal of the Linnean Society. 2012; 107:611–23.
14. Siahsarvie R, Auffray J-C, Darvish J, Rajabi-Maham H, Yu H-T, Agret S, et al. Patterns of morphological evolution in the mandible of the house mouse Mus musculus (Rodentia: Muridae). Biological Journal of the Linnean Society. 2012; 105:635–47.
15. Fisher RA. The use of multiple measurements in taxonomic problems. Annals of Eugenics 1936; 7:179–88.
16. Campbell NA, Atchley WR. The geometry of canonical variate analysis. Systematic Zoology 1981; 30:268–80.
17. Gardner S, Gower JC, Le Roux NJ. A synthesis of canonical variate analysis, generalised canonical correlation and procrustes analysis. Computational Statistics and Data Analysis 2006; 50:107–34. 18. Culhane AC, Perrière G, Considine EC, Cotter TG, Higgins DG. Between-group analysis of microarray
data. Bioinformatics. 2002; 18:1600–8. PMID:12490444
19. Firmat C, Schliewen UK, Losseau M, Alibert P. Body shape differentiation at global and local geo-graphic scales in the invasive cichlid Oreochromis mossambicus. Biological Journal of the Linnean Society. 2012; 105(2): 369–81.
20. Pina M, Almécija S, Alba DM, O'Neill MC, Moyà-Solà S. The Middle Miocene ape Pierolapithecus cata-launicusexhibits extant great ape-like morphometric affinities on its patella: Inferences on knee function and evolution. PLoS One. 2014; 9(3):e9194.
21. Mitteroecker P, Bookstein F. Linear discrimination, ordination, and the visualization of selection gradi-ents in modern morphometrics. Evolutionary Biology. 2011; 38(1):100–14
22. Klingenberg CP, Monteiro LR. Distances and directions in multidimensional shape spaces: Implications for morphometric applications. Systematic Biology. 2005; 54(4):678–88. PMID:16126663
23. Marroig G, Cheverud JM. Size as line of least evolutionary resistance: diet and adaptive morphological radiation in New World monkeys. Evolution. 2005; 59(5):1128–42. PMID:16136810
24. Cheverud JM. A comparison of genetic and phenotypic correlations. Evolution. 1988; 42(5):958–68. 25. Schluter D. Adaptive radiation along genetic lines of least resistance. Evolution. 1996; 50(5):1766–74. 26. Renaud S, Pantalacci S, Auffray J-C. Differential evolvability along lines of least resistance of upper
and lower molars in island mouse mice. PLoS One. 2011; 6(5):e18951. doi:10.1371/journal.pone. 0018951PMID:21589657
27. Renaud S, Auffray J-C. The direction of main phenotypic variance as a channel to morphological evolu-tion: case studies in murine rodents. Hystrix, The Italian Journal of Mammalogy. 2013; 24(1):85–93. doi:10.4404/hystrix-24.1–6296
28. Cucchi T, Vigne J-D. Origin and diffusion of the house mouse in the Mediterranean. Human Evolution. 2006; 21:95–106.
29. Berry RJ. Small mammal differentiation on islands. Philosophical Transactions of the Royal Society, London B. 1996; 351(1341):753–64.
30. Jones EP, Jóhannesdóttir F, Gündüz I, Richards MB, Searle JB. The expansion of the house mouse into north-western Europe. Journal of Zoology. 2011; 283:257–68.
31. Rajabi-Maham H, Orth A, Bonhomme F. Phylogeography and postglacial expansion of Mus musculus domesticusinferred from mitochondrial DNA coalescent, from Iran to Europe. Molecular Ecology. 2008; 17:627–64. doi:10.1111/j.1365-294X.2007.03601.xPMID:18179435
32. Searle JB, Jones CS, Gündüz I, Scascitelli M, Jones EP, Herman JS, et al. Of mice and (Viking?) men: phylogeography of British and Irish house mice. Proceedings of the Royal Society, London B. 2009; 276:201–7.
33. Cucchi T, Kovács ZE, Berthon R, Orth A, Bonhomme F, Evin A, et al. On the trail of Neolithic mice and men towards Transcaucasia: zooarchaeological clues from Nakhchivan (Azerbaijan). Biological Jour-nal of the Linnean Society. 2013; 108(4):917–28.
34. Cucchi T. Uluburun shipwreck stowaway house mouse: molar shape analysis and indirect clues about the vessel's last journey. Journal of Archaeological Science. 2008; 35:2953–9. doi:10.1016/j.jas.2008. 06.016
35. Adler GH, Levins R. The island syndrome in rodent populations. The Quaterly Review of Biology. 1994; 69(4):473–90.
36. Barton NH. Natural selection and random genetic drift as causes of evolution on islands. Philosophical Transactions of the Royal Society, London B. 1996; 351(1341):785–94.
37. Renaud S, Hardouin EA, Pisanu B, Chapuis J-L. Invasive house mice facing a changing environment on the Sub-Antarctic Guillou Island (Kerguelen Archipelago). Journal of Evolutionary Biology. 2013;in press.
38. Michaux J, Cucchi T, Renaud S, Garcia-Talavera F, Hutterer R. Evolution of an invasive rodent on an archipelago as revealed by molar shape analysis: the house mouse in the Canary islands. Journal of Biogeography. 2007; 34:1412–25.
39. Davis SJM. Morphometric variation of populations of House mice Mus domesticus in Britain and Faroe. Journal of Zoology, London. 1983; 199:521–34.
40. Valenzuela-Lamas S, Baylac M, Cucchi T, Vigne J-D. House mouse dispersal in Iron Age Spain: a geo-metric morphogeo-metrics appraisal. Biological Journal of the Linnean Society. 2011; 102:483–97. 41. Staubach F, Lorenc A, Messer PW, Tang K, Petrov DA, Tautz D. Genome patterns of selection and
introgression of haplotypes in natural populations of the house mouse (Mus musculus). PLoS Genetics. 2012; 8(8):e1002891. doi:10.1371/journal.pgen.1002891PMID:22956910
42. Ihle S, Ravaoarimanana I, Thomas M, Tautz D. An analysis of signatures of selective sweeps in natural populations of the house mouse. Molecular Biology and Evolution. 2006; 23(4):790–7. PMID:
16421176
43. Linnenbrink M, Wang J, Hardouin EA, Künzel S, Metzler D, Baines JF. The role of biogeography in shaping diversity of the intestinal microbiota in house mice. Molecular Ecology. 2013; 22(7):1904–16. doi:10.1111/mec.12206PMID:23398547
44. Nachman MW, Boyer SN, Searle JB, Aquadro CF. Mitochondrial DNA variation and the evolution of Robertsonian chromosomal races of house mice, Mus domesticus. Genetics. 1994; 136:1105–20. PMID:8005418
45. Prager EM, Sage RD, Gyllensten U, Thomas WK, Hubner R, Jones CS, et al. Mitochondrial DNA sequence diversity and the colonization of Scandinavia by house mice from East Holstein. Biological Journal of the Linnean Society. 1993; 50:85–122.
46. Suzuki H, Nunome M, Kinoshita G, Aplin KP, Vogel P, Kryukov AP, et al. Evolutionary and dispersal history of Eurasian house mice Mus musculus clarified by more extensive geographic sampling of mito-chondrial DNA. Heredity. 2013; 111:375–90. doi:10.1038/hdy.2013.60PMID:23820581
47. Hardouin E, Chapuis J-L, Stevens MI, van Vuuren JB, Quillfeldt P, Scavetta RJ, et al. House mouse col-onization patterns on the sub-Antarctic Kerguelen Archipelago suggest singular primary invasions and resilience against re-invasion. BMC Evolutionary Biology. 2010; 10:325. doi:www.biomedcentral.com/ 1471-2148/10/325PMID:20977744
48. Hall TA. BioEdit: a user-friendly biological sequence alignment editor and analysis program for Win-dows 95/98/NT. Nucleic Acids Symposium Series. 1999; 41:95–8.
49. Tamura K, Dudley J, Nei M, Kumar S. MEGA4: Molecular Evolutionary Genetics Analysis (MEGA) soft-ware version 4.0. Molecular Biology and Evolution. 2007; 24:1596–9. PMID:17488738
50. Darriba D, G.L. T, R. D, P D. jModelTest 2: more models, new heuristics and parallel computing. Nature Methods 2012; 9(8):772.
51. Ronquist F, Teslenko M, van der Mark P, Ayres D, Darling A, Hohna S, et al. MrBayes 3.2: Efficient Bayesian phylogenetic inference and model choice across a large model space. Systematic Biology 2011; 61 (3):539–42.
52. Rambaut A. FigTree, ver. 1.3.1. [Online]. Available:http://tree.bio.ed.ac.uk/software/figtree. 2009. 53. Renaud S. First upper molar and mandible shape of wood mice (Apodemus sylvaticus) from northern
Germany: ageing, habitat and insularity. Mammalian Biology. 2005; 70(3):157–70.
54. Kuhl FP, Giardina CR. Elliptic Fourier features of a closed contour. Computer Graphics and Image Pro-cessing. 1982; 18:259–78.
55. R-Core-Team. R: a langage for environment and statistical computing. Vienna, Austria: R Foundation for Statistical Computing; 2014.
56. Dray S, Dufour A-B. The ade4 package: implementing the duality diagram for ecologists. Journal of Sta-tistical Software 2007; 22:1–20.
57. Polly PD. Developmental dynamics and G-matrices: Can morphometric spaces be used to model phe-notypic evolution? Evolutionary Biology. 2008; 35:83–96.
58. Peres-Neto PR, Jackson DA. How well do multivariate data sets match? The advantages of a Procrus-tean superimposition approach over the Mantel test. Oecologia. 2001; 129:169–78.
59. Gower JC. Some distance properties of latent root and vector methods used in multivariate analysis. Biometrika. 1966; 53:325–38.
60. Oksanen J, Blanchet FG, Kindt R, Legendre P, Minchin PR, O'Hara RB, et al. vegan: Community Ecol-ogy Package. R package version 2.0–10.http://CRAN.R-project.org/package=vegan. 2013.
61. Hunt G. Evolutionary divergence in directions of high phenotypic variance in the ostracode genus Poseidonamicus. Evolution. 2007; 61(7):1560–76. PMID:17598740
62. Renaud S, Auffray J-C, Michaux J. Conserved phenotypic variation patterns, evolution along lines of least resistance, and departure due to selection in fossil rodents. Evolution. 2006; 60(8):1701–17. PMID:17017070
63. McGuigan K, Chenoweth SF, Blows MW. Phenotypic divergence along lines of genetic variance. The American Naturalist. 2005; 165(1):32–43. doi: 0003-0147/2005/16501-40325$15.00. PMID:15729638
64. Bégin M, Roff DA. The constancy of the G matrix through species divergence and the effects of quanti-tative genetic constraints on phenotypic evolution: a case study in crickets. Evolution. 2003; 57 (5):1107–20. PMID:12836827
65. Martínez-Abadías N, Esparza M, Sjøvold T, González-José R, Santos M, Hernández M, et al. Perva-sive genetic integration directs the evolution of human skull shape. Evolution. 2012; 66(4):1010–23. doi:10.1111/j.1558-5646.2011.01496.xPMID:22486686
66. Renaud S, Quéré J-P, Michaux JR. Biogeographic variations in wood mice: Testing for the role of mor-phological variation as a line of least resistance to evolution. In: Cox PG, Hautier L, editors. Evolution of the Rodents: Advances in Phylogeny, Paleontology and Functional Morphology. Cambridge Studies in Morphology and Molecules: New Paradigms in Evolutionary Biology Cambridge: Cambridge University Press; in press.
67. Millien V. Morphological evolution is accelerated among island mammals. PLoS Biology. 2006; 4(10): e321. doi:10.1371/journal.pbio.0040321PMID:16968136
68. Cucchi T, Barnett R, Martinkova N, Renaud S, Renvoisé E, Evin A, et al. The changing pace of insular life: 5000 years of microevolution in the Orkney vole (Microtus arvalis orcadensis). Evolution. 2014; 68 (10):2804–20. doi:10.1111/evo.12476PMID:24957579
69. Renaud S, Chevret P, Michaux J. Morphological vs. molecular evolution: ecology and phylogeny both shape the mandible of rodents. Zoologica Scripta. 2007; 36:525–35.
70. Ackermann RR, Cheverud JM. Detecting genetic drift versus selection in human evolution. Proceed-ings of the National Academy of Sciences, USA. 2004; 101(52):17946–51.