HAL Id: hal-02615576
https://hal.inria.fr/hal-02615576
Submitted on 22 May 2020
HAL is a multi-disciplinary open access
archive for the deposit and dissemination of
sci-entific research documents, whether they are
pub-lished or not. The documents may come from
teaching and research institutions in France or
abroad, or from public or private research centers.
L’archive ouverte pluridisciplinaire HAL, est
destinée au dépôt et à la diffusion de documents
scientifiques de niveau recherche, publiés ou non,
émanant des établissements d’enseignement et de
recherche français ou étrangers, des laboratoires
publics ou privés.
Streaming: QoE driven bandwidth sharing framework
Othmane Belmoukadam, Muhammad Jawad Khokhar, Chadi Barakat
To cite this version:
Othmane Belmoukadam, Muhammad Jawad Khokhar, Chadi Barakat. On Accounting for Screen
Resolution in Adaptive Video Streaming: QoE driven bandwidth sharing framework. International
Journal of Network Management, Wiley, 2021, 31 (1), pp.e2128. �10.1002/nem.2128�. �hal-02615576�
On Accounting for Screen Resolution in Adaptive
Video Streaming: QoE driven bandwidth sharing
framework
Othmane Belmoukadam, Muhammad Jawad Khokhar and Chadi Barakat
Abstract
Screen resolution along with network conditions are main objective factors impacting the user experience, in particular for video streaming applications. User terminals on their side feature more and more advanced characteristics resulting in different network requirements for good visual experience. Previous studies tried to link MOS (Mean Opinion Score) to video bitrate for different screen types (e.g., Common Intermediate Format (CIF), Quarter Common Intermediate Format (QCIF), and High Definition (HD)). We leverage such studies and formulate a QoE driven resource allocation problem to pinpoint the optimal bandwidth allocation that maximizes the QoE (Quality of Experience) over all users of a network service provider located behind the same bottleneck link, while accounting for the characteristics of the screens they use for video playout. For our optimization problem, QoE functions are built using curve fitting on datasets capturing the relationship between MOS, screen characteristics, and bandwidth requirements. We propose a simple heuristic based on Lagrangian relaxation and KKT (Karush Kuhn Tucker) conditions to efficiently solve the optimization problem. Our numerical simulations show that the proposed heuristic is able to increase overall QoE up to 20% compared to an allocation with a TCP look-alike strategy implementing max-min fairness.
Index Terms
Screen resolution, Quality of Experience, Non-linear programming, Bandwidth sharing, Ns-3
I. INTRODUCTION
Video streaming is more and more important in our daily life. Several platforms such as YouTube, Dailymotion and Netflix, propose a variety of video contents covering different topics and categories. Video streaming is also known as the killing application of the internet today. A 2018 study by Ericson [1], as shown in Figure 1, suggests that among all application categories, the mobile video traffic is expected to grow by nearly 50% annually through 2022.
Fig. 1: Mobile traffic by application category CAGR 2016-2022, source [1]
On one side, end devices such as mobile phones, tablets, and monitors, are doted with more and more advanced features. In particular, they support different but still limited video formats and resolutions. Apple with more than 20% share of the mobile market presents plenty of products with several characteristics [2]. For example, an iPhone 4S supports up to 640x480 pixels, while an iPhone 8 supports up to 1334x750 pixels. On the other side, mobile operators and network providers give high importance to QoE (Quality of Experience) as a metric to assess users’ satisfaction and avoid any economic loss. Even
Othmane Belmoukadam Universit´e Cˆote d’Azur, Inria, France e-mail: ([email protected]). Muhammad Jawad Khokhar Universit´e Cˆote d’Azur, Inria, France e-mail: ([email protected]). Chadi Barakat Universit´e Cˆote d’Azur, Inria, France e-mail: ([email protected]).
1An earlier version of this work appeared in the proceedings of the 15-th International Conference on Network and Service Management (CNSM), Halifax,
though 5G networks promise high connectivity and huge transmission capacity aiming to take the internet services and the corresponding user experience to the next level [3], [4], bandwidth sharing is still an important issue for network operators and content providers, especially in view of the exponential rise of video traffic volume (Figure 1). It turns out that the objective aspect of Quality of Experience is tightly correlated to terminal playout characteristics (e.g., size, resolution) but also to network conditions [5], [6], [7].
In light of the previous facts, studies have linked QoE metric MOS (Mean Opinion Score) to bitrate for different screen resolutions in the context of video streaming. By assembling video quality data for screens of different resolutions, Cermak et al. [8] managed to show that small screens (e.g., CIF, QCIF) scale toward high MOS levels at small bitrates. Moreover, they provide a curve for H.246 bitrate required for a desired MOS level for different screen resolutions (Figure 5 in [8]). On the other side, content providers, such as YouTube, propose content in different resolutions without a careful customization to the screen or to the viewport. It follows that an end device can download video at more than its display capacity before transcoding it down to match its display, which consists in a waste of network resources without bringing additional gain to the user in terms of her QoE. In practice, the choice between the different resolutions is managed either statically by the user, or automatically by the player thanks to an HTTP Adaptive Streaming (HAS) protocol in a way to cope with the network conditions. A well known HAS protocol used by major content providers is MPEG DASH [9]. In this context, changing the viewport does not necessarily mean a resolution change as the HAS protocol still downloads the best available video resolution that fits within the available network bandwidth. Less is done to explore how one can leverage the terminal characteristics (e.g., screen resolution) in the allocation of network resources (e.g., bandwidth). This allocation is often left to the HAS and TCP protocols, which in case of multiple flows sharing a bottleneck link, converge to a fair split of the available bandwidth. For different screen resolutions, or different viewports in general, this latter allocation does not lead to a fair QoE allocation, nor to an optimal overall QoE.
In this paper, we study the problem of resource allocation for several video flows sharing the same bottleneck, and develop an optimization framework to maximize the overall QoE taking into consideration terminal display capabilities. We use two datasets to fit QoE functions that link throughput [10] or video bitrate [8] to a QoE level. We formulate a non-linear optimization problem and propose a heuristic to solve it, then we conduct numerical and network simulations under different system settings to validate the interest of a QoE driven bandwidth allocation approach. Our results show that we can indeed ensure a higher overall QoE if screen resolution is taken into consideration while allocating network bandwidth resources. Our contributions can be summarized as follows:
• We formulate an optimization problem for network resource allocation which is based on QoE and where QoE functions are built using datasets linking (throughput or bitrate) to MOS.
• We present a relaxation of our problem to a non-linear problem by considering continuous video bitrates. Under this
relaxation, we develop a simple and greedy heuristic based on Lagrangian multipliers and KKT conditions, and prove that our heuristic converges to a state where all gradients are either equal or constraints on the bitrate reached.
• We use the network simulator ns-3 [11] and an open source implementation of DASH to validate our approach and to
propose an implementation of the optimal solution by limiting the subset of visible video representations by a player according to the resolution of its viewport.
The rest of the paper is organized as follows. Section II reviews some of the related works on QoE modeling and resource sharing. In Sections III and IV we present our framework and formulate our optimization problem. Section V shows numerical results and evaluates the gain of the proposed solution compared to other allocation strategies. In Section VI we illustrate our experimental results using the network simulator ns-3 [12], [13], and evaluate the gain in terms of overall QoE for both the optimal solution and a practical implementation that limits the video bitrate as a function of the client’s viewport. Finally, we conclude and provide traces for our future work.
II. RELATED WORKS
The topic QoE driven resource sharing has been already investigated in several occasions. For example, in terms of routing, neural networks have been used in both wired and wireless networks to optimize QoE. Previous works try to select the best path using network-level QoS features as QoE replacement (e.g., loss rate, delay) [14], [15].
Mao et al. propose using reinforcement learning (RL) to generates ABR algorithms. The Pensieve leverages observations collected by client video players to train a neural network model that selects bitrates for future video chunks. The authors show that Pensieve outperforms the best state-of-the-art scheme, with improvements in average QoE [16].
Quang et al. illustrate QoE driven routing as a MILP problem by considering Pseudo-Subjective Quality Assessment (PSQA) as QoE model and propose a heuristic solution [17]. Moreover, Calvigioni et al. take into consideration the HAS flow requirements and study them in conjunction with TCP. They use a linear QoE function in order to express a joint routing and resource allocation problem and propose a dual sub-gradient approach based on Lagrangian relaxation sub-problems to select a single best path upon each request [18].
In another work [19], the authors express a rate allocation problem to maximize a Two-term Power Series Model over three requested resolutions and under link capacity constraint. The optimal solution is implemented in switches by means of weighted
fair queuing and by using OpenFlow. However, the Utility function used depends on the characteristics of a test video that is too specific and less generic since it requires a mapping per video at each resolution. Moreover, the use of the Structural Similarity Index (SSIM) as a metric to assess quality requires very specific state sharing with the controller, which can be tricky giving the prevalence of encryption-based delivery. In [20], the authors present another approach based on queuing, without routing or any client modification. The latter paper, uses a controller able to track the clients’ buffers states and use priority queuing for the flow in danger of interruptions. In MPEG-DASH SAND, we find the coupling of network assistance with coordination from the client. In fact, the network has a general view and can provide bandwidth reservation at routers, clients are in charge of the final decision and can receive recommendations [21][22][23].
In terms of QoE modeling, the application QoS to QoE relationship has been studied in detail in the literature. In [24][25][26] the authors proved and verified the impact of interruptions in video streaming services. Moreover, they showed that video streaming QoE is influenced by both the duration and the frequency of stalling events. On the other hand, we have mobile applications(e.g., ACQUA) able to infer QoE from network measurements made on the end users’ mobile devices. The ACQUA application uses Machine Learning models calibrated with controlled experiments so as to capture the link between network level QoS (e.g., throughput, delay and loss rate) and the objective QoE [6].
However, to the best of our knowledge, studying the resource sharing problem from an end device perspective and with trace-driven models for video QoE remains an open and challenging problem. Therefore, we focus on video streaming and leverage QoE functions able to capture the link between video bitrates or throughput and QoE for different screen resolutions. We express a resource sharing problem to maximize the sum of the non-linear QoE functions under linear constraints on the screen resolution and the bottleneck link utilization. We also validate our model and compare the different solutions with a realistic DASH implementation in ns-3.
III. FRAMEWORK AND SYSTEM MODEL
A. Framework
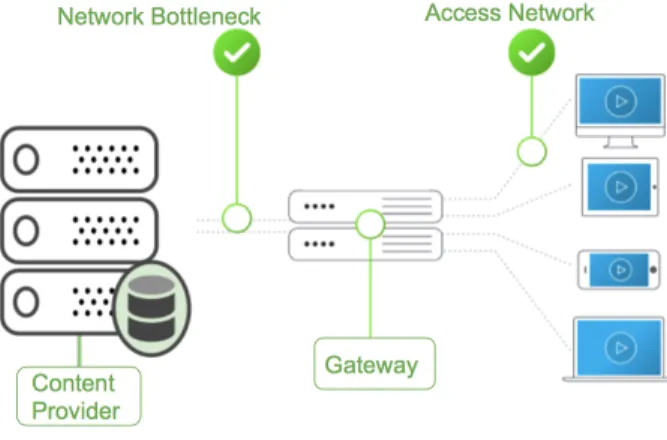
Consider a set of users with different screen resolutions (alternatively viewports) streaming videos from a server as illustrated in Figure 2. Videos on the server are encoded into M different representations (i.e., bitrates or resolutions). We assume users are not limited by their access links and are thus able to download any video representation available on the server. We assume the bottleneck of the system to be the backhaul link located between the gateway and the video server. Such a backhaul link can be the one of current wireless networks or the peering link of a network access provider whose users are connected to the internet by high speed optical fibers.
In this work, we focus on the problem of QoE driven bandwidth sharing on the backhaul link, and do not consider the presence of any caching functionality at the gateway. Caching would add another interesting dimension to our problem, and would certainly interact with bandwidth sharing on the backhaul, so we differ its study to a future work dedicated to the topic. For now, one can see our work as specific to those videos that are not cached.
Fig. 2: Framework overview
B. System model
We now describe in more detail the model that we consider in this work and introduce our notation. Let F denote the set of video files in our catalog (server) offered to the users. Any video file f ∈ F is encoded into a set of M representations with fmbeing the m-th representation of video f , having an encoding bitrate equal to Bf mand corresponding to a particular
T . Further, we suppose that ∀f ∈ F and ∀m ∈ [1, . . . , M ], the video bitrates Bf m’s are the same (i.e., which can be seen as
the average over all videos of the catalogue for representation m). Finally, let S be the vector of distinct screen resolutions.
Notation Representation
F Set of videos
M Number of video representations (resolutions) on the server
S Set of screen resolutions
λf Request rate per Video f
λf,s Request rate per video f and screen resolution s
α Parameter of the popularity Zipf distribution
Cl Backhaul link capacity
BM,s Upper bound on bitrate for s ∈ S
X Bandwidth allocation vector
TABLE I: Notations of our framework
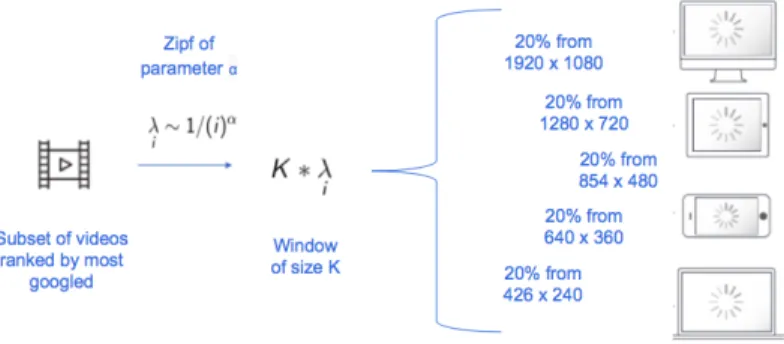
For every f ∈ F we assign a request rate λf (i.e., popularity) according to a Zipf distribution of parameter α. This
request rate is total over all screen resolutions. Each request to a video f is supposed to originate from a particular screen resolution according to a given probability distribution over S. In practice, a network operator can obtain such information on the originated screen resolution by using the IMEI (International Mobile Equipment Identity) of the end-user device or by collaborating with the video content provider. Multiplied by λf, this probability gives the request rate per video f and per
screen resolution s that we denote λf,s. We have λf =Ps∈Sλf,s. Table I summarizes the notation used in our framework,
while Figure 3 illustrates the process of generating requests for the case |S| = 5 screens (most common screen resolutions in mobile market).
Fig. 3: Traffic generation according to our model
C. From QoS to QoE
As per prior subjective studies, the QoE of video streaming is a function of application layer QoS features that are either dependent on the video content (e.g., video bitrate) or the playout metrics (e.g., the intial startup delay) [7], [27]; the playout metrics further depend on the underlying network conditions such as the network throughput or delay. In this work, we consider building QoE functions that take as input the network throughput or the video bitrate, and differ to a future work the consideration of other factors that might also impact the QoE, though to a lesser importance, such as the delay and the loss rate. To build these QoE functions, we rely on two publicly available datasets that map the QoS to the QoE. The first dataset is built by controlled experiments and links the network throughput to the QoE modeled according to ITU P.1203 recommendation [10], while the second dataset is based on the work of the Video Quality Experts Group (VQEG) [8] and maps the video bitrate to the MOS. On these datasets, we apply curve fitting methods (e.g., non-linear least squares) with the canonical function given in Equation (1) to build our target QoE function taking each time as input the network throughput and the video bitrate respectively. In this Equation (1), x stands for the network throughput or the video bitrate, while index s stands for the screen resolution. Constant β is the fitted parameter that determines the shape of the QoE function.
QoEs =
expQoEmax(1 − e
−βsx). (1)
1) Network throughput to QoE: The dataset for this model is built by controlled experiments in the lab [10]. The idea is to link the MOS of video streaming to the available bandwidth inside the network. The dataset consists of 100k unique YouTube video playouts under different trace-driven emulated network conditions. This dataset maps the network QoS features such as throughput, delay, and packet loss to application level measurements such as join time, stalls and video resolutions. The measured application QoS allows to calculate the ITU-T P.1203 subjective MOS 1 for different screen resolutions. We
use curve fitting based on Equation (1) to establish the relation between the MOS computed according to ITU standard with respect to the sole network throughput for the different screen resolutions as shown in Figure 4. The screen resolutions given in the figure correspond to the available video resolutions in the traces of the experiments carried out in [10].
Fig. 4: Fitting QoE function (1) using controlled experiments data from [10]
2) Video bitrate to QoE: Here we use another dataset to calibrate the QoE function in Equation (1), but this time as a function of the video bitrate. Cermak et al. [8] studied the relationship between the video quality, the screen resolution, and the video bitrate using the VQEG datasets. The authors show that for screen resolutions such as CIF, QCIF and HD, different video bitrates are needed to achieve a certain MOS level (see Figure 5 in [8]). For the main mobile screen resolutions, typically from 426x240 up to 1920x1080, we extrapolate a vector Z where each entry has two values (zBR, zM OS) then we use mean
square error method to fit curves using Equation (1). In Figure 5, we plot the fitted curves for four main screen resolutions, these curves therefore map the bitrate to the MoS level based on the video quality expert group data available in [8].
Fig. 5: Fitting QoE function (1) using video quality expert group data [8]
Note that according to [8], the video bitrates take discrete values, thus making the resource allocation problem an INLP (Integer Non-Linear). However, for this work, we relax the problem to make the bitrate take any real value between its minimum and maximum values given by [8], which has the advantage to transform the resource allocation problem into an NLP (Non-Linear), hence easing the solution. We believe in real scenarios, video content varies considerably making the bitrate take more diverse values than the ones in [8].
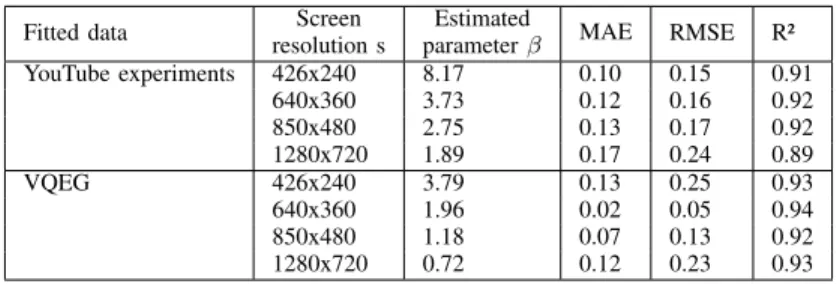
3) Curve fitting evaluation: As highlighted earlier, we rely on two public datasets to map the QoS to the QoE [10], [8]. For each, we use the non-linear least squares method to estimate the parameter β of Equation (1) for every screen resolution. We rely on three metrics to estimate the goodness-of-fit of the obtained model: the root mean square error (RMSE), the mean absolute error (MAE) and the R² score a.k.a coefficient of determination [28]. In particular, the R² score can be seen as the percentage of the prediction value’s variance that can be explained by the model. The closer is the R² score to 1, the better the model represents the variance of the dataset. We show in Table II the estimated parameter β, the mean absolute error, the RMSE and the R² score for every screen resolution using each of the datasets. We note how for curve fitting using the YouTube controlled experiments data, the RMSE varies between 0.15 and 0.24 on a scale from 1 to 5 indicating a high accuracy of the exponential model in Equation (1). This good performance of the model is also confirmed for the VQEG data with even lower values for the MAE and the RMSE.
Fitted data resolution sScreen parameter βEstimated MAE RMSE R² YouTube experiments 426x240 8.17 0.10 0.15 0.91 640x360 3.73 0.12 0.16 0.92 850x480 2.75 0.13 0.17 0.92 1280x720 1.89 0.17 0.24 0.89 VQEG 426x240 3.79 0.13 0.25 0.93 640x360 1.96 0.02 0.05 0.94 850x480 1.18 0.07 0.13 0.92 1280x720 0.72 0.12 0.23 0.93
TABLE II: Curve fitting evaluation
IV. QOEDRIVEN BANDWIDTH SHARING
A. Problem description
Our problem can be described as follows. Given the different representations of videos, the distribution of screen resolutions and the backhaul link capacity (denoted Cl), we seek how to share the bandwidth of the backhaul link between the multiple
video sessions so that the total system utility (defined as the sum of QoE as explained in Section III-C1) is maximized. We want this maximization to account for the screen resolutions and for the constraint on the capacity of the backhaul link. Note here that the best we can hope from TCP and DASH is a fair split of the available Cl over all flows except if the client is
configured not to download resolutions above some threshold depending on the screen. The optimal allocation is nontrivial as fairness at the resource level does not necessarily imply fairness at the QoE level. The fact that small screens require lower bitrates than large screens for same level of QoE is a good illustration.
B. Problem formulation
Let’s introduce the vector X = (xs), s ∈ S, where the s-th element denotes the bandwidth allocated to each of the users
with screen resolution s. The QoE-driven bandwidth allocation for optimal video quality improvement can be formulated as a nonlinear program (NLP) as follows:
max X U (X) = X s∈S λsQoEs(xs) (2a) s.t. X s∈S λsT xs≤ Cl (2b) xs≤ BM,s, s ∈ S (2c) xs≥ 0, s ∈ S (2d)
The global utility function of the system is defined as the sum of weighted QoE functions defined and calibrated in Sections III-C1 and III-C2. To do so, we aggregate users with same screen resolution as they are supposed to obtain the same bandwidth allocation (λs=Pf ∈Fλf,s). Constraint (2b) accounts for the backhaul capacity limitation, whereas constraint (2c)
upper bounds the allocation for every screen resolution based on the bitrate or throughput needed for excellent video quality at this screen resolution according to the datasets we are using. Note here that this upper bound can be removed as it is accounted for indirectly by the QoE functions (i.e., the QoE is at its maximum value for any allocation greater than this upper bound), but we decided to keep it for clarity of the presentation.
C. Gradient solution based on Lagrangian relaxation
For the QoE function we consider in this paper (Equation (1)), our problem is convex and thus possesses a unique solution. One can use well known heuristics such as Sequential Least Squares [29] to get an approximation of the optimal allocation. However, given the particular shape of our QoE functions (i.e., mono-variate) and constraints, and to help getting further insights on the optimal solution, we propose a simple greedy heuristic that helps approximating the non-linear objective function and efficiently maximizing it. The proposed greedy heuristic considers KKT (Karush Kuhn Tucker) conditions to check if a feasible solution is optimal. We start by writing the partial Lagrangian function obtained by relaxing constraints (2c) and (2d):
L(X, γ) = U (X) − γ(X
s∈S
(λsT xs) − Cl). (3)
Constant γ is the Lagrangian multiplier associated to constraint (2b). By supposing constraint (2b) to be set to equality at the optimal solution (otherwise the system is under-utilized), and by differentiating the Lagrangian L(X, γ) with respect
to allocation vector X, we can prove that a first possible solution could be the one that equalizes all gradients of the QoE functions. ∂QoEi(xi) ∂xi = ∂QoEj(xj) ∂xj , ∀(i, j) ∈ S. (4)
This, together with (P
s∈S
(λsT xs) − Cl) = 0, gives a system of equations that we denote W and that we can solve to find
our first bid on the optimal allocation vector. This first bid is the optimal allocation if the two other constraints (2c) and (2d) are not violated, otherwise our vector is not the optimal vector and has to be updated. We use the information on the violated constraints to reshape the search space, i.e., we take those violated constraints one by one and at each step, we set the corresponding allocation either to zero or to the upper bound, then we replace them in the Lagrangian (3) and repeat the previous process until converging to an allocation that satisfies all constraints while nullifying the gradient of the Lagrangian. The following algorithm provides further details on our approach.
Algorithm 1: Compute allocation vector Output: Optimal value of X = (xs), s ∈ S
Input: λs, QoEs, BM,s, Cl Initialize X f rom (W ) ∂QoEi ∂xi = ∂QoEj ∂xj ∀(i, j) ∈ S (P s∈S (λsT xs) − Cl)) = 0
while either (2c) or (2d) false do if ∃ xi∈ X, such that xi < 0 then
Set Min(xi∈ X| xi< 0) = 0 f or (X, W );
Solve (W ); Continue; end
if ∃ xi∈ X, such that xi > BM,ithen
Set Max(xi ∈ X| xi> BM,i) = BM,if or (X, W );
Solve (W ); Continue; end
end
D. QoE fairness at the equilibrium
In this section we discuss the QoE fairness at the equilibrium, as ensured by our optimal solution. We always consider the case when the QoE is modeled using an exponential function, even though the method hereafter applies to other functions. The optimal QoE aware bandwidth allocation is reached when the gradients of QoE are equal (see Equation (4)). Let’s consider two screen resolutions (i) and (j), and let’s use Equation (4) and the QoE definition in Equation (1) to derive the relation between the QoE achieved by the two screen resolutions at the equilibrium. After differentiation and substitution of the exponential term by its value as a function of QoEmax and (QoEi, QoEj), we get the following equality at optimal allocation:
βi(QoEmax− QoEi) = βj(QoEmax− QoEj), ∀i, j, 0 < xi< BM,i, 0 < xj< BM,j. (5)
Note that for this, we suppose that the constraint on the maximum bitrate is not reached. The one on the impossibility of a negative bitrate is naturally not reached at optimal allocation. In case the former constraint is reached for some screen resolutions, those screens will be at their maximum QoE, and the equality will only hold for the other screens for which the QoE maximum is still not reached. The above equality implies that for the optimal solution of QoE aware bandwidth allocation, the difference between the maximum QoE and the achieved QoE is inversely proportional to the β value of the corresponding screen resolution. An example of these β values can be found in Table II. This can be written as:
(QoEmax− QoEi) ∝
1 βi
. (6)
We can thus conclude that the slower the convergence of the QoE function with the bitrate (i.e. case of large screens), the smaller the β and the smaller the QoE value. On the other hand, the faster the convergence of the QoE function (i.e. case of small screens), the larger the β and the better the QoE value. Small screens thus achieve better QoE than large screens, but the latter ones don’t starve either, they still achieve acceptable QoE level, with the distance to the maximum QoE level inversely proportional to their β value. For example, by referring to Table II, screen resolution 1280x720 is only at twice distance from maximum QoE than screen resolution 640x360. Note here than it is only the distance to maximum QoE that goes inversely proportional to β parameter at optimal allocation of backhaul bandwidth, not the absolute value of the QoE itself.
V. NUMERICAL SIMULATIONS
A. Simulation setup
We consider a network where a set of users have different screen resolutions distributed uniformly over S. We consider S to include the five major mobile screen resolutions depicted in Figure 3. Videos are of equal duration, the allocation vector X is proportional in this case to the number of bytes each video would require from the network.
As reference allocations, we consider two max-min allocations, which model the existing solutions based on TCP and DASH. The first allocation is called max-min fair which consists in video flows sharing equally the available bandwidth independently of the characteristics of their screens (i.e., a flow can get more than it can play out). The second allocation is called max-min screen based where bandwidth is fairly shared but in the limit of maximum supported bitrate per screen (denoted BM,s
according to our notation). This consists in a video flow of screen size s fighting for the bandwidth and sharing it fairly with the others as long as the maximum bitrate BM,s is not reached. Once reached, the flow (i.e., DASH) does not ask for higher
bitrates even if bandwidth is available in the network. This control can be either implemented at the client, or at the server if information on the screen (or viewport) is made available to it. In addition to these reference allocations, we use our heuristic to derive the best bandwidth allocation that maximizes the sum of QoE functions over all flows. We show results for the exponential QoE function in Equation (1), but we also discuss an extreme case where QoE grows linearly with the throughput or the bitrate. Note that the optimization with a linear QoE function cannot be solved with our heuristic as it corresponds to a linear program. We solve it instead with CPLEX [30] and provide an intuitive interpretation of the results. Note also that we focus on a snapshot problem where we perform the optimization only once before assigning the resources. For dynamic scenarios where the flow arrival rates for the different screens vary with time, we suppose the existence of a mechanism to estimate these rates on the fly, then we use the estimations to set the optimal allocation for each of the flows in an online fashion.
B. Bandwidth allocation and QoE
We compare the previous allocation strategies in terms of the overall QoE while varying the backhaul capacity. We start by considering the dataset available in [8] (see Section III-C2) to calibrate our QoE functions. We express the backhaul capacity as a percentage of the worst case scenario where the operator over-dimensions its network to deliver the maximum bitrate to all users independently of their screen sizes.
0 20 40 60 80 100 Backhaul capacity (%) 0 1 2 3 4 QoE Optimal solution Max-min screen based Max-min fair
(a) QoE per allocation strategy
0 20 40 60 80 100 Backhaul capacity (%) 0 2 4 6 8 10 12 14 16 Gain (%) Optimal solution Max-min screen based
(b) Relative gain, uniform screen probabilities
Fig. 6: Comparison of allocation strategies with uniform screen probabilities (dataset of [8])
Figure 6 shows the overall QoE as a function of the backhaul capacity Cl. It also shows the relative gain of the two
strategies optimal and max-min screen based with respect to the baseline strategy max-min fair. We notice how leveraging the QoE function with very limited backhaul capacity can achieve a QoE gain up to 16% over the baseline strategy. Furthermore, the optimal and the max-min screen based strategies manage to reach the maximum possible QoE earlier than the max-min fair one while increasing the backhaul capacity. For small backhaul capacity (below 20%), max-min fair and max-min screen based lead to same result (i.e., zero gain) as the maximum bitrate per screen is not reached, which is not the case of the optimal strategy which still delivers a better result. We recall that this result is obtained for screen sizes of equal popularity over the set S. To check for the impact of screen popularity, we apply other distributions of screen sizes over S and find that our approach works well for other scenarios. Moreover, we point to cases where the gain can actually be up to 20% compared to a simple fair split of the available backhaul capacity.
Indeed, we compare in Figure 7 the different allocation strategies for different scenarios. Figures 7(a and b) considers the scenario of a bi-modal screen size distribution with only two screen resolutions of equal probabilities, 426x240 (small) and 1920x1080 (large). The other two figures, Figures 7(c and d), consider a distribution where popularity either increases or decreases with the screen resolution. For example, in Figure 7(c), the distribution simulated is 45% of 1920x1080, 35% of
0 20 40 60 80 100 Backhaul capacity (%) 0 1 2 3 4 QoE Optimal solution Max-min screen based Max-min fair
(a) QoE per allocation strategy, 426x240 and 1920x1080
0 20 40 60 80 100 Backhaul capacity (%) 0 5 10 15 20 Gain (%) Optimal solution Max-min screen based
(b) Relative gain, 426x240 and 1920x1080
(c) Relative gain, distribution increasing toward 1920x1080 (d) Relative gain, distribution increasing toward 426x240
Fig. 7: Comparison of allocation strategies with different screen size distributions (dataset of [8])
1280x720, 10% of 854x480 and 5% for each of 640x360 and 426x240 screen resolutions. This distribution is then reversed for the simulation highlighted in Figure 7(d). We make sure to consider scenarios that are general on one hand, and but that also reflect in some of them the reality of the mobile devices market, where 80% of today’s mobile devices have a screen resolution of at least 720p [31] (i.e., the height of the screen or viewport in pixels). In Figure 7(b), we notice how the gain improves and can go above 20%. In this case, we end up with two equal subsets of users, greedy users (large screens) and users easy to satisfy (small screens). In such scenario, the baseline strategy divides the available bandwidth fairly among all users, which is insufficient especially when Clis small, as large screens cannot get to an acceptable QoE level with the given
allocation while small screens get more than needed. However, in Figure 7(c and d), we notice that both max min fair and max min screen based strategies result in almost the same allocation giving approximately the same overall QoE (i.e., blue line near zero). These two latter figures correspond to scenarios where all screen sizes are present, but in the first case the popularity increases with the screen size, and in the second case the popularity decreases with the screen size. In the first case where the larger the screen the more its popularity, the majority of users are greedy, making it hard for the max min screen based strategy to serve all of them even though we are restricting the allocation of small screens. The screen based strategy thus behaves approximately as the max min fair one. For the second distribution where the larger the screen the less popular it is, we end up with a lot of users using small screens and asking for less resources. Even though the overall QoE is expected to be better in this case, the fact that the demand is more homogeneous makes the behaviour of the max min fair strategy again close to the max min screen based one. We can notice how for the latter case, when the backhaul capacity gets above 40%, small screens reach their upper limit, so the larger screens can start getting more resources leading to an improved gain. The optimal strategy keeps its good performance over the different scenarios we consider for screen size distribution.
We repeat the same numerical simulation but this time using QoE functions fitted on the controlled experiments data in [10] (see Section III-C1). Figure 8 includes comparison of the different strategies for the four distributions of screen sizes, (a) the uniform one, (b) the bi-modal small/large one, (c) the one biased toward large screens and (d) the one biased toward small screens. We can notice how the gain for these QoE functions drawn according to ITU-T P.1203 standard spans smaller ranges while maintaining the same shape as with QoE functions fitted using the dataset of [8]. In particular, for Figure 8(a) where all screen resolutions are uniformly present, our approach results in a gain in overall QoE up to 7% compared to the baseline TCP fair split (max-min fair). On the other hand, max-min screen based is only 1% better compared to the baseline. Moreover, when 50% of requests come from 426x240 devices and the rest from 1920x1080 devices, the optimal allocation (Figure 8(b)) results in a gain of 11% compared to baseline allocation. Again we notice that for small Cl, the max-min screen based strategy
and the max-min fair one result in almost the same allocation leading to the same QoE. In Figure 8(c and d), we highlight the same behaviour explained earlier, the max min fair and the max min screen based strategies give close results. As for
0 20 40 60 80 100 Backhaul capacity (%) 0 1 2 3 4 5 6 7 Gain (%) Optimal solution Max-min screen based
(a) Relative gain, uniform distribution
0 20 40 60 80 100 Backhaul capacity (%) 0 2 4 6 8 10 Gain (%) Optimal solution Max-min screen based
(b) Relative gain, 426x240 and 1920x1080
(c) Relative gain, distribution increasing toward 1920x1080 (d) Relative gain, distribution increasing toward 426x240
Fig. 8: Comparison of allocation strategies with different screen size distributions (dataset of [10])
the optimal strategy, it gives better performance especially for a backhaul capacity less than 20%. The above results highlight the interest of the QoE based approach and show that QoE unaware allocations do not lead to the best overall QoE neither in restricted backhaul capacity nor in scenarios of homogeneous screen resolutions. Upper limiting the bitrate to the screen resolution works in scenarios of high bandwidth, however, when the bandwidth becomes scarce, it provides close results as the simple screen unaware max min allocation, thus urging the need for an optimal QoE approach. Finally, we note that even though not considered in this work, our observations will very probably apply to larger screens of 2k and more, especially when they are mixed between each other and with screens of lower resolutions. Studying very high screen definitions will require the availability of QoE datasets and QoE models that are not at our disposal for the time being, we will come back to them in a future work.
C. Linear QoE
Instead of exponential QoE function, one can imagine an extreme case where QoE grows linearly with the network throughput or the video bitrate, within the range [0, BM,s] for screen resolution s. Even though not realistic, this type of QoE functions is
interesting because of its implication on the optimal allocation and the way it can be implemented. We add it for completeness of the study, knowing very well that it might not exist in practice. Indeed, in this case, the sum of linear QoE functions transforms the NLP problem to an LP problem that can no longer be solved with our heuristic. Instead, one can use CPLEX to solve it [30]. In such case, we found that more important gains can be reached. More interestingly, and because slopes of QoE functions are constant but no longer the same for all screens (fast slopes for small screens, slow slops for large screens), the optimal allocation would simply consist in giving full bandwidth priority to small screens on large screens. So small screens are served first in the limit of their BM,S, then larger screens, and so on, until all screens are served if resources are available.
Such allocation, as it requires full priority, cannot be simply implemented on an end-to-end basis (i.e. by limiting the maximum video resolution for example), but requires the intervention of the network operator as well.
To highlight the above observations, we plot in Figure 9 the resulting QoE for the different strategies discussed earlier w.r.t. the percentage of backhaul capacity. Overall, the max min fair and max min screen based are identical as expected for small backhaul capacity. However, the optimal strategy is giving much more pronounced gains up to 120% compared to baseline max-min fair strategy.
0 20 40 60 80 100 Backhaul capacity (%) 0 1 2 3 4 QoE Optimal solution Max-min screen based Max-min fair
(a) QoE per allocation strategy
0 20 40 60 80 100 Backhaul capacity (%) 0 20 40 60 80 100 120 140 Gain (%) Optimal solution Max-min screen based
(b) Relative gain, uniform screen probabilities
Fig. 9: Comparison of allocation strategies with uniform screen probabilities and linear QoE function (dataset of [8])
VI. NETWORK SIMULATION
For the validation of our numerical results, we use the simulation software ns-3 [11]. We work with an implementation of MPEG/DASH proposed by [32], [13] that supports the Smooth Video Adaptation Algorithm (SVAA) designed in [12]. DASH being a standard issued by MPEG in 2012 for HAS, different rate adaptation algorithms are proposed in the literature to figure out the resolution of the next segment to download so as to minimize the number of switches and stalls. The SVAA algorithm we consider has shown its efficiency in preventing resolution switches and interruptions [32], [13]. Our simulation setup consists of multiple terminals (fifteen in total) acting as DASH clients and streaming videos in parallel from a DASH server. Clients are connected to a router via access links of 5M bps and 2ms delay simulating ADSL access links. Their traffic is routed toward the central server by means of a wired link of fixed capacity 30M bps and of fixed delay 6ms. In terms of video content, we use an animated YouTube video called the Elephants Dream. The video is divided in segments of 2 seconds, produced using the H.264 compression standard with a maximum frame rate of 24 f/s. Moreover, the chunk bitrate is varying from 46 Kbps up to 4.3 Mbps using traces from [33].
In addition to the standard implementation of DASH/SVAA, we propose two other implementations illustrating the different aspects of our approach. To simulate the optimal solution (see Section IV-C), we find the optimal allocation of a video flow using our heuristic then limit the view of the client to video representations not exceeding this allocation. Moreover, we implement screen based max-min by changing the DASH/SVAA client so that the maximum downloadable representation is the ceil of the maximum bitrate for which the given screen resolution attains the maximum QoE (with respect to dataset in [8]). A. Simulating QoE driven DASH
We assign to our fifteen devices screen resolutions from a subset of five major mobile screen resolutions (e.g., from 426x240 to 1920x1080) using uniform probability distribution. The bandwidth allocation itself is calculated at the beginning of the simulation and is maintained constant through the simulation time, before being recalculated for the following simulation based on its new configuration. We simulate the users’ behavior with each of the described DASH implementations, then we plot the average attainable download bitrate over the shared link per screen resolution and calculate the total corresponding QoE using the functions fitted in Section III-C2. We repeat every simulation at most 20 times and average outputs to reduce the bias effect and smooth the results. For every average result, the 90% confidence intervals are plotted to help assessing their their convergence.
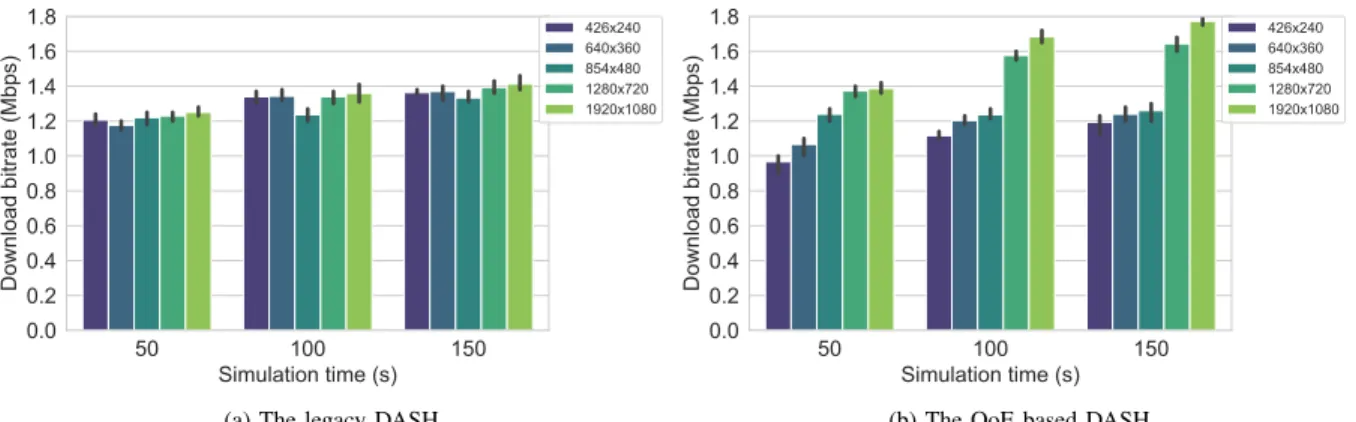
Figure 10(b) illustrates the effect of QoE based DASH, where we can see the attainable download bitrate proportional to the screen resolution as needed for good video quality. This is contrary to Figure 10(a) where all users grab approximately the same share of the available capacity as expected with a simple max-min allocation delivered by legacy DASH and TCP.
In Figure 11 we compute the average QoE per screen resolution for the three implementations: (a) legacy DASH, (b) screen based DASH, and (c) QoE based DASH. We notice through the three figures how the QoE is rearranged in between the different screen resolutions. Thanks to screen size consideration, we manage to enhance the average QoE for greedy users (big screen resolution) while maintaining a good QoE level for the others, all this without exceeding the backhaul budget.
We also compare the different implementations in terms of main application-level QoS factors (e.g., stalls, resolution switches) that could impact the subjective QoE [7], [27]. In Figure 12, we focus on the quality switches as they appear because of the DASH dynamics. We can see in Figure 12(b) how QoE based DASH manages to reduce the number of switches per screen resolution during a watching session compared to legacy DASH (Figure 12(a)). The reduction can be particularly noted for small screens that are now limited at the application level and thus have enough margin at the TCP level to further increase their download rate if needed by fast moving chunks. This margin does not exist for large screens who are throttled by TCP because for their high bitrate, they still achieve less resolution switches than in the case of legacy DASH. We also plot the
50 100 150 Simulation time (s) 0.0 0.2 0.4 0.6 0.8 1.0 1.2 1.4 1.6 1.8 Download bitrate (Mbps) 426x240 640x360 854x480 1280x720 1920x1080
(a) The legacy DASH
50 100 150 Simulation time (s) 0.0 0.2 0.4 0.6 0.8 1.0 1.2 1.4 1.6 1.8 Download bitrate (Mbps) 426x240 640x360 854x480 1280x720 1920x1080
(b) The QoE based DASH
Fig. 10: Average download bitrate per simulation time for each screen resolution over a shared link of capacity Cl= 30M bps
50 100 150 Simulation time (s) 0 1 2 3 4 QoE 426x240 640x360 854x480 1280x720 1920x1080
(a) The legacy DASH
50 100 150 Simulation time (s) 0 1 2 3 4 QoE 426x240 640x360 854x480 1280x720 1920x1080
(b) The QoE based DASH
Fig. 11: Average QoE per simulation time for each screen resolution
average number of stalls per screen resolution for both the legacy and the QoE based DASH. In Figure 13 we can make the same observation as with resolution switches, the QoE approach reduces the number of video stalls per screen resolution, making the video experience smoother and more satisfying for both small and large screens. At last, we plot in Figure 14 the average duration of stalls for the different screen resolutions considered. We include the duration of stalls as prior QoE studies give high interest to user engagement and ability to tolerate a certain duration of stalls before abandoning the video session. In general, the QoE based DASH is able to reduce the average duration of stalls which can be noticed for all screens, in particular, high screen resolutions.
50 100 150 Simulation time (s) 0.0 2.5 5.0 7.5 10.0 12.5 15.0 17.5 20.0
Number of resolution switches
426x240 640x360 854x480 1280x720 1920x1080
(a) The legacy DASH
50 100 150 Simulation time (s) 0.0 2.5 5.0 7.5 10.0 12.5 15.0 17.5 20.0
Number of resolution switches
426x240 640x360 854x480 1280x720 1920x1080
(b) The QoE based DASH
Fig. 12: Average number of resolution switches per simulation time for each screen resolution
B. Changing the backhaul capacity
From the above results, max-min screen based allocation seems to be an efficient allocation easy to implement and providing close gain to the optimal allocation. The latter strategy can be put in place, as modifications can be done at the dash.js to
50 100 150 Simulation time (s) 0 2 4 6 8 10 12 14 Number of stalls 426x240 640x360 854x480 1280x720 1920x1080
(a) The legacy DASH
50 100 150 Simulation time (s) 0 2 4 6 8 10 12 14 Number of stalls 426x240 640x360 854x480 1280x720 1920x1080
(b) The QoE based DASH
Fig. 13: Average number of video stalls per simulation time for each screen resolution
50 100 150 Simulation Time (s) 0 1 2 3 4 5 6 Stalls duration (s) 426x240 640x360 854x480 1280x720 1920x1080
(a) The legacy DASH
50 100 150 Simulation Time (s) 0 1 2 3 4 5 6 Stalls duration (s) 426x240 640x360 854x480 1280x720 1920x1080
(b) The QoE based DASH
Fig. 14: Average duration of video stalls per simulation time for each screen resolution
limit the maximum downloadable video representation to the maximum screen capacity. However, we expect such allocation to deviate from the optimal when the stress on the backhaul link increases (either more traffic or less bandwidth). Indeed, for more congested scenarios, the fair share of bandwidth of a flow of some screen resolution s becomes likely less than the maximum bitrate for that resolution BM,s, which makes the limit on the bitrate driven by the screen resolution less effective.
We expect therefore max-min screen based to be closer to max-min fair and farther from optimal. To illustrate this observation, we redo the above ns-3 simulations this time using a shared capacity of Cl= 10M bps while maintaining the delay to 6ms.
Figure 15 shows the total QoE for the two cases: (a) Cl = 30M bps and (b) Cl = 10M bps, and this is for the different
allocation strategies. In addition, we show 90% confidence intervals for the observed results. In both cases, QoE based DASH outperforms the other implementations achieving higher overall QoE. However, for limited backhaul capacity (Figure 15(b)) and as expected, screen based DASH gives approximately same results as legacy DASH. The results confirm our intuition that allocating based on QoE always helps shaping boundaries of bandwidth space and improving overall QoE regardless of the available capacity, which is not the case of the other two allocations.
50 100 150 Simulation time (s) 3.25 3.30 3.35 3.40 3.45 3.50 Average QoE
QoE based DASH Screen based DASH Legacy DASH
(a) Average overall QoE for Cl= 30M bps
50 100 150 Simulation time (s) 1.7 1.8 1.9 2.0 2.1 2.2 Average QoE
QoE based DASH Screen based DASH Legacy DASH
(b) Average overall QoE for Cl= 10M bps
VII. DISCUSSION
In this paper, we propose and evaluate a framework for optimal allocation of network resources tailored to video streaming applications that allows to maximize the sum of Quality of Experience over all users. The particularity of our framework is that it leverages the heterogeneity of screen resolutions to redistribute the network resources, the bandwidth in particular, in a more social way. We carried out an evaluation of our framework both numerically and with ns-3 simulations. Up to now, the optimal allocation was obtained by solving analytically the optimization problem using the heuristic we proposed to this end. For the ns-3 simulations, we proposed an implementation of the optimal solution that upper limits the subset of video representations visible at the player based on the allocation derived from the optimization problem.
In a real scenario where network traffic is dynamic, and where network resources are not necessarily known beforehand, we would like to reach a level where the network and/or video flows know by themselves their fair share of the available network resources and limit themselves to this fair share. Differently speaking, we seek a distributed implementation of our optimal framework. Such distributed implementation cannot be unfortunately done without the collaboration of the network, as it is the only entity that knows about the actual situation of the traffic and that can send a clear feedback to video clients and video servers. The information about the screen size or the viewport is available at the player, it has to be communicated somehow to the network and the video server on the other side to shape the video streaming traffic. We discuss next our idea about this implementation. As shown in the problem formulation and the proposed solution, the optimal is the state that equalizes the first degree gradient of all QoE functions. We can thus leverage this property of the optimal solution and imagine a scenario where gradients are transformed into traffic priority, and the network is instructed to treat the video traffic differently based on this priority, in a way to reach equilibrium between the different video flows where their priorities are steared to be equal. By an appropriate binning of the QoE function derivative, we can thus reach levels of QoE that can be used by the network to penalize clients that are already in low derivative regions meaning they are already having a high QoE. We give priority to clients with high QoE derivative, shifting them up in terms of QoE level. This way, one can see the QoE first order derivative as the marginal gain in terms of QoE for every additional unit of resources allocated to a video flow. The network will help those with high potential gain compared to those with low potential gain, knowing that if a video flow is helped by the network, it will increase its throughput thanks to DASH and TCP, and will then move to a low priority region. Overall, this action will lead to a regime where first derivatives, a.k.a. marginal gains, oscillate around the same value, which is the stable regime we are looking at.
According to our idea, the action taken by the network can be based on the priority tags carried in the IP packet header. The TOS field of the IP header can be used for this purpose. An efficient way of tagging could be done at the server level where the distribution of users and screen resolutions can be tracked in an online fashion and so no changes are needed from the client side. Once the server gets the chunk request for some resolution, it labels packets by leveraging the chunk resolution requested, the history of past chunks delivered and the QoE function corresponding to the screen resolution at the client. Labelling could be done by the client as well, but it has to be echoed back by the server, as it has to be carried by data packets in the direction server to client. Now at the network level, packets can be intercepted and treated according to priority tags by means of mechanisms such as weighted RED [34], in this case low priority packets will be more affected by the packet drop which latter can be interpreted by the client as a sign of congestion, making it requesting lower chunk resolutions thanks to the closed loop of DASH and TCP. We are currently exploring this venue and studying in particular the interaction between the different control levels that are involved in it. We believe it has sound as a possible implementation of our QoE driven optimization framework.
VIII. CONCLUSIONS
In this paper, we study the problem of bandwidth allocation for multiple video streaming sessions over a shared link. The goal is to maximize the average QoE (Quality of Experience) by leveraging screen resolution. In a first place, we revisit previous studies, able to link either video bitrate [8] or throughput [10] to QoE level for a given screen resolution. We then formulate an optimization problem trying to maximize the overall QoE under linear constraints. To that aim, we propose a Lagrangian based solution to approximate the optimal allocation. Later, we show through numerical and network simulations how leveraging screen characteristics leads to overall QoE improvement in the context of a QoE driven bandwidth allocation framework. In addition, accounting for screen resolution reduces both switches and interruptions over a watching session. Finally, we start a discussion on a more general implementation that leverages the collaboration between the client, the server and the network, the idea is to drop packets within the network based on packet priority labels derived using gradients of the QoE as estimated at the clients.
REFERENCES
[1] Ericsson, “Mobility report.” https://www.ericsson.com/assets/local/mobility-report/documents/2018/ericsson-mobility-report-june-2018.pdf, accessed 2020.
[2] Statcounter, “Mobile market share.” http://gs.statcounter.com/vendor-market-share/mobile, accessed 2020.
[3] M. Polese and M. Giordani and M. Mezzavilla and S. Rangan and M. Zorzi, “Improved handover through dual connectivity in 5g mmwave mobile networks,” IEEE Journal on Selected Areas in Communications, 2017.
[4] M. Giordani and M. Mezzavilla and S. Rangan and M. Zorzi, “Multi-connectivity in 5g mmwave cellular networks,” Mediterranean Ad Hoc Networking Workshop, 2016.
[5] A. Elmnsi and N. Osman and I. Mkwawa, “The impact of mobile device preference on the quality of experience,” International Journal of Computing Information Sciences, 2016.
[6] O. Belmoukadam and T. Spetebroot and C. Barakat, “Acqua: A user friendly platform for lightweight network monitoring and qoe forecasting,” 22nd Conference on Innovation in Clouds, Internet and Networks and Workshops (ICIN), 2019.
[7] M. Khokhar and N. Saber and T. Spetebroot and C. Barakat, “An intelligent sampling framework for controlled experimentation and qoe modeling,” Computer Networks, 2018.
[8] G. Cermak and M. Pinson and S. Wolf, “The relationship among video quality, screen resolution, and bit rate,” IEEE Transactions on Broadcasting, 2011.
[9] T. Stokhammer, “Dynamic adaptive streaming over http – design principles and standards,” ACM MMSys, 2011.
[10] M. Khokhar and T. Ehlinger and C. Barakat, “From network traffic measurements to qoe for internet video,” IFIP Networking, 2019. [11] ns3, “network simulation.” http://www.nsnam.org, accessed 2020.
[12] G. Tian and Y. Liu, “Towards agile and smooth video adaptation in dynamic http streaming,” ACM CoNEXT, 2012.
[13] D.J. Vergados and A. Michalas and A. Sgora and D.D. Vergados and P. Chatzimisios, “Fdash: A fuzzy-based mpeg/dash adaptation algorithm,” IEEE Systems Journal, 2016.
[14] R. Matos and N. Coutinho and C. Marques and S. Sargento and J. Chakareski and A. Kassler, “Quality of experience-based routing in multi-service wireless mesh networks,” IEEE ICC, 2012.
[15] S. Laga and T.V. Cleemput and F.V. Raemdonck and F. Vanhoutte and N. Bouten and M. Claeys and and F. D. Turck, “Optimizing scalable video delivery throughopenflow layer-based routing,” IEEE NOMS, 2014.
[16] H. Mao and R. Netravali and M. Alizadeh, “Neural adaptive video streaming with pensieve,,” ACM SIGCOMM, 2017.
[17] P.T.A. Quang and K. Piamrat and K.D. Singh and C. Viho, “Videostreaming over ad hoc networks: A qoe-based optimal routing solution,” IEEE Transactions on Vehicular Technology, 2017.
[18] G. Calvigioni and R. Aparicio-Pardo and L. Sassatelli and J. Leguay and P. Medagliani and S. Paris, “Quality of experience-based routing of video traffic for overlay and isp networks,” IEEE INFOCOM - IEEE Conference on Computer Communications, 2018.
[19] P. Georgopoulos and Y. Elkhatib and M. Broadbent and M. Mu and N. Race, “Towards network-wide qoe fairness using openflow-assisted adaptive video streaming,” ACM SIGCOMM Workshop on Future human-centric multimedia networking, 2013.
[20] S. Petrangeli and T. Wauters and R. Huysegems and T. Bostoen and F. De Turck, “Software-defined network-based prioritization to avoid video freezes in http adaptive streaming,” International Journal of Network Management, 2016.
[21] A. Bentaleb and A.C. Begen and R. Zimmermann, “Sdndash: Improving qoe of http adaptive streaming using software defined networking,” ACM Multimedia, 2016.
[22] J.W. Kleinrouweler and B. Meixner and P. Cesar, “Improving video quality in crowded networks using a dane,” ACM NOSSADAV, 2017.
[23] S. DAronco and L. Toni and P. Frossard, “Price-based controller for quality-fair http adaptive streaming,,” IEEE International Symposium on Multimedia, 2016.
[24] R.R. Pastrana-Vidal and J.C. Gicquel and C. Colomes and H. Cherifi, “Sporadic frame dropping impact on quality perception,” Human Vision and Electronic Imaging IX, 2004.
[25] Y. Qi and M. Dai, “The effect of frame freezing and frame skipping on video quality,” International Conference on International Information Hiding and Multimedia Signal Processing, 2006.
[26] A.K. Moorthy and L.K. Choi and A.C. Bovik and G. De Veciana, “Video quality assessment on mobile devices: Subjective, behavioral and objective studies,,” IEEE Journal of Selected Topics in Signal Processing, 2012.
[27] A. Asan and W. Robitza and I. Mkwawa and L. Sun, E. Ifeachor and A. Raake, “Impact of video resolution changes on qoe for adaptive video streaming,” IEEE International Conference on Multimedia and Expo, 2017.
[28] Python, “Curve fit evaluation.” https://scikit-learn.org/stable/modules/modelevaluation.html, accessed 2020.
[29] Python, “Sequential least squares.” https://docs.scipy.org/doc/scipy-0.18.1/reference/optimize.minimize-slsqp.htmloptimize-minimize-slsqp, accessed 2020.
[30] IBM, “Cplex.” https://www.ibm.com/products/ilog-cplex-optimization-studio, accessed 2020.
[31] DeviceAtlas, “The mobile web intelligence.” https://discover.deviceatlas.com/1145767/thank-you/, accessed 2020.
[32] D.J. Vergados and A. Michalas and A. Sgora, “A control-based algorithm for rate adaption in mpeg-dash,” 5th International on Information, Intelligence, Systems and Applications, 2014.
[33] “Video traces.” http://www-itec.uni-klu.ac.at/ftp/datasets/DASHDataset2014/ElephantsDream/, accessed 2020. [34] IETF, “Weighted random early detection(wred).” https://tools.ietf.org/html/rfc2309, accessed 2020.
AUTHORBIOGRAPHY
Othmane Belmoukadam is 2nd year PhD student at University Cˆote d’Azur (UCA) and Inria, France. He got an engineering degree in telecommunications and information technologies from the national institute of posts and telecommunication in Rabat, Morocco, along with an international computer science master degree in ubiquitous networking from the university of Cˆote d’Azur, France, in 2018. His main research interests are in content management in the Internet, QoE driven resource allocation and caching, modeling user quality of experience and machine learning.
Muhammad Jawad Khokhar He received his PhD in Computer Science from the University of Cˆote d’Azur (UCA) and Inria, France, in 2019, and his Masters and Bachelors degree in Electrical Engineering from the National University of Sciences and Technology (NUST), Islamabad, Pakistan, in 2012 and 2010 respectively. His main research interests are in Internet measurements and traffic analysis, user quality of experience and machine learning.
Chadi Barakat is Senior Research Scientist in the Diana project-team at Inria, Sophia Antipolis Research Centre, since March 2002. He got his Ph.D. and HDR degrees in Computer Sciences from the University of Nice Sophia Antipolis in 2001 and 2009, respectively. Chadi Barakat was general chair for ACM CoNEXT 2012, PAM 2004 and WiOpt 2005 workshops, guest editor for a JSAC special issue on sampling the Internet, area editor for the ACM CCR journal and is currently on the editorial board of Elsevier Computer Networks. He served in the program committees of many international conferences as CoNEXT, Infocom, IMC, ICNP, and PAM. His main research interests are in Internet measurements and network data analytics, user quality of experience, and mobile wireless networking. Chadi Barakat is senior member of the IEEE and of the ACM.
![Fig. 1: Mobile traffic by application category CAGR 2016-2022, source [1]](https://thumb-eu.123doks.com/thumbv2/123doknet/13627564.426177/2.918.342.592.669.895/fig-mobile-traffic-application-category-cagr-source.webp)
![Fig. 5: Fitting QoE function (1) using video quality expert group data [8]](https://thumb-eu.123doks.com/thumbv2/123doknet/13627564.426177/6.918.326.596.548.736/fig-fitting-function-using-video-quality-expert-group.webp)
![Fig. 6: Comparison of allocation strategies with uniform screen probabilities (dataset of [8])](https://thumb-eu.123doks.com/thumbv2/123doknet/13627564.426177/9.918.163.759.611.822/fig-comparison-allocation-strategies-uniform-screen-probabilities-dataset.webp)
![Fig. 7: Comparison of allocation strategies with different screen size distributions (dataset of [8])](https://thumb-eu.123doks.com/thumbv2/123doknet/13627564.426177/10.918.153.760.81.511/fig-comparison-allocation-strategies-different-screen-distributions-dataset.webp)
![Fig. 8: Comparison of allocation strategies with different screen size distributions (dataset of [10])](https://thumb-eu.123doks.com/thumbv2/123doknet/13627564.426177/11.918.166.756.80.505/fig-comparison-allocation-strategies-different-screen-distributions-dataset.webp)
![Fig. 9: Comparison of allocation strategies with uniform screen probabilities and linear QoE function (dataset of [8])](https://thumb-eu.123doks.com/thumbv2/123doknet/13627564.426177/12.918.164.757.84.299/comparison-allocation-strategies-uniform-screen-probabilities-function-dataset.webp)