HAL Id: hal-03075337
https://hal.archives-ouvertes.fr/hal-03075337
Submitted on 16 Dec 2020
HAL is a multi-disciplinary open access
archive for the deposit and dissemination of
sci-entific research documents, whether they are
pub-lished or not. The documents may come from
teaching and research institutions in France or
abroad, or from public or private research centers.
L’archive ouverte pluridisciplinaire HAL, est
destinée au dépôt et à la diffusion de documents
scientifiques de niveau recherche, publiés ou non,
émanant des établissements d’enseignement et de
recherche français ou étrangers, des laboratoires
publics ou privés.
semiconductors coupled to silicon nanoantennas
Jean-Marie Poumirol, Ioannis Paradisanos, Shivangi Shree, Gonzague Agez,
Xavier Marie, Cédric Robert, Nicolas Mallet, Peter Wiecha, Guilhem Larrieu,
Vincent Larrey, et al.
To cite this version:
Jean-Marie Poumirol, Ioannis Paradisanos, Shivangi Shree, Gonzague Agez, Xavier Marie, et al..
Unveiling the optical emission channels of monolayer semiconductors coupled to silicon
nanoanten-nas. ACS photonics, American Chemical Society„ 2020, 7 (11), pp.3106-3115.
�10.1021/acsphoton-ics.0c01175�. �hal-03075337�
coupled to silicon nanoantennas
Jean-Marie Poumirol1, Ioannis Paradisanos2, Shivangi Shree2, Gonzague Agez1, Xavier Marie2,
C´edric Robert2, Nicolas Mallet3, Peter R. Wiecha3, Guilhem Larrieu3, Vincent Larrey4, Frank Fournel4,
Kenji Watanabe5, Takashi Taniguchi6, Aur´elien Cuche1, Vincent Paillard1,∗ and Bernhard Urbaszek2†
1
CEMES-CNRS, Universit´e de Toulouse, CNRS, UPS, Toulouse, France
2LPCNO, Universit´e de Toulouse, INSA-CNRS-UPS, 135 Avenue Rangueil, 31077 Toulouse, France 3
LAAS-CNRS, Universit´e de Toulouse, CNRS, Toulouse, France
4
CEA-LETI, Universit´e Grenoble-Alpes, Minatec Campus, Grenoble, France
5Research Center for Functional Materials, National Institute for Materials Science, Ibaraki, Japan and 6
International Center for Materials Anorthite, National Institute for Materials Science, Ibaraki, Japan.
Abstract.— Monolayers (MLs) of transition metal dichalcogenides (TMDs) such as WSe2 and
MoSe2 can be placed by dry stamping directly on broadband dielectric resonators, which have the
ability to enhance the spontaneous emission rate and brightness of solid-state emitters at room temperature. We show strongly enhanced emission and directivity modifications in room temper-ature photoluminescence mapping experiments. By varying TMD material (WSe2 versus MoSe2)
transferred on silicon nanoresonators with various designs (planarized versus non-planarized), we experimentally separate the different physical mechanisms that govern the global light emission en-hancement. For WSe2 and MoSe2 we address the effects of Mie Resonances and strain in the
mono-layer. For WSe2an important additional contribution comes from out-of-plane exciton dipoles. This
paves the way for more targeted designs of TMD -Si nanoresonator structures for room temperature applications.
Introduction.— Integrated efficient quantum light sources need to be developed for different applications including quantum computing and transmitted or stored
information for cryptography. Key technologies are
plasmonic or dielectric nanostructures (NS) coupled to various quantum emitters positioned in the NS near-field. Both the emitting dipole position and orientation with respect to the nanoantenna are important to optimize the emission rate and the emitted light directivity and waveguiding. Therefore, monolayers of semiconducting
transition metal dichalcogenides (TMDs) [1, 2] such as
WSe2 and also heterobilayers [3] are very promising
as an active medium. Their atomic-monolayer
thick-ness makes them uniformly sensitive to the near field around a nanoantenna, and they host several kinds of emitting dipoles at different wavelengths, such as the
bright exciton (Xo, dipole in the monolayer plane), the
so-called dark exciton (XD, dipole out-of-plane) and
other identified complexes such as charged excitons,
localized excitons and biexcitons [4–6]. TMDs coupled
to plasmonic NS have shown strongly enhanced emission
and tailored directivity [7–9]. However, plasmonics is
limited by high losses in metals, heating and incompat-ibility with complementary-metal-oxide-semiconductor
(CMOS) fabrication processes [10]. High refractive index
dielectric NS such as silicon-NS or GaP-NS [11–13], can
also provide reduced mode volumes, but in contrast to plasmonics they show low non-radiative losses and are compatible with large-scale semiconductor fabrication
∗vincent.paillard@cemes.fr †urbaszek@insa-toulouse.fr
processes [14,15]. The emission properties of excitons in
TMDs placed on NS have been investigated for several combinations of NS geometry and TMD materials
[12, 13, 16–21]. Despite these promising first results,
the physical mechanisms that govern changes in the TMD emission as they are placed in proximity of the nanoresonators need to be understood. In addition to the targeted modification of the local electric field due to the resonator, several other mechanisms such as strong
local strain induced by the resonator [22] and changing
optical dipole orientation with respect to the detection contribute to brightening and change in directivity of the emission.
In this work, we experimentally separate the three main mechanisms that govern the photoluminescence emission properties of the coupled dielectric NS-TMD monolayer system at room temperature, namely (i) interactions with broad-band Mie resonances, (ii) strain in the TMD layer and (iii) orientation of the exciton dipole with respect to the detection. First, we address the impact of the dipole orientation by comparing on identical non-planarised resonator samples (see dimer
resonators sketched in Fig. 1a) the emission of WSe2
(in-plane and out-of-plane dipoles) [4, 5, 23] with
MoSe2 (only in-plane emission) [24, 25]. For WSe2
we show a brightening of the global emission by one order of magnitude on the NS. This is accompanied by a change in overall spectral shape, due to a variation of the relative contributions to the emission from the in-plane and out-of-plane dipoles, which emit at slightly different energies. In the PL mapping, we find a strong dependence of the spectral shape on detection spot position on the NS (edge/center/suspended region). Second, we address the impact of strain as we
com-pare TMD monolayer emission from samples on Si nanostructures (height about 100 nm) with samples on the same Si nanostructures surrounded by silica (planarized samples), where the TMD is strain free,
compare Figs. 1c and e. We measure in non-planarized
samples a clear redshift of the PL energy (correlated to the TMD phonon shift measured in Raman mapping), showing the contribution to enhanced emission of the
tensile strain-induced band gap lowering. Strained
MoSe2behaves differently compared to WSe2: although
we see a PL energy redshift due to strain, the spectra consist only of a main, single peak corresponding to the
in-plane dipole in MoSe2(bright exciton). On planarized
samples we observe WSe2 and MoSe2 emission with less
PL intensity enhancement (50%) as compared to the strained case, but with a clear impact of NS geometry on the PL emission pattern and dependence on the excitation laser polarization. Our experiments show an enhanced brightness for all NS-TMD configurations as compared to the TMD alone, so the Si-NS is beneficial in all cases.
Samples and optical spectroscopy techniques.— In this section we describe the two different kinds of
nanoresonators used, which show broad resonances
covering the wavelength region that corresponds to the
MoSe2 and WSe2 monolayer emission and excitation.
Si-NS are obtained by a top-down approach in a Silicon on Insulator (SOI) wafer, where a hydrogen silsesquioxane (HSQ) resist is patterned by electron beam lithography followed by reactive ion etching. The thickness of the single crystal overlayer which determines the Si-NS height is H =90 nm. After etching
and annealing, a SiO2 layer (from the HSQ deposition)
of about 20 nm is left on top of the Si-NS. We will focus on dimers consisting of two nanorods of rectangular cross section having dimensions of L × W × H and
separated by a gap G (Fig. 1c). Values of L and G are
varying across the resonator array from 50 to 300 nm,
for constant W =150nm and H =90 nm. An array of
fabricated structures can be seen in Fig. 1b. Before
TMD monolayer transfer, we perform dark-field scat-tering experiments to probe the optical Mie resonance
bandwidth of the different dimers [10,14,15]. A typical
dark-field spectrum is shown in Fig. 1h, where the
measured resonances extend up to the relevant exciton transitions in the TMDs. As it can already be seen in
Fig.1g by the different colors, the characteristics of the
Mie resonances can be varied by changing L, W and G [11].
Flakes from TMD bulk crystals are obtained by
multiple folding in adhesive tape. The adhesive tape
with the flakes of various thicknesses is pressed against a transparent polymer stamp, here PDMS, to transfer the flakes. Monolayers on the PDMS stamp are identified by
optical contrast (confirmed by AFM). As a last step [26],
the desired WSe2 or MoSe2 monolayer is placed above
the targeted nano-resonator array and then transferred on the patterned substrate, covering 30 Si-NS with
the same flake in Fig. 1b. An atomic force microscope
(AFM) profile in Fig. 1d shows that the WSe2 ML
is acting as a nearly conformal coating, following the
Si-NS morphology. These samples are referred to as
non-planarized and will be used to investigate the im-pact of strain and dipole orientation on the PL emission
(Fig.1c).
In order to eliminate strain effects and focus solely on the impact of the Si antenna on the TMD emission, another set of samples was fabricated. We followed the same fabrication procedure as for the non-planarized Si-NS and added a planarization step involving HSQ deposition and subsequent annealing and chemical
etching [27]. This leads to Si nanoantennas buried
in silica and we refer to this as planarized samples,
see Fig. 1e. The distance between the top Si-NS and
the silica smooth surface (see AFM profile Fig. 1f) is
about 30 nm over 1 µm. Although the surface is not totally flat, the height variations are smooth enough to avoid strain in the TMD, as confirmed in PL and Raman mappings (see below). The active region is here protected by a 10 nm-thick hexagonal BN layer (high
crystal quality, atomically flat [28]) on top of the TMD
ML.
Room temperature photoluminescence and Raman experiments are performed using either a Horiba JY Labram HR or a Horiba JY XPlora MV2000 set-up. Hyper-spectral maps are obtained by raster scanning the sample under a laser spot (532 nm excitation wave-length, power of tens of nW) tightly focused through a microscope objective (0.9 numerical aperture - NA). The spectra are obtained in backscattering using the
same objective. The high NA allows us to collect
mainly emission from in-plane but also to a small extent
from out-of plane optical dipoles [5, 29]. Although the
diffraction limited spot has a diameter comparable to the dimer, the recorded PL emission map of the sample reveals fine details in lateral resolution due to the high
signal to noise ratio. The laser polarization is kept
constant and the so-called x (linear polarization along the dimer axis) and y polarization (linear polarization perpendicular the dimer axis) are obtained by rotating
the sample by 90◦. Here we define as the dimer axis
a straight line across the dimer gap that connects the centers of the two Si rectangles.
WSe2 monolayer on non-planarized
nanoresonators.— In Fig. 2a we plot a
normal-ized, spectrally integrated PL map of non-planarized
nanoresonators covered by one large WSe2 monolayer.
The nanoresonator positions can be seen directly on the map, PL away from the resonators is very weak (uniform dark blue area). To allow for a direct comparison of the
results in Figs.2, 3,4we show spectra from the Si dimer
nanoresonator with the same dimensions in all cases of gap G = 300 nm and length L = 300 nm (white circle
in Figs. 2a and g, 3a). This dimer has broad optical
excitation energy (See Fig. 1h). Strain will clearly play an important role for non-planarized nanoresonators and similar structures are used to generate localized excitons (0D) at low temperature for quantum optics
[30, 31]. Note that we avoid exciton localization in our
room temperature measurements as the thermal energy of excitons is larger than the localization energy.
In our experiment in Fig. 2a the excitation laser is
polarized along the main axis of the dimer (x), Fig.
2g shows identical measurements, but carried out with
laser polarization perpendicular to the dimer (y) (white arrows indicating the electric field in the figures).
We first comment on x-polarized excitation. The
WSe2 PL intensity is substantially enhanced by one
order of magnitude on top of the nanoresonators. In
addition to intensity changes, we clearly observe that the spectra recorded on top and next to the nanoresonator
shown in Fig. 2b are very different, compare panels Fig.
2c,d and e. The PL emission is fitted using three peaks,
in agreement with the different transitions identified in
the literature for WSe2 ML even at room temperature :
the free exciton at about 1.66 eV (745 nm) (dashed blue line), the charged excitons (trions) (dashed green line) at about 1.64 eV (756 nm), and the dark (out-of-plane)
exciton near 1.61 eV (770 nm) (dashed red line) [4,5,23].
Please note that we have identified the respective dipole orientation of the dark and bright excitons previously by imaging the Fourier plane of the microscope objective
in experiments on ML WSe2 [5]. The relative weight of
the different peaks strongly varies as a function of the position along the map, especially around and above the
Si-NS (see Fig.2f top panel).
The impact of strain on the optical transitions is
revealed in Fig. 2f bottom panel, where we plot the
emission energy of the three PL components as a function of position. A shift of the PL emission to lower energy for all three transitions is a clear confirmation
for tensile strain in the layer [32]. The same conclusion
can be independently drawn from the Raman maps, presented in the supplement. The enhancement observed for emission on the nanoresonators benefits therefore from the combined effect of strain (local lowering of the band gap that results in funneling of excitons) and optical resonances, which we aim to separate in the
next section. Interestingly, as one can see in Fig. 2 (f)
top panel, the emission linked to the dark exciton (red line), which has an optical dipole out-of the monolayer plane, shows strongest enhancement on the sample edges. Here we suggest that, as the monolayer is folded
with respect to the microscope objective axis (by 30◦ to
40◦, as given by AFM profile), more light emitted by
the out-of-plane dipole is detected. These arguments
are developed in more detail in the discussion section. In addition, enhanced emission from excitons with out-of-plane dipoles might be due to lowering of the
crystal symmetry [30, 33]. The impact of strain for
WSe2 MLs on GaP dimers is discussed in references
[13,22].
In Fig. 2g we plot the same intensity map as in
Fig. 2a, but the excitation laser polarization is now
perpendicular to the dimer axis. We observe clear
differences: the global enhancement on the NS is now a factor of 3, as compared to roughly 8 for the other laser polarization, and the spatial region around the
NS position that shows enhancement is smaller. The
maximum enhancement is localized in the gap between the two rectangular rods constituting the dimer, as can
be seen in Fig. 2h. In the dimer gap the monolayer is
suspended, and therefore presumably less strained than on the dimer edges. As a result, the PL emission energy does not change as a function of position as we scan
across the gap, see Fig.2l bottom panel.
Our measurements also show, in contrast to laser excitation parallel to the dimer axis, the global shape of the PL spectra is not affected in the perpendicular
case (Fig.2i,j,k). The relative amplitude of the different
PL components remains constant when scanning over
an antenna (Fig. 2l top panel). We suggest in the
discussion section below, that this striking dependence
on laser excitation polarization (compare Figs.2a,b with
Figs.2g,h) is linked to an optical antenna effect.
MoSe2 monolayer on non-planarized
nanoresonators.— For WSe2 we observe on
sev-eral Si-NS dimers a strong PL intensity enhancement above each element of the dimer, showing amplification as high as 8 as compared to the bare monolayer. We
now investigate emission from a MoSe2 monolayer
deposited on an identical set of resonators, see Fig.3a.
We choose this material for comparison as the emission
wavelength is close to WSe2 and can be covered by
the broadband resonances of the Si-NS as shown in
Fig.1. An additional advantage for this material is the
comparatively simple emission spectrum as the dark, z-polarized states (optical dipole out-of-plane) are in
energy above the bright states [24, 25] and therefore
have only very small impact on PL emission here, see
spectra in Fig.3d and scheme in Fig.5a.
In Fig. 3a we plot the PL emission map above the
resonators and we see strong PL emission enhanceme-ment (up to 14 ×) on several resonators covered by the ML flake. PL emission next to the resonators is weak
(uniform dark area in the map). The most striking
observations are: First, a strong enhancement of the
PL emission intensity above the Si-NS, see Fig. 3b.
Second, in contrast to our WSe2results, the PL emission
for MoSe2 does not change shape, as can be seen in
Fig.3d. The PL band could be fitted using a single peak
attributed to the neutral bright exciton. Thus, the red
shift of the PL energy shown in Fig.3c is deduced from
the maximum of the measured PL peak. As in the case
of WSe2, this is a signature of tensile strain but resulting
in a smaller energy shift, in qualitative agreement with
previous studies on strain tuning [34]. Although due to
the manual stamping method the coupling efficiency of the TMD monolayer might not be uniform across the
nanoresonator array, we observe for the investigated
MoSe2 monolayer very similar enhancement for several
nanoresonators analyzed, as can be seen in the map in
Fig.3a. Interestingly for dimers with narrower gaps two
emission lobes appear, which might be due to an antenna effect that redirects the light at the dimer edge towards our microscope objective. The simple PL shape makes
MoSe2 a suitable material for analyzing more complex
effects related to Mie resonances, that might be obscured
by the multiple transitions in WSe2. Please note that
MoSe2monolayers have in general comparatively weaker
emission than WSe2 monolayers at room temperature
[35–37] and hence a wider margin for increasing emission
efficiency.
Concerning the dependence on laser excitation
polar-ization for MoSe2 we observe a stronger emission for
excitation along the dimer axis than perpendicular to it. The difference is about 15 %, see supplement, much
less pronounced than for the WSe2 case, which suggests
that the contributions from out-of-plane dipole emission plays an important role for the strong polarization
difference observed in WSe2. Note that we analyze
for both materials the same nanoresonators with the
same optical resonances (as shown in Fig.1h), so major
differences in our comparative studies between MoSe2
and WSe2 emission have their origin in the different
bandstructure, sketched in Fig.5a.
Strain free WSe2 monolayer on planarized
nanoresonators.— In the case of the planarized samples, neither strain-induced Raman shifts of the TMD phonon can be detected (see supplement) nor a systematic redshift of the PL energy, as shown in our
measurements in Fig. 4c and f. The AFM profile in
Fig.1f shows that the maximum roughness above a Si-NS
is limited to about 30 nm extended over 1 µm. For this
strain-free WSe2monolayer on planarized resonators we
make the following observations: We record an increase of the PL of 50% due to the presence of Si-NS, this is less than the factor of about 8 achieved on the same
nanoresonator but non-planarized, compare Fig.2a and
Fig.4a. Interestingly, the overall emission spectrum for
the planarized sample of WSe2 does not change shape
but only the amplitude is modified by the antenna, see
Fig. 4b and e. The bright exciton contribution in the
PL band is the strongest peak according to our fits and the weight of the different contributions (dark and charged excitons) are constant when we scan across the
Si-NS. The PL maps in Fig. 4 are dependent on the
laser polarization for WSe2, compare panels Fig. 4a,c
with Fig. 4d,f. For y-polarized excitation we see a
maximum in PL signal over the dimer gap, see Fig.4d,f.
Our measurements show that the emission of WSe2 is
governed by an optical antenna effect in the planarized samples, whereas strain effects play a key role in the nonplanar samples, as pointed out in earlier work on
strain WSe2 on GaP dimers [13]. The measured PL
enhancement is up to 50% of the integrated intensity,
which can be further improved. Our measurements on
planarized MoSe2 samples gave very similar results.
In future experiments the Si-NS shape and dimensions can be optimized in order to reach higher electric field amplitudes. It is important to take into account that, after HSQ planarization and hBN deposition, the dielectric contrast between Si-NS and the surrounding is lower than for non-planarized resonators. This lowers light confinement and needs to be compensated by optimizing the antenna design.
Numerical simulations and discussion.— Our
measurements of the PL emission of ML WSe2 and
MoSe2 coupled to non-planarized and planarized
nanoresonators revealed for all cases an enhancement of the PL emission as compared to the bare monolayer. In the discussion below we suggest different mechanisms at the origin of this enhancement taking into account the polarization-dependent near field at the excitation energy and the interaction of dipole in-plane and out-of the ML plane with the Mie resonances of the dimer structures at the emission energy.
The Si-NS is optically resonant at the excitation
wavelength. We first simulate the spatial distribution
of the electric near-field intensity in the plane of the
TMD monolayer (see Fig. 5c) with the finite-difference
time-domain (FDTD) method [38], using an open-source
software package [39], see results in Fig. 5b. For laser
excitation parallel to the dimer axis our simulation shows a stronger near-field enhancement than in the case where the polarization is perpendicular to the dimer axis. The near-field enhancement is localized above and around
the Si blocks in the parallel polarization case. This
can be seen in particular along the edges (y-oriented)
perpendicular to the polarization. In contrast, there
is almost no enhancement for the perpendicular case (even lower field above each block of the Si dimer). This behavior, relevant at the laser excitation wavelength, is in qualitative agreement with the PL maps of the
chosen example described previously, compare Fig. 2a
and Fig.2g. This indicates that optical Mie resonances
contribute to PL enhancement. Nevertheless Mie
resonances alone cannot explain the differences in the enhancement and the polarization dependence observed
in the four configurations (ML WSe2 and ML MoSe2
on non-planarized and planarized Si-NS, respectively),
otherwise the observations for MoSe2 and WSe2 for the
polarization dependence would have been identical. To go further, we study the antenna effect induced by Si-NS on the emission of the two kinds of exciton
dipoles (the bright exciton Xo and the dark exciton
XD) [4, 5, 23]. In a first approximation we consider
a single oscillating dipole with orthogonal orientation
depending on the nature of the exciton (in-plane Xo
and out-of-plane XD - see Fig. 5a). Considering the
non-planarized and planarized geometries (Fig. 5c and
e), we compute the intensity of the electric field collected in backscattering geometry through the microscope
objective NA for several key locations of the emitting dipoles. The electric field radiated by the dipolar source in presence of a Si-NS is obtained by the Green Dyadic
Method [40] using the pyGDM toolkit for
electrody-namics simulations [41, 42]. In Fig. 5d-f are shown
the emission patterns of different dipoles emitting at 750 nm (approximately the average of the bright and dark exciton wavelengths). Depending on the position around the Si-NS, the dipole represents either a dark exciton (out-of-plane dipole, black arrow) or a neutral exciton (in-plane, red arrow).
In the upper left part of Fig. 5d, we represent a dipole
marked by a black arrow which is located at one Si-NS edge, at mid-height (z= 55 nm) and oriented along the x-axis of the dimer. Now we need to take into account that our monolayer changes orientation : as represented
in Fig 5c, the TMD ML is nearly conformal to the
Si-NS i.e. following its shape. That means, at the outer dimer edges a dipole oriented along the x-axis of the dimer is oriented out of the folded monolayer plane.
Hence it can be considered as a dark exciton XD with a
dipole out of the TMD ML plane. For this dipole our calculations show that the intensity measured through the microscope objective NA (represented by the dotted circle) is very high. In contrast, the collected intensity originating from the dipole in the TMD plane at the
same position (represented by a red arrow in Fig. 5c)
is negligible. Indeed, the emission pattern (not shown) is oriented along the x-axis due to the combined effects of the dipole orientation parallel to the microscope axis
and the Si nanoantenna. These simulations give an
indication why the emission signal detected at the XD
energy is particularly strong at the dimer edges.
In contrast, if the dipole is positioned at mid-height of the long side of the nanoblock (upper right part of
Fig.5d), the collected intensity drops. We believe that
this antenna effect plays an important role in the increase
of the measured signal. It adds to the
polarization-dependent enhancement presented in Fig. 5b, which
leads to the creation of more excitons (including XD
ones) in the regions of high electric field. Thus, the
combination of these two fundamental mechanisms leads
to the boost in the PL enhancement observed for WSe2
on nonplanar Si-NS, only for a parallel polarization of the laser with respect to the Si dimer axis.
In the gap of the Si dimer (lower part of Fig. 5d),
the integrated intensity corresponding to XD emission is
approximately the same as the one due to Xo. Both are
contributing, thus leading again to the signal increase. Compared to the emission pattern of the dipole in a
TMD monolayer alone hosting XD(WSe2) (See Fig.5a),
it is clear that the relative contributions of XD and Xo
are very different as a function of the emitting dipole position in the case of the non-planar sample.
Our simple model is already sufficient to understand the underlying physics leading to the strong PL en-hancement when the TMD hosts out-of-plane excitons. For instance, since this cumulative effect mainly occurs
along the y-oriented edges (small side of a nanoblock) for a parallel polarization, it helps explaining the extension of the PL patterns along the x-axis well beyond the
dimer limits in the maps of Fig. 2. For the same
polarization configuration, it is also in good agreement with the PL band shape modification related to the strong enhancement of the fitted (red) peak associated
to XD at the y-oriented (outer) edges of the Si-NS in
the spectra of Fig.2.
On the other hand, for the planarized sample, the dark exciton contribution is always very minor and the PL band is dominated by the bright exciton contribution,
compare Fig. 4e and Fig. 2e. The radiation pattern
of the XD is weakly redirected by the antenna in the
angular window defined by the microscope objective NA, neither when it is positioned along the edges,
nor in the gap region (Fig. 5f). As a consequence, no
enhancement associated to the XD is expected. It is
in good agreement with the experimental observation where this dark exciton is intrinsically eliminated
(MoSe2 samples) or does experience no enhancement
(WSe2 on planarized samples). In both cases, the
polarization-dependent enhancement, resulting from a pure optical effect associated to the Mie resonances in these Si-NS, is about 50%, far from the roughly 10×
enhancement in PL from WSe2on nonplanar resonators.
We unveil here three intertwined mechanisms that
contribute to the PL enhancement. The Mie-assisted
enhancement of the dark exciton contribution plays therefore an important role in the global PL response of
the WSe2- resonator coupled systems. Interestingly, its
contribution seems to be of the same order of magnitude as the strain one. The amplitude of the latter can be
estimated with MoSe2 on non-planar samples. Indeed,
about 15 % variation of the PL is observed as the polar-ization is rotated, indicating a very strong contribution to the global factor PL enhancement (14 ×) originates from the strain generated by the Si nanoblocks in this sample.
Finally, as expected for non-optimized resonators, the pure optical effect associated to Mie resonances
observed in planarized samples in Fig. 4 (no strain, no
dark exciton) is relatively weak compared to the two other mechanisms. It should easily be further improved by optimizing the geometry of the nanoresonators.
In conclusion, we have shown strong PL
en-hancement for WSe2 and MoSe2 on non-planarized
nanoresonators due to the combined effect of amplifying contributions from out-of plane dipole emission, strain
and pure electric field amplification. On planarized
nanoresonators we show that the TMD monolayer is strain free and the PL emission is only enhanced by
the Mie resonances of the Si dimer. In addition to
presence and absence of strain in the active medium for non-planarized and planarized samples, respectively, also the dielectric contrast plays a role. For non-planarized resonators dielectric contrast is high, whereas it is lower for planarized samples, which demands further work on
planarization techniques such as the use of low refractive index dielectric around the silicon nanostructures, and a very small thickness to position the TMD as close as possible to the Si nanoantenna. Finally the optimization of the nanoantenna design will be essential to control strain, resonances at both the excitation and emission
wavelength, and directivity of the emitted light. WSe2
is a very promising material as the in-plane and out-of-plane exciton emission can be controlled independently
to increase the global emission yield. MoSe2 shows also
strong PL emission enhancement and a simple emission spectrum for targeted interaction with Mie resonances.
Acknowledgements.— LPCNO acknowledges fund-ing from ANR 2D-vdW-Spin, ANR MagicValley, ITN 4PHOTON No. 721394 and the Institut Universitaire de France. CEMES, LAAS, LETI and LPCNO acknowledge funding from ANR HiLight (ANR-19-CE24-0020-01). This study has been partially supported through the EUR grant NanoX 2D Light (ANR-17-EURE-0009) in the framework of the Programme des Investissements
d’Avenir and by the LAAS-CNRS micro and nanotech-nologies platform, a member of the French RENATECH
network. K.W. and T.T. acknowledge support from
the Elemental Strategy Initiative conducted by the MEXT, Japan , Grant Number JPMXP0112101001, JSPS KAKENHI Grant Number JP20H00354, and the
CREST, JST Grant Number JPMJCR15F3. CEMES
team acknowledges the CALMIP computing facility (grant P12167).
Supplementary Information.— The following file TMD-SiNSv11-Supplement.pdf as Supporting Informa-tion is available free of charge via the internet at
http://pubs.acs.org. The Supporting Information
in-cludes the Raman mapping of WSe2 monolayers
trans-ferred on non planarized (under strain) and planarized (strain free) nanoantennas. They are shown in Fig.S1 and Fig. S3, respectively. Fig. S2 presents the
pho-toluminescence mapping of a MoSe2 monolayer on non
planarizd nanoantenna as function of the excitation laser polarization.
[1] Mak, K. F.; Shan, J. Photonics and optoelectronics of 2D semiconductor transition metal dichalcogenides. Nature Photonics 2016, 10, 216–226.
[2] Wang, G.; Chernikov, A.; Glazov, M. M.; Heinz, T. F.; Marie, X.; Amand, T.; Urbaszek, B. Colloquium: Exci-tons in atomically thin transition metal dichalcogenides. Reviews of Modern Physics 2018, 90, 021001.
[3] Nagler, P.; Mooshammer, F.; Kunstmann, J.; Ballot-tin, M. V.; Mitioglu, A.; Chernikov, A.; Chaves, A.; Stein, F.; Paradiso, N.; Meier, S., et al. Interlayer Exci-tons in Transition-Metal Dichalcogenide Heterobilayers. physica status solidi (b) 2019, 256, 1900308.
[4] Zhou, Y.; Scuri, G.; Wild, D. S.; High, A. A.; Dibos, A.; Jauregui, L. A.; Shu, C.; De Greve, K.; Pistunova, K.; Joe, A. Y., et al. Probing dark excitons in atomically thin semiconductors via near-field coupling to surface plasmon polaritons. Nature nanotechnology 2017, 12, 856. [5] Wang, G.; Robert, C.; Glazov, M. M.; Cadiz, F.;
Cour-tade, E.; Amand, T.; Lagarde, D.; Taniguchi, T.; Watan-abe, K.; Urbaszek, B.; Marie, X. In-Plane Propagation of Light in Transition Metal Dichalcogenide Monolay-ers: Optical Selection Rules. Phys. Rev. Lett. 2017, 119, 047401.
[6] Barbone, M.; Montblanch, A. R.-P.; Kara, D. M.; Palacios-Berraquero, C.; Cadore, A. R.; De Fazio, D.; Pingault, B.; Mostaani, E.; Li, H.; Chen, B., et al. Charge-tuneable biexciton complexes in monolayer WSe 2. Nature communications 2018, 9, 1–6.
[7] Wang, Z.; Dong, Z.; Gu, Y.; Chang, Y.-H.; Zhang, L.; Li, L.-J.; Zhao, W.; Eda, G.; Zhang, W.; Grinblat, G., et al. Giant photoluminescence enhancement in tungsten-diselenide–gold plasmonic hybrid structures. Nature com-munications 2016, 7, 1–8.
[8] Kern, J.; Tr¨ugler, A.; Niehues, I.; Ewering, J.; Schmidt, R.; Schneider, R.; Najmaei, S.; George, A.; Zhang, J.; Lou, J., et al. Nanoantenna-enhanced light– matter interaction in atomically thin WS2. Acs Photonics
2015, 2, 1260–1265.
[9] Najmaei, S.; Mlayah, A.; Arbouet, A.; Girard, C.; Leotin, J.; Lou, J. Plasmonic pumping of excitonic pho-toluminescence in hybrid MoS2–Au nanostructures. Acs Nano 2014, 8, 12682–12689.
[10] Won, R. Into the ’Mie-tronic’ era. Nature Photonics 2019, 13, 585–587.
[11] Wiecha, P. R.; Arbouet, A.; Girard, C.; Lecestre, A.; Lar-rieu, G.; Paillard, V. Evolutionary multi-objective opti-mization of colour pixels based on dielectric nanoanten-nas. Nature nanotechnology 2017, 12, 163.
[12] Cihan, A. F.; Curto, A. G.; Raza, S.; Kik, P. G.; Brongersma, M. L. Silicon Mie resonators for highly di-rectional light emission from monolayer MoS 2. Nature Photonics 2018, 12, 284–290.
[13] Sortino, L.; Zotev, P.; Mignuzzi, S.; Cambiasso, J.; Schmidt, D.; Genco, A.; Aßmann, M.; Bayer, M.; Maier, S.; Sapienza, R., et al. Enhanced light-matter in-teraction in an atomically thin semiconductor coupled with dielectric nano-antennas. Nature communications 2019, 10, 1–8.
[14] Bidault, S.; Mivelle, M.; Bonod, N. Dielectric nanoanten-nas to manipulate solid-state light emission. Journal of Applied Physics 2019, 126, 094104.
[15] Kuznetsov, A. I.; Miroshnichenko, A. E.; Brongersma, M. L.; Kivshar, Y. S.; Luk’yanchuk, B. Optically resonant dielectric nanostructures. Science 2016, 354 .
[16] Zhang, X.; Choi, S.; Wang, D.; Naylor, C. H.; John-son, A. C.; Cubukcu, E. Unidirectional doubly enhanced MoS2 emission via photonic Fano resonances. Nano Let-ters 2017, 17, 6715–6720.
[17] Chen, H.; Nanz, S.; Abass, A.; Yan, J.; Gao, T.; Choi, D.-Y.; Kivshar, Y. S.; Rockstuhl, C.; Neshev, D. N. En-hanced directional emission from monolayer WSe2 inte-grated onto a multiresonant silicon-based photonic struc-ture. ACS Photonics 2017, 4, 3031–3038.
[18] Lee, Y.-C.; Tseng, Y.-C.; Chen, H.-L. Single type of nanocavity structure enhances light outcouplings from various two-dimensional materials by over 100-fold. ACS Photonics 2017, 4, 93–105.
[19] Duong, N. M. H.; Xu, Z.-Q.; Kianinia, M.; Su, R.; Liu, Z.; Kim, S.; Bradac, C.; Tran, T. T.; Wan, Y.; Li, L.-J., et al. Enhanced Emission from WSe2 Monolayers Coupled to Circular Bragg Gratings. ACS Photonics 2018, 5, 3950– 3955.
[20] Bucher, T.; Vaskin, A.; Mupparapu, R.; L¨ochner, F. J.; George, A.; Chong, K. E.; Fasold, S.; Neumann, C.; Choi, D.-Y.; Eilenberger, F., et al. Tailoring photolumi-nescence from MoS2 monolayers by Mie-resonant meta-surfaces. ACS Photonics 2019, 6, 1002–1009.
[21] Mupparapu, R.; Bucher, T.; Staude, I. Integration of two-dimensional transition metal dichalcogenides with Mie-resonant dielectric nanostructures. Advances in Physics: X 2020, 5, 1734083.
[22] Sortino, L.; Brooks, M.; Zotev, P. G.; Genco, A.; Cam-biasso, J.; Mignuzzi, S.; Maier, S. A.; Burkard, G.; Sapienza, R.; Tartakovskii, A. I. Dielectric Nanoanten-nas for Strain Engineering in Atomically Thin Two-Dimensional Semiconductors. 2020; https://doi.org/ 10.1021/acsphotonics.0c00294.
[23] Park, K.-D.; Jiang, T.; Clark, G.; Xu, X.; Raschke, M. B. Radiative control of dark excitons at room temperature by nano-optical antenna-tip Purcell effect. Nature nan-otechnology 2018, 13, 59–64.
[24] Lu, Z.; Rhodes, D.; Li, Z.; Van Tuan, D.; Jiang, Y.; Lud-wig, J.; Jiang, Z.; Lian, Z.; Shi, S.-F.; Hone, J., et al. Magnetic field mixing and splitting of bright and dark excitons in monolayer MoSe2. 2D Materials 2019, 7, 015017.
[25] Robert, C.; Han, B.; Kapuscinski, P.; Delhomme, A.; Faugeras, C.; Amand, T.; Molas, M.; Bartos, M.; Watan-abe, K.; Taniguchi, T., et al. Measurement of the Spin-Forbidden Dark Excitons in MoS2 and MoSe2 monolay-ers. arXiv preprint arXiv:2002.03877 2020,
[26] Castellanos-Gomez, A.; Buscema, M.; Molenaar, R.; Singh, V.; Janssen, L.; Van Der Zant, H. S.; Steele, G. A. Deterministic transfer of two-dimensional materials by all-dry viscoelastic stamping. 2D Materials 2014, 1, 011002.
[27] Guerfi, Y.; Doucet, J.-B.; Larrieu, G. Thin-dielectric-layer engineering for 3D nanostructure integration us-ing an innovative planarization approach. Nanotechnol-ogy 2015, 26, 425302.
[28] Taniguchi, T.; Watanabe, K. Synthesis of high-purity boron nitride single crystals under high pressure by us-ing Ba–BN solvent. Journal of crystal growth 2007, 303, 525–529.
[29] Brotons-Gisbert, M.; Proux, R.; Picard, R.; Andres-Penares, D.; Branny, A.; Molina-S´anchez, A.; S´ anchez-Royo, J. F.; Gerardot, B. D. Out-of-plane orientation of luminescent excitons in two-dimensional indium selenide. Nature communications 2019, 10, 1–10.
[30] Branny, A.; Kumar, S.; Proux, R.; Gerardot, B. D.
Deter-ministic strain-induced arrays of quantum emitters in a two-dimensional semiconductor. Nature communications 2017, 8, 1–7.
[31] Palacios-Berraquero, C.; Kara, D. M.; Montblanch, A. R.-P.; Barbone, M.; Latawiec, P.; Yoon, D.; Ott, A. K.; Loncar, M.; Ferrari, A. C.; Atat¨ure, M. Large-scale quantum-emitter arrays in atomically thin semiconduc-tors. Nature communications 2017, 8, 1–6.
[32] Schmidt, R.; Niehues, I.; Schneider, R.; Drueppel, M.; Deilmann, T.; Rohlfing, M.; De Vasconcellos, S. M.; Castellanos-Gomez, A.; Bratschitsch, R. Reversible uni-axial strain tuning in atomically thin WSe2. 2D Materials 2016, 3, 021011.
[33] Luo, Y.; Liu, N.; Kim, B.; Hone, J.; Strauf, S. Exciton dipole orientation of strain-induced quantum emitters in WSe2. Nano letters 2020,
[34] Island, J. O.; Kuc, A.; Diependaal, E. H.; Brats-chitsch, R.; Van Der Zant, H. S.; Heine, T.; Castellanos-Gomez, A. Precise and reversible band gap tuning in single-layer MoSe 2 by uniaxial strain. Nanoscale 2016, 8, 2589–2593.
[35] Wang, G.; Robert, C.; Suslu, A.; Chen, B.; Yang, S.; Alamdari, S.; Gerber, I. C.; Amand, T.; Marie, X.; Ton-gay, S., et al. Spin-orbit engineering in transition metal dichalcogenide alloy monolayers. Nature communications 2015, 6, 1–7.
[36] Withers, F.; Del Pozo-Zamudio, O.; Schwarz, S.; Duffer-wiel, S.; Walker, P.; Godde, T.; Rooney, A.; Gholinia, A.; Woods, C.; Blake, P., et al. WSe2 light-emitting tunnel-ing transistors with enhanced brightness at room tem-perature. Nano letters 2015, 15, 8223–8228.
[37] Zhang, X.-X.; You, Y.; Zhao, S. Y. F.; Heinz, T. F. Ex-perimental evidence for dark excitons in monolayer WSe 2. Physical review letters 2015, 115, 257403.
[38] Taflove, A.; Hagness, S. C. Computational electrodynam-ics: the finite-difference time-domain method, 3rd ed.; Artech House antennas and propagation library; Artech House: Boston, Mass., 2010; OCLC: 838516123.
[39] Oskooi, A. F.; Roundy, D.; Ibanescu, M.; Bermel, P.; Joannopoulos, J.; Johnson, S. G. Meep: A flexible free-software package for electromagnetic simulations by the FDTD method. Computer Physics Communications 2010, 181, 687–702.
[40] Girard, C. Near fields in nanostructures. Reports on Progress in Physics 2005, 68, 1883–1933.
[41] Wiecha, P. R. pyGDM—A python toolkit for full-field electro-dynamical simulations and evolutionary op-timization of nanostructures. Computer Physics Commu-nications 2018, 233, 167–192.
[42] Wiecha, P. R.; Majorel, C.; Girard, C.; Arbouet, A.; Masenelli, B.; Boisron, O.; Lecestre, A.; Larrieu, G.; Pail-lard, V.; Cuche, A. Enhancement of electric and magnetic dipole transition of rare-earth-doped thin films tailored by high-index dielectric nanostructures. Applied Optics 2019, 58, 1682.
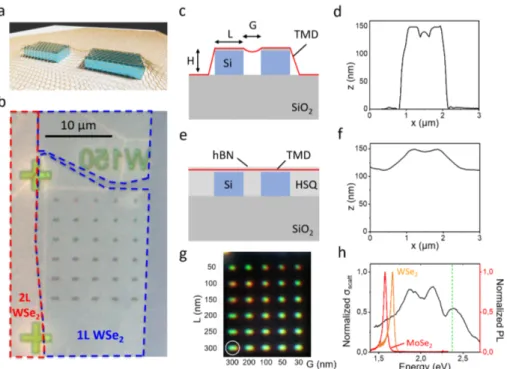
FIG. 1. Nanoresonator arrays for non-planarized and planarized samples.a) Schematic of a bare monolayer on a non-planarized Si nanoresonator, which is referred to as a dimer and consists of 2 rectangles parallel to each other, separated by a gap G. b) Bright field optical image of the sample. Array of rectangular Si dimers with constant width W = 150 nm but varying length (L) and gap (G) covered by a single exfoliated WSe2 ML. c) Illustration of the TMD layer configuration
when deposited on non-flattened Si antennas. d) Measured AFM profiles for configuration shown in c). e) Illustration of the TMD layer configuration when deposited on planarized Si nanoantennas for the same dimers shown in b). f ) Measured AFM profiles for configuration shown in e). g) Dark-field optical images showing the light scattered by the antennas. h) Normalized dark field intensity, measured for G = 300 nm, L = 300 nm dimer without the TMD MLs (bottom left on figure g - white circle). The two first modes (below 2 eV) are the magnetic (MD) and electric dipole (ED) modes. They cover the range of the exciton emission. The resonances at higher energy correspond to higher order modes (quadrupoles) and cover the excitation laser energy. Normalized PL spectra measured on ML WSe2 (orange) and MoSe2 (red) (far from antennas), laser excitation
0 2 4 6 8 10 0 2 4 -2 -4 X (Micron) Y (M ic ro n) 0 2 4 6 8 10 0 2 4 -2 -4 X (Micron) 0 2 4 6 8 10 0 2 4 -2 -4 X (Micron) Y (M ic ro n) 0 2 4 6 8 10 0 2 4 -2 -4 X (Micron) 300 200 100 50 300 250 200 Gap G (nm) Le ng th L (n m )
a
0 2 4 6 8 10 0 2 4 -2 -4 X (Micron) Y (M ic ro n) 0 2 4 6 8 10 0 2 4 -2 -4 X (Micron) 300 200 100 50 300 250 200 Gap G (nm) Le ng th L (nm ) 0 2 4 6 8 10 0 2 4 -2 -4 X (Micron) Y (M ic ro n) 0 2 4 6 8 10 0 2 4 -2 -4 X (Micron)g
1 X2i
j
k -8 -7 -6 -5 0 1 2 3 X (μm) PL in te ns ity (a. u.) PL in te ns ity (a. u.) PL in te ns ity (a.u .) X1.75 -8 -7 -6 -5 1.62 1.64 1.66 0.5 1.0 1.5 2.0 2.5 3.0h
i
j
k
l
b
box_coords = (-5, -1.5, -4.5, -1.5) 6_5_H_V 6_5_V_V Si Raman (Norm) WSe2 R ama n in te ns ity (no rm ) non-planarized No rmalis ed PL in te ns ity WS e2 R ama n po sit io nSi Raman (Norm) WSe2 Raman position WSe2 Raman intensity (norm)
-5 -4 -3 -2 0 1 2 Y ( μm ) X4 X1.7 PL in te ns ity (a. u.) PL in te ns ity (a. u.)
c
d
PL in te ns ity (a. u.)e
c d e -5 -4 -3 -2 1.60 1.62 1.64 1.66 PL en er gy (e V) 1 3 4 5 2 6 Am pl ifi ca tio nf
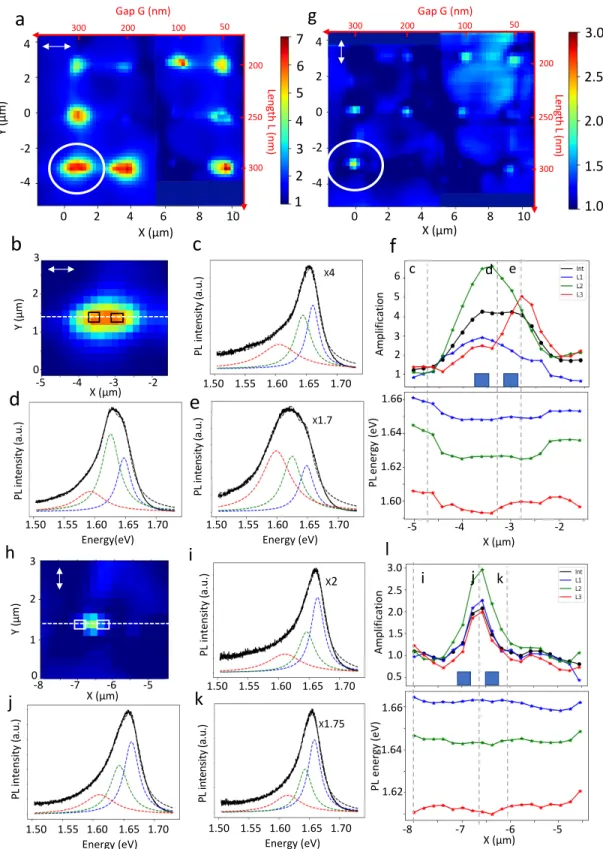
1.50 1.55 1.60 1.65 1.70 Energy (eV) 1.50 1.55 1.60 1.65 1.70 0 2 4 6 8 10 X (μm) 0 -2 -4 2 4 Y (μm ) X (μm) 1.50 1.55 1.60 1.65 1.70 Energy(eV) X (μm) Y ( μm ) 1.50 1.55 1.60 1.65 1.70 Energy (eV) 1.50 1.55 1.60 1.65 1.70 Energy (eV) 1.50 1.55 1.60 1.65 1.70 X (μm) 0 2 4 6 8 10 0 -2 -4 2 4 X (μm) 1 2 3 4 5 6 7 1.0 1.5 2.0 2.5 3.0 PL en er gy (e V) Am pl ifi ca tio n 3FIG. 2. WSe2 monolayer on non-planarized nanoresonators.a) Normalized WSe2PL color maps of 12 dimer resonators
(from G = 300 nm, L = 300 nm to G = 50 nm, L = 200 nm), for x-polarized incident light (along the antennas). b) Normalized PL color map at the vicinity of resonator G = 300 nm, L = 300 nm for x-polarized incident light (corresponding to white circle in a)). Dimer position and shape are marked by the black rectangles on the map. c) d) e) show typical PL spectra taken along the white line on figure b) Here we discern three contributions namely the bright exciton X0 (blue curves
and data points), the trion (green) and the dark exciton XD (red). f ) top: Normalized total PL amplitude (black line) and
individual Lorentzian fitting component amplitude (red, green, blue) measured across the white line on (b) ; bottom: energy of the individual Lorentzian peaks versus position. The dimer position is shown by the blue square, dashed grey lines mark the positions where the PL spectra shown in panel c) d) e) have been taken. g) as a) but for y-polarized incident light (perpendicular to the antennas). h) Normalized PL color map at the vicinity of resonator G = 300 nm, L = 300 nm for y-polarized incident light. Dimer position marked by white rectangles. i) j) k) show typical PL spectra taken along the white line on figure h). Experimental data appear in black continuous line. Blue, green and red dashed lines are the constituting Lorentzian peak used to fit the PL, the corresponding global fit is shown as black dashed lines. l) same as f) but for y-polarized incident light.
X 7.5 X2.1 X1 2.5 3.0 3.5 X (Micron) Gap (nm) 0 2 4 6 8 10 12 0 2 4 6 8 Y (M ic ro n) 10 300 200 100 50 300 250 200 Le ng th (n m ) 1.45
a
b
1.55 1.65 1.75 Energy (eV) PL in ten sity (a .u .) 1.35 -1.5 -1 -0.5 0 0.5 1 X (Micron) 4.0 4.5 Y (M ic ro n ) 2 4 6 8 10 1.574 1.566c
d
position 1 position 2 position 3 1 2 3 X (μm)X (μm)
Y
(μm
)
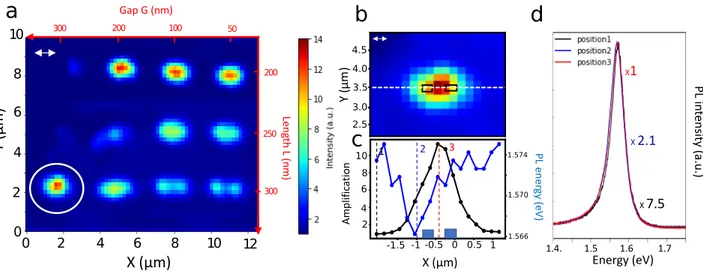
Energy (eV) Y (μm ) Am pl ifi ca tio n PL ener gy (e V) Gap G (nm) Le ng th L (n m ) 1.4. 1.5 1.6 1.7 PL in te ns ity (a.u .)FIG. 3. MoSe2 monolayer on non-planarized nanoresonators. a) Normalized MoSe2 PL color maps of 12 dimer
resonators (same nanoresonators as in Fig. 2a), for x-polarized on non-planarized nanoresonators. b) Normalized PL color map at the vicinity of nanoresonator G = 300 nm, L = 300 nm for x-polarized (corresponding to white circle in a)). Dimer positions and shape is marked by the back rectangles on the map. c) Normalized PL integrated amplitude (black line) and energy of the PL maximum is (blue line) versus position, cross section taken along the white dashed line on (b). The dimer position is marked by the blue squares. d) Typical PL spectra taken at 3 different positions marked by matching color dashed vertical lines in (b). The spectra are normalized, the normalization factor is indicated.
-0.5 0 0.5 1.0 1.5 0 0.8 1.2 1.6 X (μm) Y (μm ) 0.9 1.0 1.1 1.2 1.3 3 1 2 0.8 1.4 Am pl ifi ca tio n 1.0 1.2 1.6 1.61 1.62 1.63 1.64 Po sit io n (e V) 1.65 -0.5 0 0.5 1.0 1.5 X (μm) 0 0.5 1.0 1.5 2.0 X(μm) 4.0 4.5 5.0 Y( μm ) a b c 0.7 0.8 0.9 1.0 1.1 d PL in te ns ity (a. u.) -0.5 0 0.5 1.0 1.5 2.5 0.8 1.1 0.9 1.0 1.3 1.2 Am pl ifi ca tio n 1.61 1.62 1.63 1.64 1.65 1.60 Po si tio n (e V) e f 1.50 1.55 1.60 1.65 1.70 Energy (eV) PL in te ns ity (a. u.) 1.50 1.55 1.60 1.65 1.70 Energy (eV) 3 1 2 X (μm) PL #en ergy #(e V)# PL #en ergy #(e V)#
FIG. 4. Strain free WSe2 monolayer on planarized nanoresonators. a) Normalized PL images of WSe2 monolayer
deposited on G = 300 nm, L = 300 nm planarized nanoresonator for x-polarized laser excitation. Dimer position shown as black rectangles. b) Typical PL spectra taken along the white line on panel (a). The PL spectra are fitted using the same three Lorentzian peaks as detailed in Fig. ?? c) Top: Normalized total PL amplitude (black line) and individual Lorentzian fitting component amplitude (red, green, blue) measured across the white line on (a). The dimer position is marked by the blue squares. Bottom: Energy of the individual Lorentzian peaks versus position along the white line on panel (a). The positions where the PL spectra have been taken appear as dashed line, with matching color. d), e), f ) same as a), b) and c) but for y-polarized incident light.
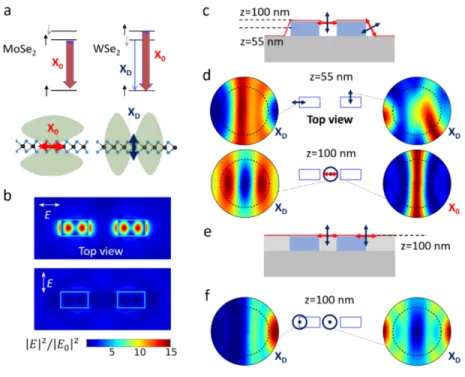
FIG. 5. Numerical simulations of electric field amplitudes and optical dipole emission. a) Top: schematics of the energy levels in MoSe2 (left) and WSe2 (right). Bottom: orientation of the in-plane neutral exciton Xo (red arrow) and the
out-of-plane dark exciton XD (blue arrow) in the x-z plane with respect to the TMD layer. The gray shaded areas represent
the emission lobes of the dipoles. b) Near field intensity in the TMD layer of the non-planarized system for two polarizations parallel and perpendicular to the dimer axis computed in the x-y plane for an incident plane wave at the excitation wavelength λ = 532 nm. c) Geometry of the TMD on a non-planarized dimer in the x-z plane, direction of Xo (red) and XD (dark blue)
are indicated by arrows. d) Emission patterns of a dipole emitting at 750 nm and placed at different positions and heights (z) with respect to the non-planarized dimer shown in (b). The relative positions of the Si-NS and the dipoles are displayed in the x-y plane. The dotted circle corresponds to the 0.9 NA of the microscope objective, we hence detect emission from inside this circle. The dipole can be assimilated to an in-plane exciton (red arrow) or out-of-plane exciton (dark blue arrow) depending on its orientation and position. The surrounding refractive index is n= 1. e) Geometry of the TMD on a planarized dimer in the x-z plane. f) Emission patterns of a dipole emitting at 750 nm and placed at different positions and z=100 nm with respect to the planarized dimer shown in (e). The surrounding refractive index is n=1.45 (HSQ refractive index).