https://doi.org/10.1007/s00217-019-03359-0 ORIGINAL PAPER
Assessment of the triacylglycerol fraction of olive oil by 1D‑NMR
spectroscopy: exploring the usefulness of DEPT tool on the peak
assignments of
13C NMR spectra
Raquel Garcia1 · Arona Pires2 · Nuno Martins3 · Teresa Carvalho4 · Anthony J. Burke2,5 · Maria João Cabrita6
Received: 23 April 2019 / Revised: 20 August 2019 / Accepted: 1 September 2019 / Published online: 19 September 2019 © Springer-Verlag GmbH Germany, part of Springer Nature 2019
Abstract
Nuclear magnetic resonance (NMR) spectroscopy has been extensively used to date for the analysis of olive oil samples and constitutes a valuable tool particularly for the study of the triacylglycerol fraction, which is the major fraction of olive oils. In this report, we demonstrate the usefulness of one-dimensional NMR spectroscopy (1H and 13C NMR) for the
non-destructive analysis of the triacylglycerol fraction of olive oils. To achieve this goal, 13C spectral editing technique known
as distortionless enhancement by polarization transfer (DEPT), namely 13C NMR DEPT 45, 13C NMR DEPT 90, 13C NMR
DEPT 135 was used for the analysis of the triacylglycerol fraction of the olive oil sample owing to the simplification on peak assignments of 13C spectra. The suitability and usefulness of those DEPT experiments using different angle values
in only one pulse sequence will be explored on the interpretation of 13C NMR spectra. In overall, DEPT tool improves the
sensitivity of the analysis due to the enhancement in the signal-to-noise ratio, which is important for this type of analysis contributing to the characterization of olive oils.
Keywords Olive oil · Fatty acid · Triacylglycerol fraction · Nuclear magnetic resonance (NMR)
Introduction
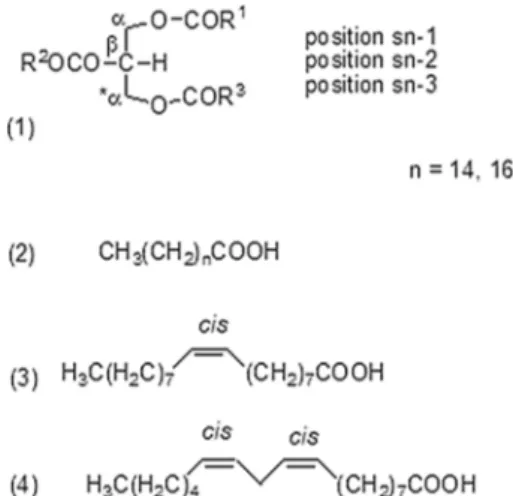
Olive oil consists of monounsaturated, polyunsaturated and saturated fatty acids, with glycerol esters (triacylglycerols, TAGs) being the predominant component (Fig. 1), consti-tuting approximately 98% of the total olive oil composition [1]. Other minor compounds are present in olive oil, includ-ing sterols, polyphenols and volatile compounds, that have a fundamental influence on the quality of the olive oil. Olive oil is a very complex and difficult food matrix to analyze [2], because it consists of many different compounds in dif-ferent concentrations, depending on many factors, such as olive fruit cultivar, olive maturation, geographical location, latitude, climate, as well as the olive fruit processing [3].
The importance of the geographical origin and quality of olive oils has been a concern for the European Union since 1992, and this has given rise to the denominations—pro-tected designation of origin (PDO) and prodenominations—pro-tected geographi-cal indication (PGI) [4, 5] that cover authenticity, quality, cultivar and methods for olive oil production. Therefore, the ascertain of cultivar and geographic origin have aroused a huge interest and some works have explored the suitability of the fatty acids composition and triacylglycerol fraction
* Maria João Cabrita mjbc@uevora.pt
1 ICAAM-Instituto de Ciências Agrárias e Ambientais
Mediterrânicas, IIFA, Universidade de Évora, Núcleo da Mitra, Ap. 94, 7006-554 Évora, Portugal
2 Centro de Química de Évora, Universidade de Évora, Rua
Romão Ramalho, 59, 7000 Évora, Portugal
3 Aix Marseille Univ, Univ Avignon, CNRS, IRD, IMBE,
Marseille, France
4 Instituto Nacional de Investigação Agrária e Veterinária
(INIAV I.P.), Elvas, Portugal
5 Departmento de Química, Escola de Ciências e Tecnologia,
Universidade de Évora, Rua Romão Ramalho, 59, 7000 Évora, Portugal
6 Departamento de Fitotecnia, Escola de Ciências e
Tecnologia, ICAAM-Instituto de Ciências Agrárias e Ambientais Mediterrânicas, Universidade de Évora, Campus da Mitra, Herdade da Mitra, Valverde, 7000-083 Évora, Portugal
combined with multivariate analysis to differentiate olive oil [1]. Gas chromatography (GC) is the most common method for determining the fatty acid composition of oils, includ-ing their derivatives [6–8]. It involves the preparation of fatty acid methyl ester (FAMEs) derivatives, rendering these compounds more volatile for analysis by gas chromatogra-phy [9]. This procedure is time consuming and the sample is destroyed during the process, which is an important issue to consider when the sample is unique or only available in reduced quantities [2, 6, 10]. Recently, nuclear magnetic resonance (NMR) has proven to be a more straightforward tool to determine the fatty acid composition of olive oils pro-viding detailed information in a single run, without the need of chemical extractions, derivatization or any other modifi-cation of the sample [2, 6, 10]. Therefore, many authors have described and investigated the authenticity, quality and geo-graphical origin of olive oils by NMR spectroscopy, since it seems to be a very powerful technique for this purpose [2, 10, 11]. In fact, it allows for a single and quantitative deter-mination of the relative number of molecular groups, which is a good tool for quantifying whole molecular structures, since the intensity of a resonance peak is directly propor-tional to the number of resonant nuclei. Even in complex matrices, the information for all the components is given in one spectrum, obtained from a sample that does not require derivatization [6, 12]. Indeed, NMR seems to be a very promising analytical technique for the analysis of olive oils. Some remarkable aspects could be ascribed such as, it not requires the use of reference compounds, does not destroy the samples being possible to recover them, and it analyses simultaneously various components without pre-isolation of the target compounds [13]. Moreover, the process is more sustainable, particularly from an economic point of view.
The 1D NMR spectrum obtained by the single pulse experiment contains a lot of information on the chemical composition of the olive oil providing relevant informa-tion about the chemical structure of its metabolites at the molecular level [2]. However, some drawbacks could be ascribed to this technique that are mainly related with their low sensitivity hampering the detection of minor compo-nents in complex mixtures such as olive oil. To overcome some of those limitations, several NMR-based approaches have been explored mainly focused on the development of several pulse sequences properly designed to detect some specific compounds, whose identification is crucial for OO characterization [14].
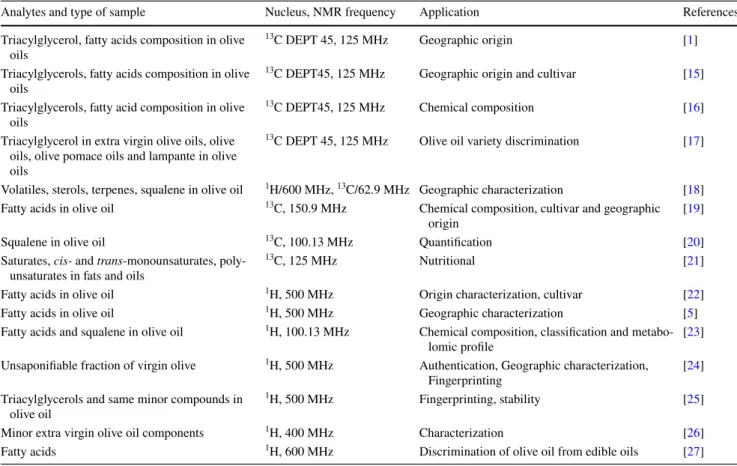
Table 1 summarizes various applications of 1D NMR spectroscopy used for olive oil analysis. In fact, 1H NMR is
the most widely used method, due to the higher sensitivity and lower relaxation times of the proton nuclei relative to the less sensitive 13C NMR nuclei. As observed in Table 1, 1H NMR enables to assess the geographical origin of olive
oils as well as the type of cultivar. Moreover, compounds that play a crucial role on the stability of olive oils can also assessed which is particularly relevant for some OO’s topics, such as storage and shell-life of olive oils [5, 18, 22–26]. However, 1H NMR is not useful to assign the positional
distribution of the fatty acids in the glycerol backbone [2] while 13C NMR spectroscopy provides information at this
level since the main resonances observed in the 13C NMR
spectrum belong to triacylglycerides (Fig. 1).
The high resolution 13C NMR technique is considered
one of the most powerful methods for analysis of vegetable oils. Through this technique, it is possible to distinguish different cultivars and the geographic origins of different olive oils [28, 29] generally using multivariate statistical analysis [30]. Comparing 1H NMR and 13C NMR
spec-troscopy, it is well known that the longitudinal relaxation of the 13C NMR experiment is four times lower than that
of 1H NMR, being 13C NMR longitudinal relaxation times
ranging from 0.5 to 8 s [17]. To overcome this limitation, a new methodology known as 13C NMR distortionless
enhancement by polarization transfer (DEPT) has been explored in the last years. It involves the use of a pulse sequence that transfers polarization from the carbon-13 nuclei to the population of proton nuclei to which they are coupled, making the repeat rate faster because it depends on the shorter relaxation times of the proton nuclei com-pared to carbon-13 nuclei [17]. This technique proves to be very promising due to an enhancement of the sensitivity of the carbon-13 nuclei that is promoted by the application of a DEPT NMR pulse sequence experiment. Concretely,
13C NMR DEPT plays a crucial role on the assignment of
primary, secondary and tertiary carbon atoms, differentiat-ing between –CH, –CH2 and –CH3 groups by variation of
the selection angle parameter: 135° angle gives all –CH
Fig. 1 Basic structure of a triacylglyceride (TAG) proposed by Fisher: (1) shows the structure of the glycerol chain designated by the Greek letters α, β, *α, and stereospecific numbering 1, 2, 3. The structures of the major fatty acids of the oil are also shown: (2) satu-rated; (3) oleic acid; (4) linoleic acid [1]
and –CH3 in a phase opposite to CH2; 90° angle gives only
–CH groups, the others being suppressed; 45° angle gives all carbons with attached protons (regardless of number) in phase. Indeed, the polarization transfer from 1H to 13C has
the secondary advantage of increasing the sensitivity over the normal 13C spectrum, which has a modest
enhance-ment from the nuclear overhauser effect (NOE) due to the
1H decoupling.
In this article, we will discuss the attributes of 1D mult-inuclear NMR spectroscopy as an important tool for profil-ing the chemical composition of olive oil samples, mainly focused on fatty acids composition and triacylglycerol fraction. To achieve this purpose, a Portuguese Olive Oil (Cobrançosa cv.) has been selected as a case study. To pur-sue this study, 1H NMR, 13C NMR, 13C NMR DEPT135, 13C NMR DEPT90 and 13C NMR DEPT45 techniques have
been applied. In particular, the DEPT experiments will be used to assess how the use of different angle values in only one pulse sequence influences the interpretation of 13C
NMR spectra and its usefulness for the characterization of olive oil samples based on the fatty acid composition and triacylglycerol fraction. To the best of our knowledge, there have been no reports on the use of 13C NMR DEPT90
spectroscopy or of 13C NMR DEPT135 spectroscopy for
classifying olive oils.
Materials and methods
Olive oil sample
A 500 mL of monovarietal Portuguese extra virgin olive oil from Cobrançosa cv. was obtained in commercial mill-ing facilities at INIAV-Elvas (Portugal), from fresh olives collected at that place over the period October and Novem-ber 2016.
Sample preparation
For the sample preparation, 100 μL of the olive oil under analysis and 10 μL (0.072 mmol, 8.64 mg) of mesitylene (internal standard—IS) were dissolved in 500 μL of deu-terated chloroform and were placed in a 5 mm diameter NMR tube. Deuterated chloroform 99.8% was obtained from Cambridge Isotope Laboratories, Inc. and used as a solvent. Mesitylene 98% was purchased from Sigma-Aldrich and used as an internal standard for normalizing the carbon resonances in the 13C spectra. All compounds
were used as received without any purification. All analy-sis was performed in quadruplicate.
Table 1 Application of 1D NMR spectroscopy for olive oil characterization
Analytes and type of sample Nucleus, NMR frequency Application References
Triacylglycerol, fatty acids composition in olive oils
13C DEPT 45, 125 MHz Geographic origin [1]
Triacylglycerols, fatty acids composition in olive oils
13C DEPT45, 125 MHz Geographic origin and cultivar [15]
Triacylglycerols, fatty acid composition in olive oils
13C DEPT45, 125 MHz Chemical composition [16]
Triacylglycerol in extra virgin olive oils, olive oils, olive pomace oils and lampante in olive oils
13C DEPT 45, 125 MHz Olive oil variety discrimination [17]
Volatiles, sterols, terpenes, squalene in olive oil 1H/600 MHz, 13C/62.9 MHz Geographic characterization [18]
Fatty acids in olive oil 13C, 150.9 MHz Chemical composition, cultivar and geographic
origin [19]
Squalene in olive oil 13C, 100.13 MHz Quantification [20]
Saturates, cis- and trans-monounsaturates, poly-unsaturates in fats and oils
13C, 125 MHz Nutritional [21]
Fatty acids in olive oil 1H, 500 MHz Origin characterization, cultivar [22]
Fatty acids in olive oil 1H, 500 MHz Geographic characterization [5]
Fatty acids and squalene in olive oil 1H, 100.13 MHz Chemical composition, classification and
metabo-lomic profile [23]
Unsaponifiable fraction of virgin olive 1H, 500 MHz Authentication, Geographic characterization,
Fingerprinting [24]
Triacylglycerols and same minor compounds in olive oil
1H, 500 MHz Fingerprinting, stability [25]
Minor extra virgin olive oil components 1H, 400 MHz Characterization [26]
Instrumentation
The 1D multinuclear NMR spectroscopy (1H NMR, 13C
NMR) and the 13C NMR DEPT experiments [1] (13C NMR
DEPT45, 13C NMR DEPT90 and 13C NMR DEPT135) were
conducted on a Bruker Advance III 400 MHz spectrometer (Madrid- Spain) equipped with a wide band (BBO) observa-tion probe at a temperature of 303 K.
NMR methodologies
Each sample was subjected to five 1D-NMR experiments that included 1H NMR, 13C NMR, 13C NMR DEPT90, 13C
NMR DEPT45, 13C NMR DEPT135. These pulse sequences
were installed in the Bruker TOPSPIN 3.2 pl 6 suit and the analysis of the samples was facilitated by the application of the ICON-NMR user interface installed with the same software suit. The free induction decay (FID) acquisition parameters for this standard single pulse test were as follows: 1. (zg30) in 1H NMR spectral width (SW) = 20.64 ppm,
dummy scans (DS) = 2, number of scans (NS) = 16, the acquisition time (AQ) = 4.089 s, and the received gain (RG) = 10, giving a total run time of 1 min and 32 s; 2. (zgpg30) at 13C NMR: spectral width
(SW) = 238.89 ppm, dummy scans (DS) = 4, the num-ber scans (NS) = 1024, acquisition time (AQ) = 1.3631 s, and the receiver gain (RG) = 2050, giving a total running time of 58 min and 42 s.
3. (deptsp45) at 13C NMR DEPT45 and for the standard
single pulse test (deptsp90) at 13C NMR DEPT90:
spec-tral width (SW) = 238.89 ppm, dummy scans (DS) = 4, the number of scans (NS) = 256, the acquisition time (AQ) = 1.3631 s, and the receiver gain (RG) = 2050, with
a total run time of 14 min and 46 s for each of the pulse sequences.
4. (deptsp135) at 13C NMR DEPT135: spectral width
(SW) = 160.29 ppm, dummy scans (DS) = 4, number of scans (NS) = 256, acquisition time (AQ) = 2.0316 s, and receiver gain (RG) = 2050, giving a total run time of 14 min and 46 s.
The shaped pulse used in our DEPT experiments is defined by the Topspin parameter SPNAM5 = Crp60comp.4. It is an adiabatic pulse with a composite smoothed CHIRP shape with the following characteristics: sweep width: 60 kHz, duration: 2 ms, radiofrequency field intensity (i.e., gB1/2p): 9772 Hz.
The generated files were handled by Topspin software 3.2 pl 6.
In the 13C NMR spectra, mesitylene resonances appeared
at δ 137.68 ppm (C-1, 3, 5), δ 126.91 ppm (C-2, 4, 6) and δ 21.20 ppm (CH3).
Results and discussion
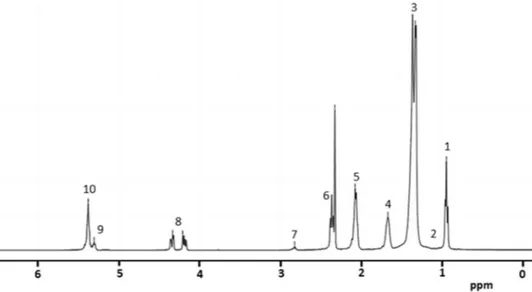
The 1H NMR analysis of a monovarietal olive oil from
Cobrançosa cv. has been performed and Fig. 2 depicts the 1H
NMR spectrum obtained in this study. In fact, 1H NMR
con-stitutes the first tool that is applied in NMR-based assays due to the higher sensitivity and lower relaxation times of the proton nuclei relative to the less sensitive 13C NMR nuclei.
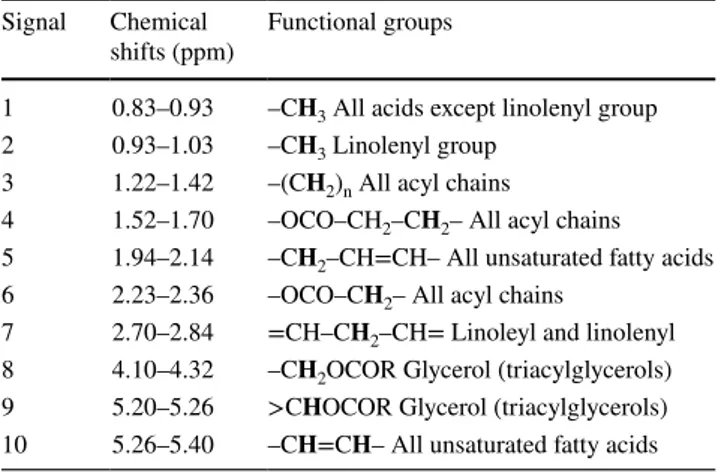
However, the presence of scalar coupling between neigh-boring protons and the much smaller chemical shift ranges for protons (~ 15 ppm, generally 0–10 ppm) often results in spectra with overlapping signals, which makes spectral analysis much more complicated [2]. Table 2 shows the respective chemical shifts and proton assignments. In some
Fig. 2 1H NMR spectrum
(400 MHz in CDCl3) of the
monovarietal Portuguese olive oil Cobrançosa cv
spectra, the signal around δ 0.95 ppm was not observed, probably due to the low quantity of the component that gives rise to this signal, making it difficult to be detected in the spectrum.
As seen in Fig. 2 and listed in Table 2, 1H NMR spectrum
of the olive oil under study shows nine resonance signals that are attributed to the fatty acyl chain and the glyceryl protons of the TAG component. Because the different fatty acids are similar, in free form or as glyceride esters, most of the 1H NMR signals overlap, making it very difficult to
discriminate between these components [31]. The olefinic proton –CH=CH– of unsaturated fatty acids appears around
δ 5.38 ppm in the form of a multiplet (m), at δ 5.31 ppm
is the backbone of glycerol moiety and appears also in the form of a multiplet (m). The signals of the glycerol pro-tons –CH2OCOR found between δ 4.20–4.33 ppm appear
in the form of a double doublet (dd). The linoleyl and lino-lenyl protons (=CH–CH2–CH=) appear at δ 2.81 ppm,
and all the acyl chain protons appear at δ 2.31, 1.65 and 1.31 ppm, respectively. The unsaturated fatty acids pro-tons (–CH2–CH=CH–) appear at δ 2.06 ppm, and the most
upfield signal at δ 0.92 ppm which is observed for all the fatty acids (except linolenyl) appears as a triplet (t). All the signals observed and their multiplicities are similar to those described in the literature for this food sample matrix [2, 6].
13C NMR spectrum was also obtained for the same
mono-varietal olive oil. The main resonances observed belong to triacylglycerides (Fig. 1) and the spectrum can be divided into four principal regions in accordance with the differ-ent carbon groups [29, 32]. The first resonances appear-ing in the spectrum in the region δ 172–174 ppm belong to the carbonyl carbons of the fatty acids, the second reso-nances appearing to the next region in the spectrum at δ 124–134 ppm belong to the olefinic carbons of the unsat-urated fatty acids, the resonances appearing in the third region, δ 60–72 ppm, belong to the carbons of the glycerol structure, and the resonances appearing in the fourth region of the spectrum, δ 10–35 ppm, belong to the aliphatic car-bons [2, 28, 32, 33]. Figure 3 depicts the 13C NMR
spec-trum of the monovarietal olive oil under study, with the assignment of the different resonances. 13C NMR spectra
are obtained with high signal-to-noise ratio in relation to the low natural abundance of the carbon-13 nuclei and the low sensitivity is due to a small gyromagnetic ratio [17, 28].
Compared to the previous 1H NMR spectrum shown
(Fig. 2), the 13C NMR spectrum (Fig. 3) is more complex but
furnishing more information on the composition of the olive oil sample. As previously described, the resonances appear-ing in the spectrum are in agreement with the reported in the literature. By analyzing the 13C NMR spectrum (Fig. 3),
it was possible to observe 41 resonance signals, mostly due to the triacylglycerol (TAG) fraction [2]. As expected, those resonances arise in four principal regions—namely
Table 2 Chemical shifts and proton assignments of a 1H NMR spec-trum of the monovarietal Portuguese olive oil Cobrançosa cv Signal Chemical
shifts (ppm) Functional groups
1 0.83–0.93 –CH3 All acids except linolenyl group
2 0.93–1.03 –CH3 Linolenyl group 3 1.22–1.42 –(CH2)n All acyl chains
4 1.52–1.70 –OCO–CH2–CH2– All acyl chains
5 1.94–2.14 –CH2–CH=CH– All unsaturated fatty acids
6 2.23–2.36 –OCO–CH2– All acyl chains
7 2.70–2.84 =CH–CH2–CH= Linoleyl and linolenyl
8 4.10–4.32 –CH2OCOR Glycerol (triacylglycerols)
9 5.20–5.26 >CHOCOR Glycerol (triacylglycerols) 10 5.26–5.40 –CH=CH– All unsaturated fatty acids
Fig. 3 13C NMR spectrum
(100.13 MHz in CDCl3) of the
monovarietal Portuguese Olive Oil Cobrançosa cv [IS—internal standard, S—solvent (CDCl3)]
the carbonyl carbons of the fatty acids, the olefinic carbons, the glycerol carbons and the aliphatic carbons (as labeled in Fig. 3). Table 3 lists the respective chemical shifts and the corresponding carbon signals for the 13C NMR spectrum of
the olive oil under study.
Lastly, to elucidate the usefulness of 13C NMR DEPT
tool on the analysis of the triacylglycerol fraction of olive oil samples owing to the simplification on the peak assignments of 13C NMR spectra, several 13C NMR experiments using
different angle values (45º, 90º and 135º) in only one pulse
Table 3 Complete 1D NMR analysis of a typical Portuguese olive oil sample of Cobrançosa cv
a Carbon atoms of the acyl chain, saturated (S) oleic acid, (L) linoleic acid, (uk) unknown signal, (Gl)
glyc-erol, and positions 1 (3) and 2-glycerol are indicated by the Greek letters α and β, respectively
Signal Chemical shifts (ppm) Functional groupa
13C NMR 13C DEPT45 13C DEPT90 13C DEPT135
1 173.26 – – – Carbonyl carbon S 2 173.23 – – – Carbonyl carbon O 3 172.83 – – – Carbonyl carbon O 4 130.21 130.20 130.22 130.20 L13 αβ 5 130.01 130.01 130.02 130.01 O 10 αβ 6 129.93 129.93 129.94 129.93 L9 α 7 129.83 129.83 129.84 129.83 L9β 8 129.71 129.71 129.72 129.71 O9 α 9 129.69 129.69 129.70 129.69 O9 β 10 128.10 128.10 128.10 128.10 L10 αβ 11 127.91 127.92 127.91 127.91 L12 αβ 12 68.91 68.91 68.89 68.90 Gl β 13 62.11 62.10 – 62.11 Gl α 14 34.20 34.20 – 34.20 O,L 2 β 15 34.04 34.04 – 34.04 S2 α 16 31.95 31.95 – 31.95 S16 α/O16 αβ 17 31.83 31.82 – 31.83 uk 18 31.56 31.56 – 31.56 L16 αβ 19 29.80 29.80 – 29.80 O12 αβ 20 29.74 29.74 – 29.74 uk 21 29.71 29.70 – 29.71 uk 22 29.67 29.66 – 29.67 uk 23 29.57 29.57 – 29.57 O14 αβ 24 29.52 29.52 – 29.52 S6 α 25 29.41 29.41 – 29.41 S15 α 26 29.36 29.36 – 29.37 O15,13 αβ 27 29.31 29.31 – 29.32 S5 α 28 29.23 29.23 – 29.24 O, L5 β 29 29.21 29.21 – 29.22 O, L5 α 30 29.15 29.14 – 29.15 S4 α-O, L6 α, β-O, L4 α uk 31 29.12 29.12 – 29.12 S4 α-O, L6 α, β-O, L4 α 32 29.08 29.08 – 29.08 O, L4 β 33 29.03 29.02 – 29.03 uk 34 27.25 27.25 – 27,25 O11 αβ 35 27.20 27.20 – 27.20 L8 αβ, O8 αβ 36 25.65 25.65 – 25.65 L11 αβ 37 24.87 24.87 – 24.87 O, L3 αβ, S3 α 38 22.72 22.72 – 22.73 S17 α, O17 αβ 39 22.61 22.61 – 22.62 L17 αβ 40 14.14 14.13 – 14.14 S18 α, O18 αβ 41 14.10 14.09 – 14.10 L18 αβ
sequence were applied to the monovarietal Portuguese olive oil of Cobrançosa cv. The spectra of 13C NMR DEPT45, 13C
NMR DEPT90 and 13C NMR DEPT135 experiments are
depicted in Figs. 4, 5 and 6.
As shown in Fig. 4, the 13C NMR DEPT45 spectrum
presents 38 characteristic resonances. Table 3 lists the respective chemical shifts and the corresponding assign-ment of the carbon signals. It should be noted that this
Fig. 4 13C NMR DEPT45
spec-trum (100.13 MHz in CDCl3)
of the monovarietal Portuguese Olive Oil Cobrançosa cv (IS— internal standard)
Fig. 5 13C NMR DEPT90
spec-trum (100.13 MHz in CDCl3)
of the monovarietal Portuguese olive oil sample Cobrançosa cv (IS—internal standard)
Fig. 6 13C NMR DEPT135
spectrum (100.13 MHz in CDCl3) of the monovarietal
Portuguese olive oil Cobrançosa cv
carbon-13 editing technique so far has only been used in one particular case for the analysis of olive oils [1].
It is well known that 13C NMR DEPT45 tool produces
spectra with positive signals for the CH, CH2 and CH3 (all protonated carbons), with the signals of the quaternary carbons including the signals of the deuterated chloroform solvent not detected or observed.
The 13C NMR DEPT90 spectrum for the same olive oil
sample was also obtained (Fig. 5) and the corresponding assignment of the chemical shifts is indicated in Table 3.
13C NMR DEPT90 tool produces spectra with only CH
signals; therefore, only carbon signals with single attached hydrogen were observed. However, this spectrum displays weak signals between δ 35 and 20 ppm. In fact, it is not uncommon to observe weak CH2 and CH3 resonances in
the 13C NMR DEPT 90 spectrum of some samples [17],
due to the requirement for a perfect 90º pulse alignment for complete CH2 and CH3 editing, but these are generally
significantly attenuated as we see above (region labeled in the spectrum with *).
The 13C NMR DEPT135 spectrum for the same olive oil
sample was also obtained (Fig. 6) and the corresponding assignment of the peaks is listed in Table 3.
13C NMR DEPT135 spectrum presents the resonances
assigned to CH and CH3 units as positive signals contrary to the CH2 resonances which are negative. In this pulse
sequence, all carbons having bound protons are observed. This could be very useful for discriminating the different types of carbons.
In overall, the spectra represented in the Figs. 4, 5, 6 and the assigned chemicals shifts are coincident to that given in the literature [2, 29, 32] (Table 3). Particularly, both the 13C NMR DEPT135 (Fig. 6) and the 13C NMR
DEPT45 (Fig. 5) give more specific information. Naturally, there is the absence of the fatty acid carbonyl groups, and other quaternary carbon resonances. Indeed, quaternary carbon signals are absent from all polarization transfer spectra that are set up to exploit large single-bond J-cou-pling [17]. The resonance signals are attributed to the TAG units that appear between δ 10 ppm and δ 135 ppm. The
13C NMR DEPT135 and the 13C NMR DEPT45 spectra
have the strong advantage that compared with the broad-band 13C NMR spectrum they afford significant structural
and compositional information, more rapidly than with broadband 13C NMR and with better sensitivity due to the
polarization transfer [17]. By comparison, the 13C NMR
DEPT90 spectrum shows only nine resonances attributed to the olefinic and glycerol carbons owing to the more limited polarization transfer method, which restricts the identification into only the primary carbons.
13C NMR DEPT90 is more limited polarization transfer
method, as it is limited to identification of only the primary carbons, and as such presents limited sample points for the
key multivariate statistical methods that are necessary to validate the geographical origin of the olive oil.
Conclusions
In summary, this study has involved the application of sev-eral 1D NMR techniques—namely 1H NMR, 13C NMR, 13C
NMR DEPT45, 13C NMR DEPT90 and 13C NMR DEPT135,
in the analysis of the fatty acid composition and TAG frac-tions of a typical monovarietal Portuguese Olive Oil sample (Cobrançosa cv.), aiming to obtain insights about the useful-ness of the combined NMR techniques and, particularly, the
13C NMR DEPT tools on the straightforward assessment of
the geographical origin of olive oil samples.
Generally, in the NMR-based study developed in this work, all the obtained data coincided satisfactorily with the data found in the literature. It should be noted that 13C NMR
analysis provided more useful information than that obtained from 1H NMR technique. Thus, 13C NMR technique seems
to be a powerful tool to be used on olive oil authentication and traceability.
Particularly for the 13C NMR DEPT tool, the 13C NMR
DEPT45 experiment was shown to be a suitable approach, particularly in the context of its application in multivariate statistical analysis. Moreover, as far as we are aware, there has only been one report in the literature to date [1] on its application in this context for the analysis of Italian olive oils. Although 13C NMR DEPT90 and 13C NMR DEPT135
have never been explored for olive oil sample analysis, 13C
NMR DEPT135 seems to be a promising tool for the char-acterization of the TAG fraction of olive oil samples. As dis-cussed above, 13C NMR DEPT45 and 13C NMR DEPT135
have several advantages, compared with 13C broadband
NMR, including (1) greater sensitivity compared to broad-band 13C NMR and (2) shorter analytical time, which are
highly desirable from the stand point of multi-sample analy-sis for multivariate statistical treatment in the determination of the geographical origin of the olive oil. As expected, the suitability of 13C NMR DEPT 90 data for the purpose of this
work is very limited since only –CH groups are detected, hampering the use of this tool for multivariate statistical analysis. Nonetheless, it can be used as a complimentary method to support structural and compositional analysis of the olive oil samples. Thus, 13C NMR DEPT45 and 13C
NMR DEPT135 are complementary tools contributing to an accurate ascertain of the fatty acid composition and TAG fraction of the olive oil under study.
In overall, compared to other analytical methods above-mentioned (namely chromatographic ones), these 1D-NMR methods allow for an effective quality assessment of olive oils, which can be undertaken in a fraction of the time required using the other standard techniques, as well as
limited sample preparation issues. Moreover, with the inexo-rable advancements taking place in the development of more sensitive 1D NMR techniques, the use of this approach for olive oil analysis—particularly from the stand-point of ori-gin and authenticity—is expected to become an even more prominent and standard technique in the near future.
Acknowledgements The authors thank Project “Por3O—Portuguese Olive Oil Omics for traceability and authenticity—PTDC/AGR-PRO/2003/2014, funding by European Regional Development Fund (FEDER) and National Funds through Fundação para a Ciência e a Tecnologia (FCT); Project “MedOOmics—Mediterranean Extra Virgin Olive Oil Omics: profiling and fingerprinting- Arimnet2/0001/2015” funding by the National Funds through Fundação para a Ciência e a Tecnologia (FCT); and FEDER funds through the Operational Program for Competitive Factors (COMPETE) for funding the FCT Projects UID/AGR/00115/2019 and UID/QUI/0619/2016, respectively. Nuno Martins acknowledges French National Agency for Research (ANR-15-ARM2-0002-04) supported by the European Union’s Seventh Framework Programme for research, technological development and demonstration under Grant Agreement Number 618127 (ARIMNet2).
Compliance with ethical standards
Conflict of interest The authors declare that they have no conflict of interest.
Compliance with ethics requirements This article does not contain any studies with human or animal subjects.
References
1. Vlahov G, Schiavone C, Simone N (2001) Quantitative 13C NMR
method using the DEPT pulse sequence for the determination of the geographical origin (DOP) of olive oils. Magn Reson Chem 39(11):689–695. https ://doi.org/10.1002/mrc.929
2. Dais P, Hatzakis E (2013) Quality assessment and authentication of virgin olive oil by NMR spectroscopy: a critical review. Anal Chim Acta 765:1–27. https ://doi.org/10.1016/j.aca.2012.12.003 3. Gunstone F (2011) Vegetable oils in food technology:
composi-tion, properties and uses. Wiley, New York
4. Regulation C (1992) Council Regulation (EEC) No. 2081/92 of 14 July 1992 on the protection of geographical indications and designations of origin for agricultural products and foodstuffs. Off. J. Eur. Union 208, pp 1–8
5. Rongai D, Sabatini N, Del Coco L, Perri E, Del Re P, Simone N, Marchegiani D, Fanizzi FP (2017) 1H NMR and
multivari-ate analysis for geographic characterization of commercial extra virgin olive oil: a possible correlation with climate data. Foods 6(11):96–105. https ://doi.org/10.3390/foods 61100 96
6. Knothe G, Kenar JA (2004) Determination of the fatty acid profile by 1H-NMR spectroscopy. Eur J Lipid Sci Technol 106(2):88–96.
https ://doi.org/10.1002/ejlt.20030 0880
7. Miyake Y, Yokomizo K, Matsuzaki N (1998) Determina-tion of unsaturated fatty acid composiDetermina-tion by high-resoluDetermina-tion nuclear magnetic resonance spectroscopy. J Am Oil Chem Soc 75(12):1091–1094. https ://doi.org/10.1007/s1174 6-998-0118-4 8. Yang Y, Ferro MD, Cavaco I, Liang Y (2013) Detection and
iden-tification of extra virgin olive oil adulteration by GC-MS com-bined with chemometrics. J Agric Food Chem 61(15):3693–3702. https ://doi.org/10.1021/jf400 0538
9. Ur Rahman I, Qureshi MN, Ahmad S (2012) Comparative study of fatty acid components in oils of different olive varieties grown in different regions of pakistan by gas chromatography-mass spectrometry. J Chin Chem Soc 59(1):46–50. https ://doi. org/10.1002/jccs.20100 0397
10. Mannina L, Sobolev AP (2011) High resolution NMR char-acterization of olive oils in terms of quality, authenticity and geographical origin. Magn Reson Chem 49(S1):S3–S11. https ://doi.org/10.1002/mrc.2856
11. Girelli CR, Del Coco L, Fanizzi FP (2017) Tunisian extra virgin olive oil traceability in the EEC market: Tunisian/Ital-ian (Coratina) EVOOs blend as a case study. Sustainability 9(8):1471–1481. https ://doi.org/10.3390/su908 1471
12. Malz F, Jancke H (2005) Validation of quantitative NMR. J Pharm Biomed Anal 38(5):813–823. https ://doi.org/10.1016/j. jpba.2005.01.043
13. Sun S, Jin M, Zhou X, Ni J, Jin X, Liu H, Wang Y (2017) The application of quantitative 1H-NMR for the determination
of Orlistat in tablets. Molecules 22(9):1517–1526. https ://doi. org/10.3390/molec ules2 20915 17
14. Dugo G, Rotondo A, Mallamace D, Cicero N, Salvo A, Rotondo E, Corsaro C (2015) Enhanced detection of aldehydes in extra-virgin olive oil by means of band selective NMR spectros-copy. Phys A 420:258–264. https ://doi.org/10.1016/j.physa .2014.11.010
15. Vlahov G, Del Re P, Simone N (2003) Determination of geo-graphical origin of olive oils using 13C nuclear magnetic
reso-nance spectroscopy. I—classification of olive oils of the Puglia region with denomination of protected origin. J Agric Food Chem 51(19):5612–5615. https ://doi.org/10.1021/jf020 7124
16. Vlahov G (2005) 13C nuclear magnetic resonance spectroscopy to
check 1, 3-random, 2-random pattern of fatty acid distribution in olive oil triacylglycerols. J Spectrosc 19(2):109–117. https ://doi. org/10.1155/2005/76523 6
17. Sanders JK, Hunter BK (1988) Modern NMR spectroscopy: a guide for chemists, 2nd edn. Oxford University Press, Oxford 18. D’Imperio M, Mannina L, Capitani D, Bidet O, Rossi E, Bucarelli
FM, Quaglia GB, Segre A (2007) NMR and statistical study of olive oils from Lazio: a geographical, ecological and agronomic characterization. Food Chem 105(3):1256–1267. https ://doi. org/10.1016/j.foodc hem.2007.02.045
19. Mannina L, Dugo G, Salvo F, Cicero L, Ansanelli G, Calcagni C, Segre A (2003) Study of the cultivar- composition relationship in Sicilian olive oils by GC, NMR, and statistical methods. J Agric Food Chem 51(1):120–127. https ://doi.org/10.1021/jf025 656l 20. Nam AM, Bighelli A, Tomi F, Casanova J, Paoli M (2017)
Quan-tification of squalene in olive oil using 13C nuclear magnetic
reso-nance spectroscopy. Magnetochemistry 3(4):34–43. https ://doi. org/10.3390/magne toche mistr y3040 034
21. Gao L, Sedman J, García-González DL, Ehsan S, Sprules T, Van de Voort FR (2009) 13C NMR as a primary method for determin-ing saturates, cis-and trans-monounsaturates and polyunsaturates in fats and oils for nutritional labeling purposes. Eur J Lipid Sci Technol 111(6):612–622. https ://doi.org/10.1002/ejlt.20080 0242 22. Del Coco L, Schena FP, Fanizzi FP (2012) 1H nuclear magnetic
resonance study of olive oils commercially available as italian products in the United States of America. Nutrients 4(5):343–355. https ://doi.org/10.3390/nu405 0343
23. Merchak N, El Bacha E, Khouzam RB, Rizk T, Akoka S, Bejjani J (2017) Geoclimatic, morphological, and temporal effects on Leba-nese olive oils composition and classification: a 1H NMR
metabo-lomic study. Food Chem 217:379–388. https ://doi.org/10.1016/j. foodc hem.2016.08.110
24. Alonso-Salces R, Héberger K, Holland M, Moreno-Rojas J, Mari-ani C, Bellan G, Reniero F, Guillou C (2010) Multivariate analysis of NMR fingerprint of the unsaponifiable fraction of virgin olive
oils for authentication purposes. Food Chem 118(4):956–965. https ://doi.org/10.1016/j.foodc hem.2008.09.061
25. Alonso-Salces RM, Holland MV, Guillou C (2011) 1H-NMR
fingerprinting to evaluate the stability of olive oil. Food Con-trol 22(12):2041–2046. https ://doi.org/10.1016/j.foodc ont.2011.05.026
26. Ruiz-Aracama A, Goicoechea E, Guillén MD (2017) Direct study of minor extra-virgin olive oil components without any sample modification. 1H NMR multisupression experiment: a powerful
tool. Food Chem 228:301–314. https ://doi.org/10.1016/j.foodc hem.2017.02.009
27. Zhang Y, Zhao Y, Shen G, Zhong S, Feng J (2018) NMR spec-troscopy in conjugation with multivariate statistical analysis for distinguishing plant origin of edible oils. J Food Compos Anal 69:140–148. https ://doi.org/10.1016/j.jfca.2018.03.006
28. Vlahov G (1999) Application of NMR to the study of olive oils. Prog Nucl Magn Reson Spectrosc 35(4):341–357
29. Vlahov G, Angelo CS (1996) the structure of triglycerides of mon-ovarietal olive oils: a 13C-NMR comparative study. Eur J Lipid Sci
Technol 98(6):203–205. https ://doi.org/10.1002/lipi.19960 98060 5
30. Vlahov G (2006) 13C nuclear magnetic resonance spectroscopy
to determine olive oil grades. Anal Chim Acta 577(2):281–287. https ://doi.org/10.1016/j.aca.2006.06.044
31. Popescu R, Costinel D, Dinca OR, Marinescu A, Stefanescu I, Ionete RE (2015) Discrimination of vegetable oils using NMR spectroscopy and chemometrics. Food Control 48:84–90. https :// doi.org/10.1016/j.foodc ont.2014.04.046
32. Sacchi R, Addeo F, Paolillo L (1997) 1H and 13C NMR of virgin
olive oil. An overview. Magn Reson Chem 35(13):S133–S145 33. Zamora R, Alba V, Hidalgo FJ (2001) Use of high-resolution 13C
nuclear magnetic resonance spectroscopy for the screening of virgin olive oils. J Am Oil Chem Soc 78(1):89–94. https ://doi. org/10.1007/s1174 6-001-0225-z
Publisher’s Note Springer Nature remains neutral with regard to jurisdictional claims in published maps and institutional affiliations.