Postprandial response of plasma insulin, amylin and acylated ghrelin
to various test meals in lean and obese cats
Lucile J. M. Martin
1*, Brigitte Siliart
1, Thomas A. Lutz
2, Vincent Biourge
3, Patrick Nguyen
1and Henri J. W. Dumon
11Unite´ de Nutrition et Endocrinologie, Laboratoire des Dosages Hormonaux, Ecole Nationale Ve´te´rinaire, Nantes, France 2Institute of Veterinary Physiology, Vetsuisse Faculty University of Zurich, Zurich, Switzerland
3Royal Canin, Centre de Recherches, Aimargues, France
(Received 1 June 2009 – Revised 18 November 2009 – Accepted 26 November 2009 – First published online 26 January 2010)
The propensity of diets of different composition to promote obesity is a current topic in feline medicine. The effects of three meals with different protein:fat ratios on hormones (insulin, acylated ghrelin and amylin) involved in the control of food intake and glucose metabolism were compared. Five lean (two females and three males, 28·6 (SD3·4) % body fat mass (BFM), mean body weight (BW) 4590 g) and five obese (two females and three males, 37·1 (SD 4·1) % BFM, mean BW 4670 g) adult cats were studied. Only BFM differed significantly between obese and lean cats. The cats were fed a high-protein (HP), a high-fat and a high-carbohydrate diet in a randomised cross-over design. Food intake did not differ between cats fed on the different diets, but obese cats consumed significantly more energy, expressed as per kg fat-free mass, than lean cats. After a 6-week adaptation period, a test meal was given and blood samples were collected before and 0, 30, 60 and 100 min after the meal. Baseline concentrations of glucose, amylin and acylated ghrelin were higher in obese cats than in lean cats, and obese cats showed the highest postprandial responses of glucose and amylin. The HP diet led to higher postprandial amylin concentrations than the other diets, indicating a possible effect of amino acids on b-cell secretion. Postprandial ghrelin concentrations were unaffected by diet composition. The relationship between insulin, amylin and ghrelin secretion and their relevant roles in food intake and glucose metabolism in cats require further study.
Cats: Obesity: Ghrelin: Amylin: Diets
The prevalence of obesity in pets is increasing and is now a key health problem in cats. As in many other species, obesity in cats is associated with insulin resistance, which may ultimately lead to diabetes mellitus.
Numerous signalling molecules are involved in the control of food intake and energy expenditure(1). Some originate from the adipose tissue (such as leptin), some from the gastrointestinal tract (such as ghrelin and amylin) and some from the central nervous system (CNS). The discovery of leptin, ghrelin, amylin and other factors has increased our understanding of the multifaceted pathophysiology of obesity. Ghrelin, leptin and amylin control important gastrointestinal functions, such as motility and secretion, and provide the CNS with feedback signals to control food intake(2). Ghrelin is secreted from the stomach, and its circulating levels are higher during fasting. As ghrelin is sensed in the CNS, it has been considered a hunger signal. Two major forms (acylated and deacylated ghrelin) have been identified in the bloodstream(3). Both forms are known to regulate insulin secretion and glucose metabolism. Deacylated ghrelin, in contrast to acylated ghrelin, is not involved in the control of
food intake and inhibits glucose synthesis in isolated hepatocytes. Acylated ghrelin is a natural ligand of the growth hormone secretagogue receptor type 1a and is an important orexigenic factor. Ghrelin concentrations, like growth hormone, fluctuate with circadian rhythmicity. Exogenous ghrelin is reported to stimulate food intake, body weight (BW) gain and adiposity when administered peripherally or centrally to rodents. These actions are indepen-dent of growth hormone secretion, and ghrelin seems to be a functional antagonist to the leptin-induced inhibition of food intake(4).
Plasma leptin concentration, at least under stable BW conditions, is correlated with body fat mass (BFM). Leptin signals the size of body fat stores to the CNS and inhibits eating(4). Moreover, leptin inhibits insulin secretion and controls glucose metabolism by targeting specific enzymes in liver, muscle and adipose tissue independent of insulin(5,6)and negatively regulates ghrelin levels(7).
Amylin is co-secreted with insulin. It delays gastric emptying and reduces food intake. Amylin has also been shown to increase the eating-inhibitory effect of other
* Corresponding author: Lucile J. M. Martin, fax þ 33 240 687 746, email [email protected]
Abbreviations:BCS, body condition score; BFM, body fat mass; BW, body weight; CNS, central nervous system; FFM, fat-free mass; HC, high carbohydrate; HF, high fat; HP, high protein.
hormones such as cholecystokinin, insulin and leptin(8). Insulin and amylin have complementary effects on glucose metabolism. During the postprandial period, insulin stimulates peripheral glucose uptake, whereas amylin regulates glucose appearance in the bloodstream by regulating gastric emptying, suppressing postprandial glucagon secretion and increasing satiation. Amylin levels are increased under conditions associated with insulin resistance, such as obesity. In non-obese subjects, the patterns of plasma islet amyloid polypeptide response after an oral glucose load were similar to those of insulin and c-peptide. However, compared with non-obese patients, a hyper-response of islet amyloid polypeptide relative to c-peptide was noted in obese patients who had also a hyper-response of insulin relative to c-peptide(9).
Overall, there seem to be strong interactions between ghrelin, leptin and insulin(10), i.e. all these hormones are complementary signals of the same control system that eventually informs the CNS about energy status.
Cats are carnivores, which implies that their natural diet is meat based(11). Cats mainly use protein for maintenance of glycaemia but, nevertheless, are able to use a variety of dietary carbohydrates for this purpose. It has been suggested that any dietary carbohydrate not used for production of energy will be converted and stored as fat(11). It has also been postulated that high-protein (HP) diets may be more efficient in preventing obesity and diabetes in cats. Hence, the aim of the present study was to compare the effect of three meals with different protein, fat or carbohydrate:energy ratios on basal and postprandial plasma glucose, ghrelin, insulin and amylin concentrations. Our hypothesis was that:
(1) the diet composition leads to differences in hormone secretion, which could promote obesity in cats;
(2) response to a test meal differs between obese and lean cats, and this could perpetuate obesity.
Experimental methods Animals and husbandry
Five lean (two females and three males, body condition score (BCS) ¼ 3 and 3·5 on a five-point scale, mean BW 4590 (SD 864) g) and five overweight and obese (two females and three males, BCS ¼ 4, 4·5 or 5 on a five-point scale, mean BW 4670 (SD 781) g) adult domestic short-hair cats from different genetic backgrounds were included in the study. All the cats had been neutered (at about 10 months old). The mean ages for lean and obese cats were 7·2 (SD 1·1) and 7·9 (SD 0·7)
years, respectively. Before the start of the study, the cats were housed together and fed the same balanced maintenance diet (Fit32w; Royal Canin, Aimargues, France) free choice for at least 2 months. Room lighting consisted of 12 h light and dark periods and the inside temperature ranged from 18 to 218C. The cats were able to go outside.
The animal studies were reviewed by the appropriate committee and husbandry, and use of the cats was in accordance with current French and international legis-lation concerning animals used for experiments (agreement number 44 264).
The cats were subjected to a clinical and biochemistry examination before inclusion in the study. They were then weighed weekly throughout the study and the BCS was
noted. Biochemistry analyses were performed at the end of each period before the diet was changed.
Protocol
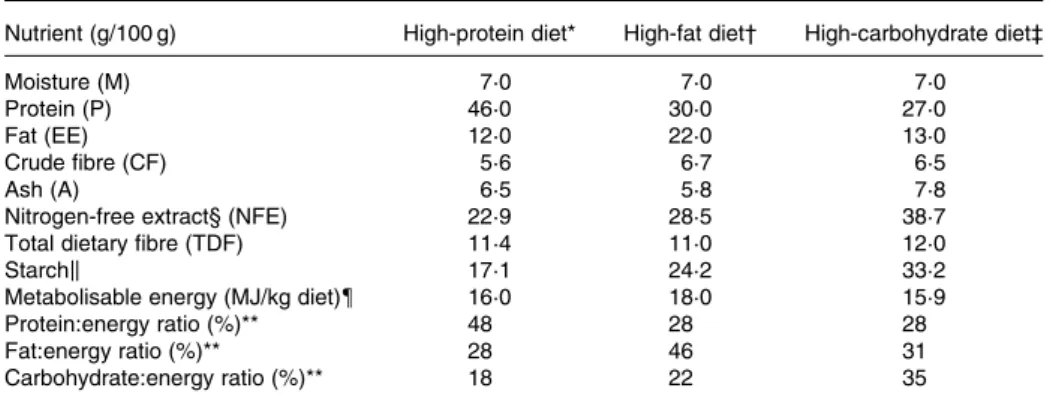
Three commercially available diets were used in the study: a HP diet (Veterinary Diet, Feline Diabetic; Royal Canin), a high-fat (HF) diet (Feline Breed, Persian 30; Royal Canin) and a high-carbohydrate (HC) diet (Feline Health Nutrition Indoor27; Royal Canin). The cats were divided into three groups that were randomly allocated to one of the three diets. The cats were fed these diets for 6 weeks each according to a randomised cross-over design. The composition and energy values of the diets are detailed in Table 1.
A 6-week adaptation period to each diet was respected before the test meal. The cats were individually offered 70 g/d of the diet. This amount was greater than the expected consumption. The cats were trained to eat for 10 min twice a day (08.00 and 16.00 hours) to standardise blood sampling. The exact food intake was carefully measured. For the test meal, 35 g of food was offered for 10 min at 08.00 hours.
Blood sampling
Catheters were placed in the jugular vein of the cats on the day before the experiment to allow blood sampling during the test meal. Catheter patency was maintained by flushing with a hepar-inised (50 IU/ml) physiological saline solution. All blood samples were handled similarly: whole blood was collected
through the jugular catheter and placed in tubes
containing heparin or EDTA þ aprotinin for plasma collection. The tubes were kept on ice (about 0 – 48C) for the entire procedure and before centrifugation (, 30 min). The centrifuge was cooled to 48C. The plasma for hormone measurements was stored at , 2 808C pending analysis. The biochemistry analyses were performed immediately after blood collection.
Blood was sampled 15 min before the test meal (baseline) and then immediately (T0) after the test meal and 30, 60 and 100 min later.
Analyses
Diets. Diets were analysed for moisture (AFNOR 82411), ash (AFNOR 77374), crude fibre (AFNOR 77015) and diethyl ether extract (AFNOR 80134). Total protein was determined by the method of Dumas in a Leco FP-248 model nitrogen determinator (Leco, St Joseph, MI, USA). Total dietary fibre was analysed using the total dietary fibre assay kit (TDF-100A; Sigma, St Louis, MO, USA).
Nitrogen-free extract ðpercentage as fedÞ
¼ 100 2 ðmoisture þ protein þ fat þ minerals þ crude fibreÞ:
Starch content ðpercentage as fedÞ
¼ 100 2 ðmoisture þ protein þ fat þ minerals þ total dietary fibreÞ:
Body composition was determined from isotope dilution of 2H
2O(12)at the start of the study. If BW and the BCS remained stable during the study, the analysis was not repeated.
Commercially available kits were used for the hormone analyses. All assays had previously been validated for use in cats and the assay procedures were performed according to the manufacturers’ instructions.
Insulin-like growth factor 1 was assayed with the human IGF-I RIA kit (Nichols Institute Diagnostics, San Juan Capistrano, CA, USA)(13). Leptin was assayed with a RIA kit (Multi-species Leptin RIA kit, catalogue no. XL-85K; Linco Research, Inc., St Charles, MO, USA)(14).
Insulin was assayed using the porcine insulin RIA kit (cat-alogue no. PI-12K-85K; Linco Research, Inc.)(14).
Amylin was assayed with a RIA kit specifically developed for cats (catalogue no. RK-017-01; Phoenix Pharmaceuticals, Inc., Belmont, CA, USA). This kit allows measurement of the amylin in plasma samples within the range of 10 – 1280 pg/ml. According to the manufacturer, the lowest detection limit is approximately 50 pg/ml (approximately 12·5 pmol/l). The intra- and interassay CV were 8·6 and 6·8 %, respectively.
The major active form of feline ghrelin is a twenty-eight-amino acid peptide with an n-octanoyl modification at Ser3(15). Due to the high structural similarity of feline and human ghrelin, human kits can be used to measure feline ghrelin(15). Plasma ghrelin levels were measured with a human active ghrelin RIA kit from Linco Research, Inc. (catalogue no. GHRA-88HK). This RIA kit shows 100 % cross-reactivity with human ghrelin, rat ghrelin and canine ghrelin. The kit was validated from parallelism responses to increasing dilutions of plasma from five cats. The intra- and interassay CV were 6·7 and 7·6 %, respectively, for a mean concentration of 140 pg/ml.
Biochemical analyses were performed with an automated chemistry analyser (Tokyo Boeki Prestige 24i; Kitvia, Labarthe Inard, France) by the Veterinary Diagnostic Laboratory, National Veterinary School (Nantes, France).
Statistical analysis
A linear mixed effects model was used to assess the effect of body composition (df ¼ 1), diet (df ¼ 2), time (df ¼ 4) and sex (df ¼ 1) on the measured parameters. The normality of the residuals was checked for each model. Data were expressed as mean values (SD), and P, 0·05 was considered
significant. Differences with P. 0·05 and , 0·1 were considered as a trend. All analyses were performed with the XLstat-Pro 2009 software (Addinsoft SARL, New York, NY, USA). In the statistical analysis, calculations were performed using a reference group. The HP diet was arbitra-rily chosen as the reference group for diet.
Results
Body weight, food intake and energy intake
All cats remained healthy throughout the study. Mean BW (4630 (SD 778) g) did not differ between diet groups at any stage of the study, but BFM was clearly higher in obese cats than in lean cats (Table 2). The BCS based on a five-point scale was closely correlated to the BFM assayed by isotope dilution (P, 0·0001, r2 0·938). When the cats were categorised according to sex, the mean BFM did not differ between males (32·0 (SD 4·5)%) and females (34·2 (SD
7·6)%; P¼ 0·762) despite the fact that male cats were heavier than female cats (P¼ 0·049). The mean BFM of lean cats Table 1. Macronutrient composition of the three diets (as fed)
Nutrient (g/100 g) High-protein diet* High-fat diet† High-carbohydrate diet‡
Moisture (M) 7·0 7·0 7·0
Protein (P) 46·0 30·0 27·0
Fat (EE) 12·0 22·0 13·0
Crude fibre (CF) 5·6 6·7 6·5
Ash (A) 6·5 5·8 7·8
Nitrogen-free extract§ (NFE) 22·9 28·5 38·7
Total dietary fibre (TDF) 11·4 11·0 12·0
Starchk 17·1 24·2 33·2
Metabolisable energy (MJ/kg diet){ 16·0 18·0 15·9
Protein:energy ratio (%)** 48 28 28
Fat:energy ratio (%)** 28 46 31
Carbohydrate:energy ratio (%)** 18 22 35
* High-protein diet consists of the following ingredients: dehydrated poultry meat; soya protein isolate; maize flour; wheat gluten; barley; maize gluten; poultry fat; cellulose powder; hydrolysed poultry liver proteins; beet pulp; minerals; psyllium husks and seeds; fish oil; fructo-oligosaccharides; potassium citrate; soya oil; taurine; hydrolysed crustaceans;L-carnitine; hydrolysed cartilage.
† High-fat diet consists of the following ingredients: dehydrated poultry meat; rice; poultry fat; maize flour; cellulose powder; soya protein isolate; maize gluten; hydrolysed poultry liver proteins; minerals;L-lysine; chicory pulp; fish oil; psyllium husks and seeds; sodium phosphate; soya oil; egg powder; fructo-oligosaccharides; DL-methionine; hydrolysed yeast; taurine; borage oil; marigold extract.
‡ High-carbohydrate diet consists of the following ingredients: maize; dehydrated poultry meat; rice; vegetable protein isolate; wheat; poultry fat; cellulose powder; hydrolysed animal proteins; minerals; beet pulp; soya oil; fructo-oligosaccharides; yeasts; sodium phosphate; fish oil;L-lysine;DL-methionine; taurine; green tea and grape extracts;L-carnitine.
§ NFE ¼ 100 2 ðM þ P þ EE þ CF þ AÞ: k Starch ¼ 100 2 ðM þ P þ EE þ TDF þ AÞ:
{ Metabolisable energy ðMJ=kg dietÞ ¼ 0·1672 £ ðP þ NFEÞ þ 0·3762 £ EE:
(BCS ¼ 3 and 3·5) was 28·6 (SD 2·4)% whereas that of obese
cats (BCS ¼ 4, 4·5 or 5) was 37·1 (SD4·1)%.
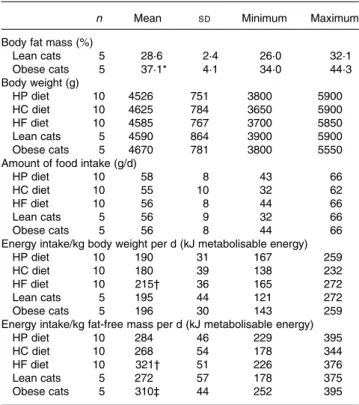
All three diets were well tolerated by the cats. Obese cats ate significantly more than lean cats in terms of total energy intake per kg body fat-free mass (FFM; P¼ 0·046), but spontaneous food intake (g/d) and total energy intake expressed as kJ metabolisable energy/kg BW per d did
not differ between the two categories (Table 2).
Total energy intake (kJ metabolisable energy/d) and energy (kJ metabolisable energy) per kg FFM were higher in cats
on the HF diet (P¼ 0·001 and 0·001, respectively). No effect of sex was demonstrated on the above parameters.
When BW at the beginning and at the end of the trial period was compared for each respective diet, BW was significantly increased at the end of the HF diet period (P¼ 0·012; þ 2 % BW). BFM had no effect on the variations of BW (Table 3).
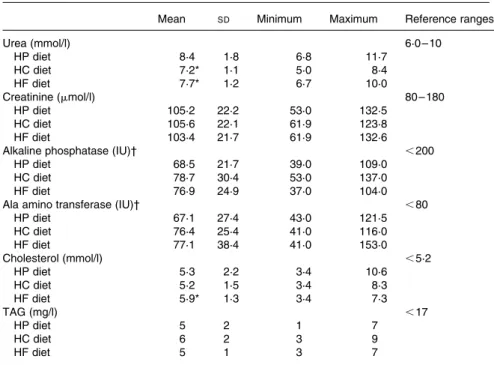
The measured biochemical values, except for cholesterol, remained within the normal ranges in most cats (Table 4). Cholesterol was affected by diet (P¼ 0·05) but was not correlated with BFM. The total cholesterol concentration was significantly increased in cats on the HF diet. Moreover, urea was increased when cats were fed the HP diet (P¼ 0·028).
Baseline concentrations
The mean baseline concentrations of glucose, insulin, ghrelin, insulin-like growth factor 1 and leptin (Table 5) did not differ between the diet groups. Baseline amylin concentration tended to be higher (P¼ 0·06) when cats were fed the HP diet (57 (SD 37) pmol/l) than with the HC diet (39 (SD 21) pmol/l). A significant BFM effect was found for glucose, leptin, amylin and ghrelin, i.e. the concentrations were significantly higher in obese than in lean cats. Baseline amylin concentration was also higher in male cats (58 (SD30) pmol/l) than in female cats (34 (SD 17) pmol/l; P¼ 0·012).
Blood glucose following the test meal
Significant differences in glucose concentrations, depending on the diet and BFM (percentage of BFM), were apparent from the pooled data (Table 6 and Figs. 1 and 2). Mean glycaemia was higher in the HF diet (P, 0·0001), and obese cats had higher glycaemia than lean cats (P, 0·0001). No significant variations in postprandial blood glucose were observed after the test meal (Figs. 1 and 2). Male cats had higher postprandial blood glucose concentrations than female cats (Fig. 3; P¼ 0·0071).
Hormone concentrations following the test meal
Insulin concentrations were affected by time (Table 6). The mean insulin concentration showed a tendency to differ between groups (obese v. lean cats; P¼ 0·08) and between diets (HP v. HC diet; P¼ 0·079). Insulin concentrations were significantly higher, compared to baseline, at T0, T60 and T100(Figs. 4 and 5).
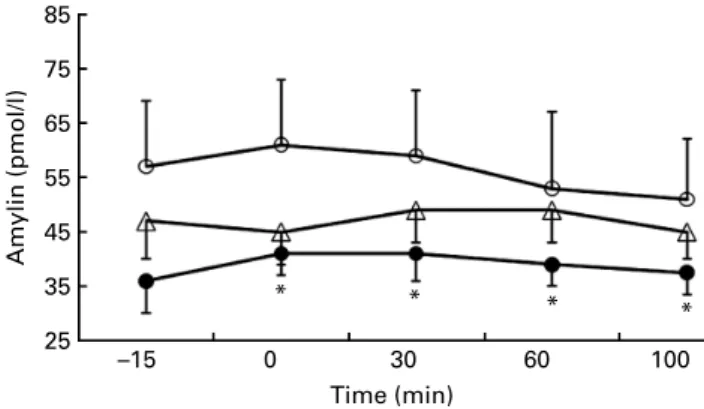
Mean postprandial amylin concentrations were affected by both percentage of BFM and diet but not by time (Table 6). No postprandial increase in plasma amylin was observed (Figs. 6 and 7). The mean postprandial amylin concentration was higher when cats were fed the HP diet v. the HC diet and in obese cats v. lean cats. Moreover, male cats had higher postprandial amylin concentrations than female cats (Fig. 8; P¼ 0·003).
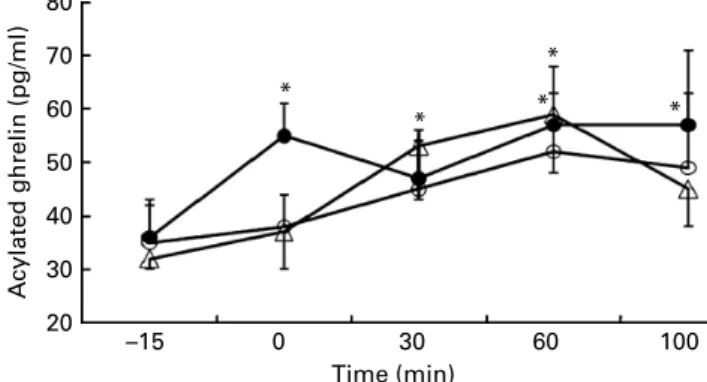
Postprandial acylated ghrelin concentrations were not affected by diet or BFM (Table 6). The mean postprandial acylated ghrelin concentrations rose significantly from baseline whether cats were fed the HP, HF or HC diet. Subsequent concentrations remained significantly higher Table 3. Mean body weight (BW (g)) at the beginning and end of each
diet period
(Mean values and standard deviations)
n Initial SD Final SD DBW (%)* High-protein diet 10 4527 751 4665 734 0·9† High-carbohydrate diet 10 4625 784 4625 799 0·0† High-fat diet 10 4585 767 4680‡ 787 2·0† Lean cats 5 4613 814 4653 796 1·0 Obese cats 5 4613 708 4660 724 1·0 * DBW ð%Þ ¼ ðBWf2BWiÞ=BWf:
† Both lean and obese cats.
‡ Mean final BW within a row, for each diet, was significantly different from the mean initial BW (P, 0·01).
Table 2. Body weight, body fat mass, food and energy intakes of the cats
(Mean values and standard deviations)
n Mean SD Minimum Maximum
Body fat mass (%)
Lean cats 5 28·6 2·4 26·0 32·1 Obese cats 5 37·1* 4·1 34·0 44·3 Body weight (g) HP diet 10 4526 751 3800 5900 HC diet 10 4625 784 3650 5900 HF diet 10 4585 767 3700 5850 Lean cats 5 4590 864 3900 5900 Obese cats 5 4670 781 3800 5550
Amount of food intake (g/d)
HP diet 10 58 8 43 66
HC diet 10 55 10 32 62
HF diet 10 56 8 44 66
Lean cats 5 56 9 32 66
Obese cats 5 56 8 44 66
Energy intake/kg body weight per d (kJ metabolisable energy)
HP diet 10 190 31 167 259
HC diet 10 180 39 138 232
HF diet 10 215† 36 165 272
Lean cats 5 195 44 121 272
Obese cats 5 196 30 143 259
Energy intake/kg fat-free mass per d (kJ metabolisable energy)
HP diet 10 284 46 229 395
HC diet 10 268 54 178 344
HF diet 10 321† 51 226 376
Lean cats 5 272 57 178 375
Obese cats 5 310‡ 44 252 395
HP, high protein; HC, high carbohydrate; HF, high fat.
* Mean values within a column were significantly different from the reference group (HP diet or lean cats; P, 0·01).
† Mean values within a column were significantly different from the reference group (HP diet or lean cats; P, 0·001).
‡ Mean values within a column were significantly different from the reference group (HP diet or lean cats; P, 0·05).
than baseline and in no case returned to preprandial values at 100 min (Fig. 9).
Areas under the curve
Areas under the curve above baseline were calculated for glu-cose, insulin, amylin and acylated ghrelin (data not shown). None of these parameters showed any difference between lean and obese cats. The areas under the curve for blood glu-cose were significantly higher with the HF diet (P, 0·05), but no significant effect of diet composition was found for the areas under the curve of insulin, amylin or acylated ghrelin. Discussion
The present study was intended to examine (i) whether BFM and (ii) diets of different composition would differentially affect the postprandial variations of glucose, insulin, amylin and acylated ghrelin in cats, hormones implicated in food intake and glucose metabolism. The present results showed that postprandial responses were influenced by both the type of diet and body composition.
Cats are metabolically suited to a carnivorous diet, and diet composition had an effect on various parameters measured after the meal challenges. However, no effect of macronutrient composition on baseline concentrations was observed, except for amylin (Table 5).
After the meal challenge, there was only a trend for increase in insulin concentrations (Table 6). Amino acids, especially arginine, have been shown to stimulate insulin secretion in cats(16). Diets containing a high level of protein might, there-fore, produce an increase in postprandial insulin secretion.
The variations in postprandial blood glucose were also affected by the type of diet (Fig. 1). The protein:carbohy-drate ratios differed between the diets with 2·7 for HP, 1·3 for HF and 0·8 for HC. The increase in postprandial blood glucose is the result of several parameters, including carbo-hydrate digestibility. As the HC diet did not lead to increases in both postprandial glucose and insulin concentration, it might be hypothesised that the carbohydrates in the HC diet were mainly low-glycaemic index starches, which did not induce an excessive stimulation of the pancreas. Nonetheless, when the HP and HF diets were compared, the HF diet led to higher blood glucose concentrations than the HP diet. As the HF diet was associated with both an increased in total cholesterol (Table 4) and an elevated postprandial blood glucose concentration, it could be suggested that fatty acids may be used as a substitute for glucose to supply energy. It should be noted that the duration of the follow-up was limited to 100 min after the meal challenge and that the diet might have been incom-pletely digested.
Obesity is known to lead to severe insulin resistance in cats and to increase the risk of type 2 diabetes(17). In the present study, the measured mean BFM in obese cats was similar to that of a previous study(18) despite the fact that different methods (dual-energy X-ray absorptiometry v. isotopic method) were used. The present results showed that obese cats had higher baseline glucose, amylin, acylated ghrelin and leptin concentrations than their lean counterparts. As obese cats are frequently insulin resistant(19), we hypothesised that both basal insulin and postprandial insulin would be higher in obese than in lean cats. We at least observed a tendency that would confirm this hypothesis: Table 4. Biochemistry analysis at the end of each test period
(Mean values and standard deviations)
Mean SD Minimum Maximum Reference ranges
Urea (mmol/l) 6·0 – 10 HP diet 8·4 1·8 6·8 11·7 HC diet 7·2* 1·1 5·0 8·4 HF diet 7·7* 1·2 6·7 10·0 Creatinine (mmol/l) 80 – 180 HP diet 105·2 22·2 53·0 132·5 HC diet 105·6 22·1 61·9 123·8 HF diet 103·4 21·7 61·9 132·6
Alkaline phosphatase (IU)† ,200
HP diet 68·5 21·7 39·0 109·0
HC diet 78·7 30·4 53·0 137·0
HF diet 76·9 24·9 37·0 104·0
Ala amino transferase (IU)† ,80
HP diet 67·1 27·4 43·0 121·5 HC diet 76·4 25·4 41·0 116·0 HF diet 77·1 38·4 41·0 153·0 Cholesterol (mmol/l) ,5·2 HP diet 5·3 2·2 3·4 10·6 HC diet 5·2 1·5 3·4 8·3 HF diet 5·9* 1·3 3·4 7·3 TAG (mg/l) ,17 HP diet 5 2 1 7 HC diet 6 2 3 9 HF diet 5 1 3 7
HP, high protein; HC, high carbohydrate; HF, high fat.
* Mean values within a column were significantly different from the Ref group (HP diet; P, 0·05). † 1 IU ¼ 16·67 nKatal.
glycaemia and amylin concentrations were higher in apparently healthy obese cats than in lean cats, but insulin concentrations tended to be increased in obese cats. The lack of a clear statistical significance in the latter can be explained
by the small number of cats (five) in each group and the large biological variability between individuals.
Few studies have involved measurement of the plasma amylin concentrations in cats after a meal challenge. The mean concentrations in the present study were lower than those measured in a previous paper (50 (SD 27) v. 97
(SD4) pmol/l)(20), but two different commercial feline specific RIA kits were used.
The HP diet induced higher amylin concentrations than the HC diet. Pancreatic amyloid deposition is postulated to participate in the onset of type 2 diabetes in cats. However, a direct relationship between the circulating amylin concen-tration and amyloid deposition in the pancreas has never been demonstrated. Thus, the significance of the higher amylin concentrations with the HP diet requires further investigation.
In the present study, the amylin concentrations (baseline and postprandial) were strongly increased in obese cats, which are also known to be prone to type 2 diabetes. Furthermore, type 2 diabetes seems to be linked to the deposition of amyloid in the pancreatic islets in cats. The main component of pancreatic amyloid is amylin, which is prone to precipitation as pancreatic amyloid in both human subjects and cats, due to a specific amino acid Table 5. Baseline concentrations of blood glucose, insulin, amylin,
acylated ghrelin, insulin-like growth factor 1 (IGF-1) and leptin* (Mean values and standard deviations)
n Mean SD Minimum Maximum
Glucose (mmol/l) HP diet 10 5·7 1·4 3·9 8·3 HC diet 10 5·7 1·2 3·9 7·8 HF diet 10 5·7 1·4 3·9 8·9 Lean cats 5 5·1 0·5 3·9 8·3 Obese cats 5 5·9† 1·2 3·9 8·9 Insulin (mIU/ml)§ HP diet 10 6·7 3·2 2·0 13·0 HC diet 10 6·4 2·9 3·0 12·0 HF diet 10 7·6 2·3 4·0 11·0 Lean cats 5 6·8 2·5 2·0 11·0 Obese cats 5 7·0 3·1 4·0 13·0 Amylin (pmol/l) HP diet 10 57 37 22 151 HC diet 10 39† 21 8 73 HF diet 10 49 22 21 94 Lean cats 5 41 21 8 73 Obese cats 5 56† 32 18 151 Acylated ghrelin (pg/ml) HP diet 10 35 24 10 97 HC diet 10 37 10 26 60 HF diet 10 37 10 26 60 Lean cats 5 30 8 10 42 Obese cats 5 39† 20 19 97 Leptin (ng/ml) HP diet 10 8 5 3 19 HC diet 10 8 3 3 15 HF diet 10 8 3 5 17 Lean cats 5 6 2 3 9 Obese cats 5 9‡ 5 5 19 IGF-1 (ng/ml) HP diet 10 432 172 273 865 HC diet 10 531 139 341 760 HF diet 10 463 189 257 910 Lean cats 5 455 123 284 658 Obese cats 5 495 206 257 910
HP, high protein; HC, high carbohydrate; HF, high fat.
* Baseline concentrations were assayed in plasma samples before each test meal. † Mean values within a column were significantly different from the reference group
(HP diet or lean cats; P, 0·05).
‡ Mean values within a column were significantly different from the reference group (HP diet or lean cats; P, 0·01). § 1 mIU insulin/ml ¼ 0.139 pmol insulin/l. § 1 mIU insulin/ml ¼ 0·139 pmol insulin/l.
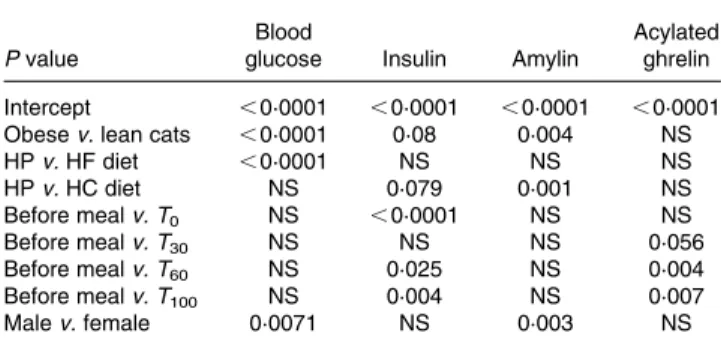
Table 6. Statistical analysis of the data after the test meal (linear mixed-effects model fitted by restricted maximum likelihood)
P value
Blood
glucose Insulin Amylin
Acylated ghrelin
Intercept ,0·0001 ,0·0001 ,0·0001 ,0·0001
Obese v. lean cats ,0·0001 0·08 0·004 NS
HP v. HF diet ,0·0001 NS NS NS HP v. HC diet NS 0·079 0·001 NS Before meal v. T0 NS ,0·0001 NS NS Before meal v. T30 NS NS NS 0·056 Before meal v. T60 NS 0·025 NS 0·004 Before meal v. T100 NS 0·004 NS 0·007 Male v. female 0·0071 NS 0·003 NS
HP, high-protein diet; HF, high-fat diet; HC, high-carbohydrate diet.
* * † † † † † 8 7 6 5 4
Blood glucose (mmol/l)
–15 0 30
Time (min)
60 100
Fig. 1. Blood glucose concentrations following the test meal – differences between diets; high-protein diet (W), high-carbohydrate diet (X) and high-fat (HF) diet (K). No significant variation in postprandial blood glucose was observed after the test meal. * Mean value was significantly different from baseline (2 15 min; P, 0·05). † Mean value was significantly different from the HF diet (P, 0·05). * * * * * 8 7 6 5 4
Blood glucose (mmol/l)
–15 0 30
Time (min)
60 100
Fig. 2. Blood glucose concentrations following the test meal – differences between lean (X) and obese cats (W). * Mean value was significantly different from that of lean cats (P, 0·001).
sequence. An increase in plasma amylin concentrations was observed in obese insulin-resistant human subjects(21), and amylin levels may also be elevated in the early stages of feline diabetes(20). It remains unknown whether elevated amylin concentrations can lead to the development of type 2 diabetes, but an increased local amylin concentration in the pancreatic islets appears to be a prerequisite for amyloid precipitation.
It is well known that the risk of developing type 2 diabetes mellitus is higher in male than in female cats(22). A recent paper(23) showed that sex was one of the most significant putative risk factors for the development of type 2 diabetes mellitus in cats. Obesity associated with neutering was also an important factor for diabetes mellitus development. Interestingly, we found that blood glucose and amylin concentrations were higher in male cats than in female cats, independent of BFM. This result is in agreement with other reports and is consistent with the fact that neutered male cats are more prone to diabetes mellitus.
To our knowledge, this is the first study to provide data about acylated ghrelin secretion after a meal challenge in cats. We hypothesised that postprandial acylated ghrelin would be suppressed immediately after food consumption in all three groups, but no suppression was observed
and there was even a significant increase in acylated ghrelin concentration. Moreover, in the present study, postprandial acylated ghrelin concentrations were not affected by the type of diet. This result is not in accordance with findings in human subjects fed either a fat-rich meal or a protein-rich meal(24). However, the results of studies on the effect of diet composition on ghrelin secretion, especially in human subjects and rodents, remain conflicting. Ghrelin secretion is known to be controlled by nutrient composition, but it is not clear which factors are directly involved in the regulation of this secretion. Indeed, in some studies, plasma ghrelin concentration was decreased by a high-lipid meal and increased by a low-protein meal(24). It was also shown that both fat and protein led to higher postprandial ghrelin concentrations in human subjects(25), whereas in another study(10), glucose and amino acids suppressed ghrelin secretion more rapidly and strongly than lipids in human subjects and rats. Ghrelin levels were also increased in the fasting state and decreased after a glucose load but were not decreased after an arginine or NEFA load in normal human subjects(26). It seems, therefore, that blood glucose levels might be critical in controlling ghrelin release.
Little is known about the control of ghrelin release in cats. Only one previous study(14) has been published, but the
* * * * 85 75 65 55 Amylin (pmol/l) 45 35 25 –15 0 30 Time (min) 60 100
Fig. 6. Amylin concentrations following the test meal – differences between diets; high-protein (HP) diet (W), high-carbohydrate diet (X) and high-fat diet (K). * Mean value was significantly different from the HP diet (P,0·05). No postprandial increase in plasma amylin was observed.
* * * * *† † 13 12 11 10 9 8 Insulin ( µ IU/ml) 7 6 5 –15 0 30 Time (min) 60 100
Fig. 5. Insulin concentrations following the test meal – there was no difference between lean (X) and obese cats (W). 1 mIU insulin/ml ¼ 0·139 pmol insulin/l. * Mean value was significantly different from baseline (215 min; P,0·05). † Mean value was significantly different from that of lean cats (P,0·05). * * * * * 8 7 6
Blood glucose (mmol/l)
5
4
–15 0 30
Time (min)
60 100
Fig. 3. Blood glucose concentrations following the test meal – differences between female (X) and male cats (W). * Mean value was significantly different from that of female cats (P, 0·01).
* † † * 13 12 11 10 9 8 Insulin ( µ IU/ml) 7 6 5 4 –15 0 30 Time (min) 60 100
Fig. 4. Insulin concentrations following the test meal – differences between diets; high-protein (HP) diet (W), high-carbohydrate diet (X) and high-fat diet (K). 1 mIU insulin/ml ¼ 0·139 pmol insulin/l. * Mean value was significantly different from baseline (2 15 min; P, 0·05). † Mean value was significantly different from the HP diet (P, 0·05).
conditions were different and no meaningful comparison can be made with the present results.
Ghrelin concentrations after a meal challenge have been reported to differ between obese and lean individuals(27). When considered individually, lean and obese cats also showed different patterns of responses to acylated ghrelin secretion (Fig. 10). In human subjects, plasma ghrelin concen-trations tend to be low in obese patients and high in lean sub-jects(25). This was not confirmed in the present study on cats as baseline concentrations were increased in obese cats.
With regard to the total amount of food spontaneously consumed with the three diets, the higher baseline acylated ghrelin in obese cats was not associated with a higher food intake. This could indicate that acylated ghrelin is not correlated with the initiation of eating, originally postulated to be one physiological action of ghrelin. In fact, a recent study on human subjects has shown that food intake during the day could not be predicted from the total ghrelin concen-tration in the morning(27). Moreover, as ghrelin levels in human subjects increase during the night without any relation to food intake, further studies are required to define the role of ghrelin in meal initiation. In a recent paper(28), a medium-fat meal in human subjects (12 % protein, 27 % fat and 61 % carbohydrates) induced a better postprandial metabolic nutri-ent balance and appetite suppression than a high-fat meal (12 % protein, 52 % fat and 36 % carbohydrates). Moreover,
gastrointestinal hormones (peptide YY, cholecystokinin, glu-cagon-like peptide 1 and ghrelin) were not related to clinically assessed hunger suppression after either meal. Hence, the post-prandial increase of acylated ghrelin in cats suggests that ghre-lin may not be an orexigenic factor in cats. Nevertheless, further investigations are clearly needed to better understand its effect in this species.
Although fat is generally known to enhance food palatability in cats(29), the cats in the present study did not consume more food when given the HF diet than the other diets. However, due to the higher energy density of the HF diet, the total energy intake was increased. This was associated with a significant BW gain.
Lean and obese cats spontaneously consumed the same amount of food and had the same energy intake when expressed as per day or per kg BW. However, when expressed as per kg FFM, energy intake was significantly higher in obese cats than in lean cats. As energy expenditure is mainly related to FFM, it is essential to consider body composition to understand energy intake in animals. In a recent study(17), obese cats have consumed significantly less food than lean cats to maintain their BW and have produced less heat after eating than lean cats. If the cats in the present study behaved similarly, the excess body fat despite the apparently comparable food intake might be explained by a higher energy intake per kg FFM associated with a decreased BMR.
†* * * * † Acylated ghrelin (pg/ml) 25 –15 0 30 Time (min) 60 100 35 45 55 65 75 85
Fig. 10. Acylated ghrelin concentrations following the test meal meal – differ-ences between lean (X) and obese cats (W). * Mean value was significantly different from baseline (2 15 min; P, 0·05). † Mean value was significantly different from lean cats (P, 0·05).
* * * * * 80 70 60 50 40 Acylated ghrelin (pg/ml) 30 20 –15 0 30 Time (min) 60 100
Fig. 9. Acylated ghrelin concentrations following the test meal – differences between diets; high-protein diet (W), high-carbohydrate diet (X) and high-fat diet (K). * Mean value was significantly different from baseline (215 min; P, 0·05). * * * * * Amylin (pmol/l) 65 55 45 35 60 70 50 40 30 25 –15 0 30 Time (min) 60 100
Fig. 7. Amylin concentrations following the test meal – difference between lean (X) and obese cats (W). * Mean value was significantly different from that of lean cats (P, 0·001).
* * * * * Amylin (pmol/l) 65 55 45 35 60 50 40 30 25 –15 0 30 Time (min) 60 100
Fig. 8. Amylin concentrations following the test meal – female (X) and male cats (W). * Mean value was significantly different from that of female cats (P, 0·01).
The diets had only a mild effect on the measured biochemical parameters and only two parameters were signifi-cantly modified: total cholesterol; blood urea. Blood urea was significantly higher with the HP diet but remained within the reference ranges. As cats are able to adapt their protein oxidation(30), an increase in dietary intake will lead to higher urea synthesis without changing the creatinine levels. When cats were fed the HF diet, blood glucose and total cholesterol concentrations were increased but not TAG. Such a finding has been previously reported(31), suggesting that fatty acids may be used as a substitute for glucose to supply energy in cats.
In conclusion, the present study clearly showed that obesity was the main factor implicated in modification of the postprandial responses of hormones involved in glucose metabolism, food intake and BW control in cats. A complex effect of diet composition on hormonal secretion was observed. However, despite the strictly carnivorous nature of feline species, from a hormonal point of view, the HP diet, compared with the other diets in the present study, did not seem to confer a real advantage for preventing obesity in cats. Obese cats showed significantly higher postprandial responses of blood glucose, insulin and amylin concentrations, but not ghrelin, than lean cats. The present study provides the first results for postprandial ghrelin concentrations in cats and reveals several discrepancies with previous reports in human subjects and rodents. As very few studies have been conducted in cats, further investigations are required to better understand the effect of ghrelin in this species. Interestingly, independent of BFM, male cats showed higher postprandial blood glucose and amylin responses than their female counterparts, thereby emphasising the role of sex in diabetes mellitus disposition.
Acknowledgements
There were no conflicts of interest for any of the authors in the production of the present paper. L. J. M. M. brought up the idea for the study and was the principal investigator. The manuscript was written by L. J. M. M. The other authors contributed to the conception and design of the experiment and were involved in critically revising the paper and approved the final version. There were no external sources of funding.
References
1. Broberger C (2005) Brain regulation of food intake and appetite, molecules and networks. J Intern Med 258, 301 – 327. 2. Chaudhri O, Small C & Bloom S (2006) Gastrointestinal
hormones regulating appetite. Philos Trans R Soc Lond B Biol Sci 361, 1187 – 1209.
3. Gauna C, Kiewiet RM, Janssen JA, et al. (2007) Unacyled ghrelin acts as a potent insulin secretagogue in glucose-stimulated conditions. Am J Physiol Endocrinol Metab 293, E697 – E704.
4. Klok MD, Jakobsdottir S & Drent ML (2007) The role of leptin and ghrelin in the regulation of food intake and body weight in humans, a review. Obes Rev 8, 21 – 34.
5. Ahima RS & Lazar MA (2008) Adipokines and the peripheral and neural control of energy balance. Mol Endocrinol 22, 1023 – 1031.
6. Kalra SP (2008) Central leptin insufficiency syndrome, an interactive etiology for obesity, metabolic and neural diseases and for designing new therapeutic interventions. Peptides 29, 127–138. 7. Ariyasu H, Takaya K, Hosoda H, et al. (2002) Delayed short-term secretory regulation of ghrelin in obese animals, evidenced by a specific RIA for the active form of ghrelin. Endocrinology 143, 3341 – 3350.
8. Lutz TA & Geary N (2006) The gut – brain axis in the control of eating. Appetite and body weight, integrative systems and the development of anti-obesity drugs. In Appetite and Bodyweight: Integrative Systems and the Development of Anti-Obesity Drugs [SJ Cooper and TC Kirkham, editors]. London: Associated Press: Elsevier.
9. Sanke T, Hanabusa T, Nakano Y, et al. (1991) Plasma islet amyloid polypeptide amylin levels and their responses to oral glucose in type 2 non-insulin-dependent diabetic patients. Diabetologia 34, 129 – 132.
10. Gil-Campos M, Aguilera CM, Can˜ete R, et al. (2006) Ghrelin, a hormone regulating food intake and energy homeostasis. Br J Nutr 96, 201 – 226.
11. Zoran DL (2002) The carnivore connection to nutrition in cats. J Am Vet Med Assoc 221, 1559 – 1567.
12. Ferrier L, Robert P & Dumon H (2002) Evaluation of body composition in dogs by isotopic dilution using a low-cost technique, Fourier-transform infrared spectroscopy. J Nutr 132, Suppl., 1725S – 1727S.
13. Martin LJ, Siliart B, Dumon HJ, et al. (2006) Spontaneous hormonal variations in male cats following gonadectomy. J Feline Med Surg 8, 309 – 314.
14. Backus RC, Cave NJ & Keisler DH (2007) Gonadectomy and high dietary fat but not high dietary carbohydrate induce gains in body weight and fat of domestic cats. Br J Nutr 98, 641 – 650. 15. Ida T, Miyazato M, Naganobu K, et al. (2007) Purification and characterization of feline ghrelin and its possible role. Domest Anim Endocrinol 32, 93 – 105.
16. Kitamura T, Yasuda J & Hashimoto A (1999) Acute insulin response to intravenous arginine in nonobese healthy cats. J Vet Intern Med 13, 549 – 556.
17. Appleton DJ, Rand JS & Sunvold GD (2001) Insulin sensitivity decreases with obesity, and lean cats with low insulin sensitivity are at greatest risk of glucose intolerance with weight gain. J Feline Med Surg 3, 211 – 218.
18. Appleton DJ, Rand JS & Sunvold GD (2000) Plasma leptin con-centrations in cats: reference range, effect of weight gain and relationship with adiposity as measured by dual energy X-ray absorptiometry. J Feline Med Surg 2, 191 – 199.
19. Hoenig M, Jordan ET, Ferguson DC, et al. (2009) Oral glucose leads to a differential response in glucose, insulin, and GLP-1 in lean versus obese cats. Domest Anim Endocrinol (In the Press). 20. Lutz TA & Rand JS (1996) Plasma amylin and insulin concen-trations in normoglycemic and hyperglycemic cats. Can Vet J 37, 27 – 34.
21. Enoki S, Mitsukawa T, Takemura J, et al. (1992) Plasma islet amyloid polypeptide levels in obesity, impaired glucose tolerance and non-insulin-dependent diabetes mellitus. Diabetes Res Clin Pract 15, 97 – 102.
22. Kley S, Hoenig M, Glushka J, et al. (2009) The impact of obes-ity, sex, and diet on hepatic glucose production in cats. Am J Physiol Regul Integr Comp Physiol 296, R936 – R943. 23. McCann TM, Simpson KE, Shaw DJ, et al. (2007) Feline
diabetes mellitus in the UK: the prevalence within an insured cat population and a questionnaire-based putative risk factor analysis. J Feline Med Surg 9, 289 – 299.
24. Erdmann J, To¨psch R, Lippl F, et al. (2004) Postprandial response of plasma ghrelin levels to various test meals in relation to food intake, plasma insulin, and glucose. J Clin Endocrinol Metab 89, 3048 – 3054.
25. Kojima M, Hosoda H & Kangawa K (2004) Clinical endocrinology and metabolism. Ghrelin, a novel growth-hormone-releasing and appetite-stimulating peptide from stomach. Best Pract Res Clin Endocrinol Metab 18, 517 – 530. 26. Broglio F, Gottero C, Benso A, et al. (2003) Effects of ghrelin on the insulin and glycemic responses to glucose, arginine, or free fatty acids load in humans. J Clin Endocrinol Metab 88, 4268 – 4272.
27. Votruba SB, Kirchner H, Tscho¨p M, et al. (2009) Morning ghrelin concentrations are not affected by short-term overfeeding and do not predict ad libitum food intake in humans. Am J Clin Nutr 89, 801 – 806.
28. Maffeis C, Surano MG, Cordioli SM, et al. (2009) High-fat vs. a moderate-fat meal in obese boys: nutrient balance, appetite,
and gastrointestinal hormone changes. Obesity (Silver Spring) (In the Press).
29. Fekete SG, Fodor K, Proha´czik A, et al. (2005) Comparison of feed preference and digestion of three different commercial diets for cats and ferrets. J Anim Physiol Anim Nutr 89, 199 – 202.
30. Green AS, Ramsey JJ, Villaverde C, et al. (2008) Cats are able to adapt protein oxidation to protein intake provided their requirement for dietary protein is met. J Nutr 138, 1053 – 1060.
31. Thiess S, Becskei C, Tomsa K, et al. (2004) Effects of high carbohydrate and high fat diet on plasma metabolite levels and on i.v. glucose tolerance test in intact and neutered male cats. J Feline Med Surg 6, 207 – 218.