L2TR chromosome by
in silico
analyses
Franc¸ois Collyn, Claude-Alain H. Roten & Lionel Guy
D ´epartement de Microbiologie Fondamentale, Facult ´e de Biologie et M ´edecine, Universit ´e de Lausanne, Switzerland
Correspondence: Lionel Guy, D ´epartement de Microbiologie Fondamentale, Facult ´e de Biologie et de M ´edecine, Universit ´e de Lausanne, Quartier UNIL-Sorge, Baˆtiment Biophore, CH-1015 Lausanne, Switzerland. Tel.: 141 21 692 5628; fax: 141 21 692 5605; e-mail: [email protected]
Received 10 January 2007; revised 5 March 2007; accepted 6 March 2007.
First published online 18 April 2007. DOI:10.1111/j.1574-6968.2007.00714.x Editor: Oscar Kuipers
Keywords
genometrics; cumulative nucleotide skews; chromosome architecture; genome assembly; Idiomarina loihiensis .
Abstract
Nucleotide composition analyses of bacterial genomes such as cumulative GC skew highlight the atypical, strongly asymmetric architecture of the recently published chromosome of Idiomarina loihiensis L2TR, suggesting that an inversion of a 600-kb chromosomal segment occurred. The presence of 3.4-kb inverted repeated sequences at the borders of the putative rearrangement supports this hypothesis. Reverting in silico this segment restores (1) a symmetric chromosome architecture; (2) the co-orientation of transcription of all rRNA operons with DNA replication; and (3) a better conservation of gene order between this chromosome and other g-proteobacterial ones. Finally, long-range PCRs encompassing the ends of the 600-kb segment reveal the existence of the reverted configuration but not of the published one. This demonstrates how cumulative nucleotide-skew analyses can validate genome assemblies.
Introduction
In bacteria, bidirectional DNA replication divides circular chromosomes into two arms or replichores (Blattner et al., 1997), delimited by the origin and terminus of replication. Thus, each strand of the double-stranded chromosome is the leading strand of replication on one arm, and the lagging one on the other. The process of replication generates asymmetric nucleotide biases (i.e. different for each DNA strand): directly, by favoring some mutations on one strand, and/or indirectly, since the leading strand encodes most genes (see Frank & Lobry, 1999; Rocha, 2004 for review). More precisely, the leading strand is generally enriched in guanines and depleted in cytosines and, consequently, the lagging strand is enriched in cytosines and depleted in guanines. These biases may be determined by a GC skew, which measures the ratio between the number of guanines and the number of cytosines [(G C)/(G1C)] on one strand. Due to its guanine enrichment, the leading strand thus presents a positive GC skew and, depleted in guanines, the lagging strand presents a negative GC skew (Lobry, 1996). Therefore, a graphic representation of cumulative GC skews along the chromosome unambiguously reveals localization of the origin and terminus of replication in a
large majority of bacterial chromosomes. On this plot, the guanine-rich leading strand displays a positive slope and the guanine-poor lagging strand a negative slope; thus, the origin and terminus of replication correspond to the mini-mum and maximini-mum of the curve, respectively (Grigoriev, 1998; Frank & Lobry, 2000; Guy & Roten, 2004). Because the length of both replichores is generally similar, and because the published chromosomal sequences generally start at the origin of replication, cumulative GC skew plots of most bacteria present a smooth inverted V-shape (see Fig. 1a, right) (Grigoriev, 1998; Roten et al., 2002).
Homologous recombination occurring between inverted sequences – such as rRNA genes or insertion sequences (IS) – is responsible for most chromosomal inversions. These events can be divided into three categories: (1) symmetrical or (2) asymmetrical inter-arm inversions, and (3) intra-arm inversions. Inter-arm rearrangements are symmetrical (1) when the homologous sequences involved in the recombi-nation are at a similar distance from the origin of replication on each arm of the chromosome. Such rearrangements conserve the inverted V-shape on cumulative GC skew plots, since the length of the arms, the leading or lagging status of the strands and gene orientation relative to replication are conserved. Asymmetrical inter-arm recombination (2) is
similar to (1) (it does not affect the leading or lagging status of the strands nor the gene orientation relative to replica-tion), except that the two inverted recombination sites on each arm of the chromosome are at a different distance from the origin, thus changing the relative lengths of the arms
once the rearrangement occurred. As a result, the displaced terminus is not at the middle of the cumulative GC skew plot, which presents an asymmetrical inverted V-shape, i.e. one branch of the inverted ‘V’ is longer than the other. Finally, some chromosomal inversions occur within a single
• • • • • • • • • • • • • • • • • • • • • • • • • • • • • • • • • • • • •• • • • • • • • • • • • • • • • • • • • • • • • • • • • • • • • • • • • • • • • • • • • •• • • • • • • • • • • • • • • • •• • • • • • • • • • • • • • • • • • • • • • • • • • • • • • • • • • • • • • • • • • • • • • • • • • • • • • • • •• • • • • • •• • • • • • • • • • • • • • • • • • • • • • • • • • • • • • • • • • • • • • • • • • • • • •• • • • • • • • • • • • • • • • • • • • • • • • • • • • • • • • • • • • • • • • • • • • • • • • • • • • • • • • • • • • • • • • • • • • • • • • • • • • • • • • •• • • • • • • • • • • • • • • • • • • • • • • • • • • • • • • • • • • • •• • • • • • • • • • • • • • • • • • • • • • • • • • • • • • • • • • • • • • • • • • • • • • • • • • • • • • • • • • • • • • • • • • • • • • • • • • • • • • • • • • • • • • • • • • • • • • • • • • •• • • • • • • • • • • • • • • • • • • • • • • • • • • • • • • • • • • • • • • • • • • •• • • • • I. loihiensis configuration I (Mb) Cumulative GC skew [(G–C)/G+C)] I. loihiensis configuration II (Mb) 0 0.5 1 1.5 2 2.5 0 0.5 1 1.5 2 2.5 0 1 2 3 4 5 0.5 1 1.5 2 2.5 3 0 S. oneidensis (Mb) V. parahaemolyticus chr. I (Mb) (a) (b) – 80 – 60 60 80 100 – 40 – 20 – 20 40 40 20 20 0 0 • • • • • • • • • • • • • • • • • • • • • • • • • • • • • • • • • • • • • • • • • • • • • • • • • • • • • • • • • • • • • • • • • • • • • • • • • • • • • • • • • • • • • • • • • • • • • • • • • • • • • • • •• • • • • • • • • • • • • • • • • • • • • • • • • • • • • • • • • • • • • • • • • • • • • • • • • • • • • • •• • • • • • • • • • • • •• • • • • • • • • • • • • • • • • • • • • • • • • • • • • • • • • • • • • • • • • • • • • • • • • • • • • • • • • • • • • • • • • • • • • • • • • • • • • • • • • • • • • • • • • • • • • • • • • • • • • • • • • • • • • • • • • • • • • • • • • • • • • • • • • • • • • • • • • • • • • • • • • • • • • • • • • • • • • • • • • • • • • • • • • • • • • • • • • • • • • • • • • • • • • • • • • • • • • • • • • • • • • • • • • • • • • • • • • • • • • • • • • • • • • • • • • • • • • • • • • • • • • • • • • • • • • • • • • • •• • • • • • • • • • • • • • • • • • • • • • • • • • • • • • • • • • • • • • • • •• • • • • • • • • • • • • • • • • • • • • • • • • • • • • • • • • • • • • • • • • • • • • • • • • • • • • • • • • • • • • • • • • • • • • • • • • •• • • • • • • • • • • • • • • • • • • • • • • • • • • • • •• • • • • • • • • • • •• • • • • • • • • • • • • • • • • • • • • • • • • • • • • • • • • • • • • • • • • • • • • • • • • • • • • • • • • • • • • • • • • • • •• • • • • • • • • • • • •• • • • • • • • • • • • • • • • • • • • • • • • • • • • • • • • • • • • •• • • • • • • • • • • • • • • • • • • • • • • • • • • • • • • • • • • • • • • • • • • • • • • • • • • • • • • • • • • • • • • • • • • • • • • • • • • • • • • • • • • • • • • • • • • • • • • • •• • • • • • • • • • • • • • •• • • • • • •• • • • • • • • • • • • • • • • • • • • • • • • • •• • • • • •• • • • • • • • • • • • • • • • • • • • • • • • • • • • • • • • • • • • • • • • • • • • • • • • • • • • • • • • • • • • • • • • • • • •• • • • • • • • • • • • • • • • • • • • • • • • • • • • • • • •• • • • • • • • • • • • •• • • • • • • • • • • • • • • • • • • • • • • • • • • • • • • • • • • • • • • • • • • • • • • • • • • • • • • • • • • • • • • • • • • • • • • • • • • • • • • • • • • • • • • • •• • • • • • •• • • • • • • • • • • • • • • • • • • • • • • • • • • • • • • • • • • • • • • • • • • • • • • • • • • • • • • • • • • • • • • • • • • • • • • • • • • • • • • • • • • • • • • • • • • • • • • • • • • • • • • • • • •• • • • •• • • • • • • • • • • • • • • • • • • • • • • • • • • • • • • • • • • • • • • • • • • • • • • • • • • • • • • • • • • •• • • • •• • • •
arm of the chromosome (3), exchanging a guanine-rich leading strand for a guanine-poor lagging strand. The resulting slope of the inversion is opposite, locally disrupt-ing the symmetrical inverted V-shape, and thus enabldisrupt-ing a straightforward detection of such events on cumulative nucleotide skew curves.
Systematic GC skew analyses of more than 400 published bacterial chromosome sequences reveal that asymmetrical inter-arm and intra-arm rearrangements are rare [see Comparative Genometrics website, http://www.unil.ch/ comparativegenometrics/ (Roten et al., 2002)]. For instance, Pseudomonas aeruginosa PAO1 and Xylella fastidiosa 9a5c chromosomes display significantly asymmetrical arm lengths, revealing an inter-arm inversion (2) (Stover et al., 2000; Van Sluys et al., 2003). In the case of P. aeruginosa, it appears that the sequenced isolate was not representative of the major bacterial population, which displays classical symmetrical chromosome architecture (Barekzi et al., 2000). In the case of X. fastidiosa, a complex rearrangement involving prophages could be the source of the asymmetry in the 9a5c strain (Canchaya et al., 2004). This asymmetry is absent in the Temecula1 strain. Similarly, intra-arm inver-sions were mostly reported in the highly unstable chromo-some of Yersinia pestis (Parkhill et al., 2001; Deng et al., 2002), but these events seem to be associated with the genome-reduction phase presently occurring in Y. pestis and due to the restriction of its host range (Wren, 2003). In summary, it clearly appears that, when inversions occur, they are most often centered on the origin of replication. This suggests that chromosome configurations presenting replichores of similar lengths and a conservation of gene orientation with respect to replication are favored (Eisen et al., 2000; Tillier & Collins, 2000; Kothapalli et al., 2005). Consequently, cumulative skew curves different from symmetric inverted V-shapes reveal atypical chromosome configurations.
The Comparative Genometrics database (Roten et al., 2002), dedicated to the analysis of whole prokaryotic genomes, includes the nucleotide skew curves for all bacter-ial chromosomes available at the NCBI database (Wheeler et al., 2004). It enables the detection of chromosomes dis-playing atypical nucleotide skew patterns, such as the one of Idiomarina lohiensis L2TR, isolated from hydrothermal
vents in Hawaii. This deep-sea Gammaproteobacterium, able to grow in a wide range of temperatures and salinities, seems to draw its energy mostly from amino-acids fermentation, rather than from usual sugar degradation pathways. In this contribution, this atypical chromosome architecture was precisely characterized.
Materials and methods
Sequences and document availability
Shewanella oneidensis MR-1 and the chromosome 1 of Vibrio parahaemolyticus RIMD 2210633 sequences are avail-able on the NCBI website (http://www.ncbi.nlm.nih.gov/) under accession numbers NC_004347 and NC_004603, respectively. Idiomarina loihiensis L2TR fasta sequences (first published under accession number NC_006512) and nucleotide counts per 1-kb window for both configurations are available at http://www.unil.ch/comparativegenometrics/ idiomarina/index.htm.
Nucleotide skews
The sequence was divided in 1-kb windows and the GC skew [(G C)/(G1C)] was calculated for each window. The cumulative GC skew corresponding to the window i is the cumulation of the GC skews from the beginning of the sequence to the window i (Grigoriev, 1998).
Identification of repeats
The chromosome sequence of I. loihiensis was searched for direct and inverted repeats longer than 200 bp with REPuter (Kurtz & Schleiermacher, 1999).
Gene -order conservation analysis by X-plot The chromosome sequence of I. loihiensis L2TR was com-pared with the chromosome of two related bacteria: the chromosome of S. oneidensis MR-1 and the chromosome 1 of V. parahaemolyticus RIMD 2210633. Sequences homo-logous in genome pairs were identified with PROMER, a
program of theMUMMER3.18 package (Kurtz et al., 2004): a
maximal 50-nt gap allowed between two adjacent matches
Fig. 1. Nucleotide skews and plots of relative positions of homologous sequences (colinearity) in Idiomarina loihiensis and related species. In both panels, the originally published sequence (configuration I) of I. loihiensis chromosome is on the left column, and the proposed symmetrical configuration II is on the right column. Vertical bars indicate putative rearrangements sites, which coincide with inverted repeated sequences. Location on chromosomes is given in Mb (x-axis on both panels, and y-axis in b). (a) Cumulative GC skew of both configurations. Scale indicates the cumulative excess of guanine over cytosine: [(G C)/(G1C)], calculated in 1-kb windows. (b) Gene-order conservation analysis (X-plot) by comparison of relative positions of homologous sequences in I. loihiensis and closely related bacteria Shewanella oneidensis and Vibrio parahaemolyticus chr. 1. The pairs of homologous sequences are represented on the plot at the intersection of their position on I. loihiensis (x-axis) and S. oneidensis (y-axis, top panel) or V. parahaemolyticus (y-axis, bottom panel) genomes by a black cross if the segment is on the same strand on both chromosomes, and by a red circle if they are on complementary strands.
was selected, combined with a maximal 100-nt extension and a maximal distance of extension attempts of 100 nt. A direct hit is a homologous segment that is located on the same strand (1/1 or / ) on both compared bacteria, an indirect hit is when paired sequences are located on com-plementary strands (1/ or /1). Quality measurement of the X-plots is obtained by correlating the distances of each hit (whether direct or indirect) from the origin of replica-tion on both genomes and by calculating Pearson’s correla-tion coefficient. Comparing a genome with a related strain that has undergone only inversions centered on the origin of replication provides a Pearson’s correlation coefficient close to one. Comparing two genomes whose gene orders are completely different provides a coefficient close to zero. Long-range PCRs
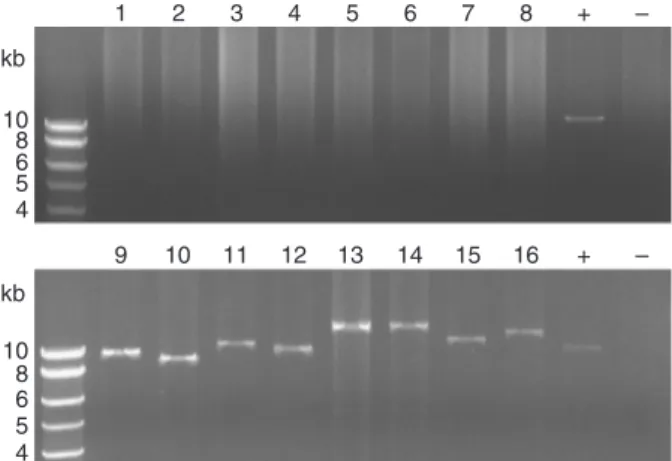
The Expand Long Template PCR System (Roche) was used to amplify large chromosomal segments. Eight primer sets were used for detecting each configuration (Supplementary Tables S1 and S2). Amplifications were performed according to manufacturer recommendations, with 500 ng of genomic DNA and at a 58 1C annealing temperature. A single common mix containing water, DNA template, PCR buffer, nucleotides and enzyme was used for the 18 PCR reactions. Primers amplifying a 11-kb region encoding general meta-bolism genes and located outside the 0.6-Mb chromosomal inversion were used as a positive control and water instead of primers as a negative control.
Results and discussion
The cumulative GC skew curve performed on the 2.8-Mb-long chromosome of I. loihiensis L2TR (Hou et al., 2004) displays a nonsymmetrical pattern (Fig. 1a, left), whereas those of almost all other Gammaproteobacteria are classical (Supplementary Fig. S1) as discussed above. In the case of I. loihiensis L2TR, the curve displays three local extrema: in addition to the usual overall cumulative GC skew maximum at 0.7 Mb, there is a local minimum at 1.3 Mb and a local maximum at 1.4 Mb (Fig. 1a, left). Following the reasonable hypothesis that the terminus of replication is actually located approximately at the middle of the curve, on the local maximum at 1.4 Mb, then the 600-kb chromosome segment located between the two inflexion points of the curve located at 0.7 and 1.3 Mb displays an opposite slope orientation than expected, suggesting a large DNA inversion. Confirming this view, inverted repeated (IR) sequences of 3.4 kb were identified at the boundaries of the putative inversion. These IRs are located between positions 688 321 and 691 693 on one end, and between positions 1 335 927 and 1 332 555 on the other. They display 3349 identical bases out of 3373 and contain genes encoding
proteins involved in general metabolism (IL631 to IL633 and IL1241 to IL1243) and an IS2 transposase (IL633.1 and IL1239.1). They are the longest IR sequences in the I. loihiensis chromosome, rRNA operons excepted. Because they could be recognized by the homologous recombination machinery, these regions might be directly involved in an intra-arm inversion, explaining the atypical skew pattern of the published I. loihiensis sequence. On the other hand, unusually long homologous sequences may also be the source of contig misassemblies. To sum up, since asymme-trical rearrangements are not favored, the existence of a symmetrical chromosome configuration (configuration II), in which the 600-kb DNA segment bordered by the IR is inverted, is proposed.
An in silico inversion of this region was consequently performed and both I. loihiensis chromosome configurations were compared to other Gammaproteobacteria counterparts. Several elements support that the symmetrical configuration II of this study is more likely to be present in natural conditions. First of all, the cumulative GC skew curve resulting from the proposed configuration II now displays a symmetrical inverted V-shape (Fig. 1a, right). UsingBLAST
analysis (word as 7 and standard gap penalties) (Altschul et al., 1990), we also detected starting at position 1 387 610 (i.e. around the middle of the sequence), a 28-nt sequence (ATTGCGTATAATGTATATTATGTTAAAT) that has 25 nu-cleotides in common with the Escherichia coli K-12 dif sequence. In the latter bacteria, the dif sequence is involved in the resolution of chromosome dimers, which occurs in the terminus region and is apparently well conserved throughout the bacterial phylogenetic tree (for review see Lesterlin et al., 2004). The presence of this sequence supports the proposi-tion made above that, as in the large majority of bacterial chromosomes, the terminus of replication is localized at the maximum of the cumulative GC skew curve in the symme-trical configuration II. Moreover, the terminus of replication is actually at the middle of the chromosome sequence, separating it into two replichores of similar sizes. Another supporting piece of evidence, given that the terminus was correctly identified at 1.4 Mb, is that one out of four rRNA operons would be antioriented – i.e. transcribed in the opposite direction than the replication – in the published configuration, an extremely rare situation (Guy & Roten, 2004). Furthermore, the gene order of both I. loihiensis configurations was compared with two related bacteria, S. oneidensis and V. parahaemolyticus chr. 1 (Fig. 1b). The comparison of the symmetrical configuration II (Fig. 1b, right) with related bacteria is closer to the typical X shape (see Tillier & Collins, 2000, for examples), than the compar-isons of configuration I with the same related bacteria (Fig. 1b, left). Consequently, Pearson’s correlation coeffi-cients of the X-plots are significantly higher in configuration II (Supplementary Table S3).
Finally, to validate experimentally the existence of the symmetrical chromosome configuration II in the I. loihiensis genome, primers encompassing each copy of the 3.4-kb IR were designed. Owing to the large size of repeated se-quences, long-range PCR reactions were performed using combinations of primers able to promote the amplification of either the published or the symmetrical chromosome configurations (configuration I or II, respectively) on ex-tracted chromosomal DNA from cultures of the I. loihiensis DSMZ reference strain (DSM 15497). PCR reactions clearly demonstrate that the symmetrical configuration II is present in the DNA sample (Fig. 2). On the contrary, although each configuration was tested using eight primer pairs, no amplification specific to the published configura-tion I was detected in manufacturer condiconfigura-tions, including when a DNA sample provided by Hou and coworkers was used (data not shown). Nevertheless, the presence of con-figuration I in the DNA sample cannot be completely excluded, but, if present, its proportion would be too low to be detected via long-range PCR. The results of the PCR amplifications strongly suggest that the published configuration I was not representative of the I. lohiensis population.
In summary, it is concluded that the published sequence of I. loihiensis L2TR represents, at best, a rare chromosomal configuration, and that typical I. loihiensis isolates display the symmetrical configuration II of this study. An alternative explanation is that the unusual skew pattern of I. loihiensis results from the misassembly of some contigs: indeed, for rearrangements implying long inverted repeated sequences, standard PCR verification of contig alignment (10 kb-long
PCRs, with a 1 kb overlap) could be unable to identify misassemblies or assembly of minor configurations. Cumu-lative GC skew plots were already able to detect such assembly problems in Bifidobacterium longum NCC2705 (Guy et al., 2005). Standard GC skews are widely used in genome projects. However, the cumulative representation of GC skew seems thus to be more readable and more easily interpreted by molecular biologists not trained in bioinfor-matics and represent a highly useful complement for detect-ing architecture anomalies in bacterial chromosomes. Moreover, this fast and simple method may be performed on raw sequence files: neither sequence annotation nor comparison with closely related species is required. Since a large majority of bacteria and more specifically almost all Gammaproteobacteria display typical cumulative GC skew curves, the information provided by this genometric tool should be intensively exploited in bacterial genome-sequen-cing projects, especially for those implying taxa in which no or few other complete sequences are available. Thus, it is proposed that these more informative cumulative skews should be used routinely in addition to the usual noncumu-lative circular representation (e.g. Andersson et al., 1998) in bacterial-sequencing projects.
Acknowledgements
Maqsudul Alam and Jimmy Saw are gratefully acknowl-edged for kindly providing I. loihiensis L2TR genomic DNA, and Christophe Carnoy thanked for drawing our attention to the dif sequence of I. lohiensis L2TR.
References
Altschul SF, Gish W, Miller W, Myers EW & Lipman DJ (1990) Basic local alignment search tool. J Mol Biol 215: 403–410. Andersson SGE, Zomorodipour A, Andersson JO,
Sicheritz-Ponten T, Alsmark UCM, Podowski RM, Naslund AK, Eriksson A-S, Winkler HH & Kurland CG (1998) The genome sequence of Rickettsia prowazekii and the origin of
mitochondria. Nature 396: 133–140.
Barekzi N, Beinlich K, Hoang TT, Pham X-Q, Karkhoff-Schweizer R & Schweizer HP (2000) High-frequency Flp recombinase-mediated inversions of the oriC-containing region of the Pseudomonas aeruginosa genome. J Bacteriol 182: 7070–7074. Blattner FR, Plunkett G III, Bloch CA et al. (1997) The complete
genome sequence of Escherichia coli K-12. Science 277: 1453–1462.
Canchaya C, Fournous G & Brussow H (2004) The impact of prophages on bacterial chromosomes. Mol Microbiol 53: 9–18.
Deng W, Burland V, Plunkett G III et al. (2002) Genome sequence of Yersinia pestis KIM. J Bacteriol 184: 4601–4611.
10 8 6 5 4 kb 1 2 3 4 5 6 7 8 + – 9 10 11 12 13 14 15 16 + – 10 8 6 5 4 kb
Fig. 2. Long-range PCR amplifications of Idiomarina loihiensis chromo-some in configurations I and II. Eight primer sets were used for detecting each conformation (Supplementary Tables S1 and S2). Primers amplifying a 11-kb region located outside the 0.6-Mb chromosomal inversion were used as a positive control and water as a negative control, respectively. Lanes 1–8 and 9–16, detection of published configuration I and symmetrical configuration II, respectively. Lanes 1 and , positive and negative control, respectively.
Eisen JA, Heidelberg JF, White O & Salzberg SL (2000) Evidence for symmetric chromosomal inversions around the replication origin in bacteria. Genome Biol 1: research0011.1–0011.9. Frank AC & Lobry JR (1999) Asymmetric substitution patterns: a
review of possible underlying mutational or selective mechanisms. Gene 238: 65–77.
Frank AC & Lobry JR (2000) Oriloc: prediction of replication boundaries in unannotated bacterial chromosomes. Bioinformatics 16: 560–561.
Grigoriev A (1998) Analyzing genomes with cumulative skew diagrams. Nucleic Acids Res 26: 2286–2290.
Guy L & Roten CAH (2004) Genometric analyses of the organization of circular chromosomes: a universal pressure determines the direction of ribosomal RNA genes
transcription relative to chromosome replication. Gene 340: 45–52.
Guy L, Karamata D, Moreillon P & Roten CAH (2005) Genometrics as an essential tool for the assembly of whole genome sequences: the example of the chromosome of Bifidobacterium longum NCC2705. BMC Microbiol 5: 60. Hou S, Saw JH, Lee KS et al. (2004) Genome sequence of the
deep-sea {gamma}-proteobacterium Idiomarina loihiensis reveals amino acid fermentation as a source of carbon and energy. Proc Natl Acad Sci USA 101: 18036–18041.
Kothapalli S, Nair S, Alokam S, Pang T, Khakhria R, Woodward D, Johnson W, Stocker BA, Sanderson KE & Liu SL (2005) Diversity of genome structure in Salmonella enterica serovar Typhi populations. J Bacteriol 187: 2638–2650.
Kurtz S & Schleiermacher C (1999) REPuter: fast computation of maximal repeats in complete genomes. Bioinformatics 15: 426–427.
Kurtz S, Phillippy A, Delcher AL, Smoot M, Shumway M, Antonescu C & Salzberg SL (2004) Versatile and open software for comparing large genomes. Genome Biol 5: R12.
Lesterlin C, Barre F-X & Cornet F (2004) Genetic recombination and the cell cycle: what we have learned from chromosome dimers. Mol Microbiol 54: 1151–1160.
Lobry JR (1996) Asymmetric substitution patterns in the two DNA strands of bacteria. Mol Biol Evol 13: 660–665. Parkhill J, Wren BW, Thomson NR et al. (2001) Genome
sequence of Yersinia pestis, the causative agent of plague. Nature 413: 523–527.
Rocha EPC (2004) The replication-related organization of bacterial genomes. Microbiology 150: 1609–1627. Roten CA, Gamba P, Barblan JL & Karamata D (2002)
Comparative Genometrics (CG): a database dedicated to biometric comparisons of whole genomes. Nucleic Acids Res 30: 142–144.
Stover CK, Pham XQ, Erwin AL et al. (2000) Complete genome sequence of Pseudomonas aeruginosa PA01, an opportunistic pathogen. Nature 406: 959–964.
Tillier ERM & Collins RA (2000) Genome rearrangement by replication-directed translocation. Nat Genet 26: 195–197. Van Sluys MA, de Oliveira MC, Monteiro-Vitorello CB et al.
(2003) Comparative analyses of the complete genome sequences of Pierce’s disease and citrus variegated chlorosis strains of Xylella fastidiosa. J Bacteriol 185: 1018–1026. Wheeler DL, Church DM, Edgar R et al. (2004) Database
resources of the National Center for Biotechnology Information: update. Nucleic Acids Res 32: D35–D40. Wren BW (2003) The yersiniae – a model genus to study the rapid
evolution of bacterial pathogens. Nat Rev Microbiol 1: 55–64.
Supplementary material
The following supplementary material is available for this article:
Table S1. Primers used for long-range PCR.
Table S2. Primer combinations used to obtain an amplifica-tion of either configuraamplifica-tion.
Table S3. Pearson’s coefficients for the correlation of gene orders between the compared genomes.
Fig. S1. Cumulative GC skews of two Gammaproteobacteria, related to I. loihiensis L2TR.
This material is available as part of the online article from: http://www.blackwell-synergy.com/doi/abs/10.1111/ j.1574-6968.2007.00714.x (This link will take you to the article abstract).
Please note: Blackwell Publishing is not responsible for the content or functionality of any supplementary materials supplied by the authors. Any queries (other than missing material) should be directed to the corresponding author for the article.