O R I G I N A L A R T I C L E
Individualized Catheter Surveillance among Neonates:
A Prospective, 8-Year, Single-Center Experience
Walter Zingg, MD; Klara M. Posfay-Barbe, MD; Riccardo E. Pfister, MD; Sylvie Touveneau, RN; Didier Pittet, MD, MS
OBJECTIVE. To monitor trends in central line-associated bloodstream infections and clinical sepsis (CLABICS) among neonates and to determine risk factors for infection, especially dwell time.
DESIGN. Prospective, single-center cohort study conducted from 2001 through 2008. SETTING. University-affiliated tertiary care center.
METHODS. Individualized surveillance of catheter use and CLABICS episodes was conducted. Data were obtained via regular on-site visits made 3 times a week. Trends over time were estimated by Poisson regression, and risk factor analysis was conducted using a Cox proportional hazards model and logistic regression.
RESULTS. In all, 1,124 neonates were exposed to 2,210 central lines for a total of 12,746 catheter-days and 11,467 catheter-days at risk. The median duration of catheter use was 8 (interquartile range, 5-11) days for peripherally inserted central catheters (PICCs) and 4 (interquartile range, 2-6) days for umbilical catheters; 102 CLABICS episodes were detected. The median time to infection was 7 days. Incidence densities were 8.5 CLABICS episodes per 1,000 catheter-days at risk and 8.0 CLABICS episodes per 1,000 catheter-days. The highest rates were identified among neonates weighing 750 g or lower (14.9 CLABICS episodes per 1,000 catheter days at risk) and for PICCs (13.2 CLABICS episodes per 1,000 catheter days at risk). Catheter dwell time was associated with CLABICS for all umbilical catheters (odds ratio [OR], 1.2 per day of use [95% confidence interval {CI}, 1.1-1.3]; P< .001) and for PICCs for up to 7 days (OR, 1.2 [95% CI, 1.1-1.4]; P = .041), but not thereafter (OR, 1.0 [95% CI, 0.9-1.1]; P = .90).
CONCLUSION. Catheter dwell time is a risk factor for CLABICS during the first 7 days, irrespective of catheter type. After 7 days, PICCs are less likely to become infected.
Infect Control Hosp Epidemiol 2010; 32(l):42-49
Healthcare-associated infections (HAIs) are the leading pre- umbilical catheters, and to place our findings in the context ventable adverse events in critically ill patients and are as- of the available literature,
sociated with considerable morbidity, mortality, and use of
additional resources.1,2 Neonates, particularly preterm infants M E T H O D S with a very low birth weight or extremely low birth weight,
are at high risk for HAIs, with reported rates ranging from °
6 to 9 episodes per 1,000 patient-days.3"5 In contrast to adults, A prospective cohort study was conducted from April 1,2001, among whom the proportion of bloodstream infections and through December 31, 2008, at the University of Geneva sepsis is only approximately 5 % - 8 % ,6 8 in neonates blood- Hospitals (Geneva, Switzerland), a 2,100-bed university-af-stream infections may represent up to three-quarters of all filiated primary and tertiary care center that has a 20-bed
HAIs.9"18 neonatal intensive care unit (NICU) and an 8-bed pediatric
The objectives of the present study were to assess secular intensive care unit (PICU). Neonates were hospitalized in the trends for central line-associated bloodstream infections and PICU if they needed ventilation. In 2001, we established an clinical sepsis (CLABICS), to determine risk factors for CLA- ongoing, prospective HAI surveillance program for neo-BICS in peripherally inserted central catheters (PICCs) and nates.19 All neonates with a central line (PICC or umbilical
From the Infection Control Program (W.Z., S.T., D.P.) and the Department of Pediatrics (K.M.P.-B., R.E.P.), University of Geneva Hospitals and Faculty of Medicine, Geneva, Switzerland.
Received March 23, 2010; accepted July 7, 2010; electronically published November30, 2010.
TABLE l. Catheter Dwell Times Stratified by Birth Weight Category among Neonates—University of Geneva Hospitals, 2001-2008
Birth weight category s$750 g 751-1,000 g 1,001-1,500 g 1,501-2,500 g > 2,500 g Trend2 P value All catheters Mean (SD)
dwell time, days 8.2 (5.9) 7.0 (5.0) 6.1 (3.9) 4.7 (3.1) 4.1 (3.2) -4.4% <.001 Median (IQR) dwell time, days
7 (4-11) 6(4-9) 5 (3-8) 4 (3-6) 3 (2-5) Umbilical catheters Mean (SD)
dwell time, days 5.8 (3.7) 4.5 (2.2) 4.3 (2.8) 3.8 (2.2) 3.6 (2.0) -4.5% <.001 Median (IQR) dwell time, days
5 (3-8) 4 (3-6) 4 (2-6) 4 (2-5) 3 (2-5)
NOTE. IQR, interquartile range; SD, standard deviation. * Mean change in dwell time per birth weight category. catheter) were prospectively included in the study; there was no exclusion criterion for neonates with a central line. Surveillance
The same infection control nurse visited the NICU and PICU 3 times a week for on-site surveillance during the entire study period.19 Each neonate included in the study was prospectively monitored, and data on such variables as birth weight, Clin-ical Risk Index for Babies (CRIB) score, Apgar score, and gestational age were collected.20,21 Each PICC, umbilical artery catheter, and umbilical venous catheter was monitored in-dividually during the entire life span of the device. Neonates with long-term tunneled central venous catheters were ex-cluded from the study. HAIs were identified via medical rec-ord review, an automated alert system for positive blood cul-ture results, participation by the infection control nurse in ward rounds, direct information from physicians and nursing staff, direct observation of neonates, and complete review of laboratory reports.19,22
Definitions
The occurrence of CLABICS, defined as laboratory-confirmed bloodstream infection or clinical sepsis, was the primary end point. Clinical sepsis was included as an outcome parameter because blood culture samples from neonates are often not reliable, and thus ignoring clinical sepsis would underestimate the true rate of bloodstream infection.22"24 CLABICS episodes were defined according to the US Centers for Disease Control and Prevention (CDC) criteria.25,26 All infections were con-firmed by a neonatologist (R.E.P.) or an infectious diseases and infection control physician (K.M.P.-B. or W.Z.). A CLA-BICS episode was considered to be associated with health care if diagnosed 3 days or more after birth. Dwell time was de-fined as the number of full days a catheter was in place. Statistical Analysis
Crude analysis was conducted by analyzing CLABICS epi-sodes on the basis of the total number of catheter-days or
patient-days, respectively.27 For risk analysis, only the first CLABICS episodes were considered; they were analyzed on the basis of the number of catheter-days or patient-days at risk. At-risk days were defined as catheter-days or patient-days before a CLABICS episode. Subsequent patient-days and sub-sequent catheters were excluded from the analysis. Exposure to parenteral nutrition and antibiotics was included in the risk analysis if present before a CLABICS episode. Continuous variables were summarized as means and medians and were compared by the Student t test or the Wilcoxon rank sum test, as appropriate. A Cox proportional hazards model was used to investigate the association between the time at risk of developing CLABICS and various variables, such as birth weight, gestational age, parenteral nutrition, antibiotic use, and CRIB score. We modeled time to event in a single-event analysis in which the unit of analysis was the catheter. Because a neonate could have more than 1 catheter either at the same time or sequentially, we adjusted for intragroup correlation by specifying each neonate as a cluster.28,29 We first
investi-TABLE 2. Pathogens Isolated from Central Line-Associated Blood-stream Infections among Neonates—University of Geneva Hospitals, 2001-2008
Pathogen
Staphylococcus epidermidis
Other coagulase-negative staphylococci
Staphylococcus capitis Escherichia coli Enterococcus species Methicillin-susceptible Staphyloccocus aureus Methicillin-resistant S. aureus Streptococcus viridans Enterobacter cloacae Klebsiella pneumoniae Frequency (n = 69) 30 (43.5) 17 (24.6) 6 (8.7) 6 (8.7) 4 (5.8) 2 (2.9) 1 (1.5) 1 (1.5) 1 (1.5) 1 (1.5) NOTE. Data are no. (%) of pathogens. Thirty-three infections were clinical sepsis episodes.
TABLE 3. Incidence Densities (IDs) for Central Line-Associated Blood-stream Infections and Clinical Sepsis (CLABICS) among Neonates, Overall and by Birth Weight and Catheter Type—University of Geneva Hospitals, 2001-2008 Category Patient-days Patient-days at risk Catheter-days Catheter-days at risk
Birth weight category ^750 g 751-1,000 g 1,001-1,500 g 1,501-2,500 g >2,500 g Catheter type PICCs UACs UVCs
Birth weight category < 7 5 0 g 751-1,000 g 1,001-1,500 g 1,501-2,500 g >2,500 g Catheter type PICCs UACs UVCs No. of CLABICS episodes 102 97 102 97 CLABICS episoc 28 34 30 7 3 80 3 19 CLABICS episodes ] 25 33 29 7 3 75 3 19 Days of exposure Overall 46,173 24,048 12,764 11,467 ID (95% CI) 2.2 (1.8-2.7) 4.0 (3.3-4.9) 8.0 (6.5-9.7) 8.5 (6.9-10.3) es per 1,000 catheter-days 2,062 2,700 3,916 2,169 1,917 6,909 1,528 4,327 13.6 (9.0-19.6) 12.6 (8.7-17.6) 7.7 (5.2-10.9) 3.2 (1.3-6.6) 1.6 (0.3^.6) 11.6 (9.2-14.4) 2.0 (0.4-5.7) 4.4 (2.6-6.8) aer 1,000 catheter-days at risk
1,681 2,215 3,583 2,095 1,893 5,664 1,508 4,295 14.9 (9.6-21.9) 14.9 (10.3-20.9) 8.1 (5.4-11.6) 3.3 (1.3-6.9) 1.6 (0.3-4.6) 13.2 (10.4-16.6) 2.0 (0.4-5.8) 4.4 (2.7-6.9)
NOTE. CI, confidence interval; PICCs, peripherally inserted central catheters; UACs, umbilical artery catheters; UVCs, umbilical venous catheters.
gated all potential risk factors by univariate analysis. Variables with a P value of less than .02 were included in the multi-variate analysis. P values less than .05 were considered to indicate statistical significance, and only variables meeting this criterion were retained in the final model. Time trends were estimated by Poisson regression. Logistic regression analysis was used to quantify the association with catheter dwell time (measured as the number of catheter-days with a CLABICS episode) and to distinguish between catheter types related to such a risk. Similar to the strategy for the Cox proportional hazards model, we adjusted for intragroup cor-relation by specifying each neonate as a cluster, and integra-tion of variables in the multivariate analysis was done ac-cordingly. All statistical analyses were conducted with Stata software, version 10.0 (StataCorp).
RESULTS
Patient Characteristics
From 2001 through 2008, 3,772 neonates were hospitalized, totaling 46,173 patient-days. Of these neonates, 1,124 (30%) had 1 or more central vascular access devices and were in-cluded in the study. The median gestational age of the ne-onates was 32 (interquartile range [IQR], 29-37) weeks. Most neonates were singletons (894 [80%]); 492 (44%) had a very low birth weight, and 205 (18%) had an extremely low birth weight. Mean and median CRIB scores were 3.3 (standard deviation [SD], 3.8) and 2 (IQR, 1-5), respectively. Mean and median birth weights were 1,943 (SD, 1,012) and 1,660 (IQR, 1,130-2,730) g, respectively. The median Apgar score after 5 minutes was 9 (IQR, 7-9). The total length of stay was 29,646
100 B <B 75 1 80-g 25'
a
8 a. o ^— Peripherally inserted central catheters (n = 75) • - Umbilical catheters (n = 22)
10 15 Catheter dwell time, days
20
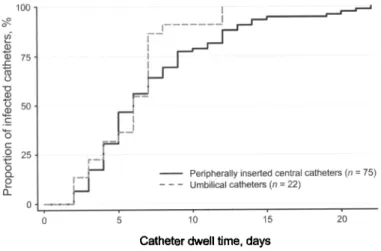
FIGURE I. Time to infection for peripherally inserted central catheters and umbilical catheters among neonates-Hospitals, 2001-2008.
-University of Geneva
days, with a mean of 26.6 (SD, 27.2) days and a median of 17 (IQR, 8-37) days, respectively. A total of 24,048 days (81%) were patient-days at risk. There were significant trends over time toward lower birth weights (P < .001) but also to-ward a shorter length of stay (P = .001).
Central Lines
A total of 2,210 central lines accounting for 12,764 catheter-days were observed among the 1,124 neonates (utilization rate, 27.6% [12,764 of 46,173]). A total of 2,116 catheters (723 PICCs [34.2%], 385 umbilical artery catheters [18.2%], and 1,008 umbilical venous catheters [47.6%]) accounting for 11,467 catheter-days at risk were included in the risk analysis. The mean and median dwell times at risk were 7.8 (SD, 4.7) and 8 (IQR, 5-11) days for PICCs, 3.9 (SD, 2.5) and 3 (IQR, 2-5) days for umbilical artery catheters, and 4.3 (SD, 2.5) and 4 (IQR, 2-6) days for umbilical venous cath-eters, respectively. Dwell times differed significandy between
PICCs and umbilical catheters (median, 7 [IQR, 5-10] vs 4 [IQR, 2-5] days; P<.001). Catheter dwell times depended significantly on birth weight categories (Table 1). Neonates weighing 750 g or less had PICCs in place twice as long as neonates weighing more than 2,500 g. Similarly, umbilical dwell times were also significantly shorter among neonates in the highest birth weight category than the lowest (median, 3 [IQR, 2-5] vs 5 [IQR, 3-8] days; P< .001). Parenteral nu-trition and intravenous antibiotics were applied through 1,115 (53%) and 1,341 (61%) catheters, respectively. During the time at risk, 1,034 catheters (49%) were used for par-enteral nutrition, and 1,205 (57%) were used for antibiotic therapy.
CLABICS
A total of 102 CLABICS episodes were observed (laboratory-confirmed bloodstream infections, 69; clinical sepsis episodes, 33). Most isolated pathogens (77%) were coagulase-negative TABLE 4. Risk Factors for Central Line-Associated Bloodstream Infections and
Clinical Sepsis among Neonates—University of Geneva Hospitals, 2001-2008
Variable Catheter type1'b
Extremely low birth weightb Pluriparityb Apgar scoreb CRIB score Calendar year Parenteral nutritionb Antibiotic usebc Univariate analysis HR (95% CI) 0.75 (0.56-1.01) 2.11 (1.40-3.19) 1.67 (1.10-2.55) 0.99 (0.99-0.99) 1.02 (0.98-1.07) 0.97 (0.89-1.05) 2.92 (1.46-5.82) 0.39 (0.26-0.58) P .063 <.001 .016 .003 .359 .462 .002 <.001 Multivariate analysis HR (95% CI) P 2.24 (1.42-3.53) .001 2.23 (1.10-4.55) .027 0.33 (0.21-0.52) <001 NOTE. CI, confidence interval; CRIB, Clinical Risk Index for Babies; HR, hazard ratio. * Umbilical catheters vs peripherally inserted central catheters.
b
Included in the multivariate analysis.
c
TABLE 5. Benchmarking of Bloodstream Infections and Clinical Sepsis among Neonates at the University of Geneva Hospitals with the German Hospital Infection Surveillance System (KISS) and the US National Healthcare Safety Network (NHSN) Category Birth weight <1,000 g 1,000-1,499 g All Birth weight < 7 5 0 g 751-1,000 g 1,001-1,500 g 1,501-2,500 g >2,500 g All Birth weight < 7 5 0 g 751-1,000 g 1,001-1,500 g 1,501-2,500 g >2,500 g All No. of CLABICS episodes 61 30 91 19 31 24 5 1 80 9 3 6 2 2 22 Geneva data No. of No. of CLABICS catheter-days ID (95% CI) episodes
4,569 3,993 8,562 1,248 1,772 2,447 930 512 6,909 814 928 1,469 1,239 1,405 5,855
Geneva data vs KISS data"
13.4 (10.2-17.1) 661 7.5 (5.1-10.7) 170 10.6 (8.6-13.0) 831 Comparison No. of catheter-days 52,467 22,277 74,744 Geneva data vs NHSN data,b central lines
15.2 (9.1-23.7) 225 17.5 (11.9-24.7) 185 9.8 (6.3-14.6) 144 5.4 (1.7-12.5) 105 2.0 (0.0-10.8) 87 11.6 (9.2-14.4) 746 60,850 55,445 55,874 44,402 42,611 259,182 Geneva data vs NHSN data,b umbilical lines
11.1 (5.1-21.0) 79 3.2 (0.7-9.4) 39 4.1 (1.5-8.9) 32 1.6 (0.2-5.8) 15 1.4 (0.2-5.1) 22 3.8 (2.4-5.7) 187 16,762 15,034 16,681 16,321 22,978 87,776 data ID (95% CI) 12.6 (11.7-13.6) 7.6 (6.5-8.9) 11.1 (10.4-11.9) 3.7 (3.2-4.2) 3.3 (2.9-3.9) 2.6 (2.2-3.0) 2.4 (1.9-2.9) 2.0 (1.6-2.5) 2.9 (2.7-3.1) 4.7 (3.7-5.9) 2.6 (1.8-3.5) 1.9 (1.3-2.7) 0.9 (0.5-1.5) 1.0 (0.6-1.4) 2.1 (1.8-2.5) NOTE. Incidence densities (IDs) are reported as the no. of central line-associated bloodstream infections and clinical sepsis (CLABICS) episodes per 1,000 catheter-days. CI, confidence interval.
• Pooled mean data from KISS.
b
Pooled mean data from NHSN.
staphylococci, of which Staphylococcus epidermidis was iden-tified the most frequently (Table 2). The overall incidence densities for CLABICS were 8.0 episodes per 1,000 catheter-days and 8.5 episodes per 1,000 catheter-catheter-days at risk (Table 3). The incidence densities for laboratory-confirmed central line-associated bloodstream infection with and without cases of clinical sepsis were 8.0 episodes per 1,000 catheter-days and 5.4 episodes per 1,000 catheter-days, respectively. No statistically significant trend in CLABICS rates over the total study period was observed. Of note, the observed incidence of infection depended largely on the denominator chosen to calculate it (Table 3). The incidence density varied according to birth weight and catheter type; neonates with a low birth weight and/or a PICC rather than an umbilical line had higher CLABICS rates (Table 3).
The median time to a CLABICS episode for PICCs and umbilical catheters was 7 (IQR, 5-10) and 7 (IQR, 5-8) days, respectively (Figure 1). Time to infection diminished signif-icantly over the course of the study, by a mean of 5.4% per year (from 9.9 [SD, 5.1] days in 2001 to 7.1 [SD, 3.1] days in 2008; P< .001). The time from admission to infection also
diminished significantly, by a mean of 5.0% per year (from 15.5 [SD, 10.0] days in 2001 to 9.9 [SD, 4.1] days in 2008;
P< .001). As shown in Figure 1, time-to-infection curves are
identical for PICCs and umbilical catheters, assuming that dwell time is a similar risk factor for both catheter types. Risk Factors
The occurrence of CLABICS among all catheter types was independently associated with extremely low birth weight (P = .001) and exposure to total parenteral nutrition {P = .027) (Table 4). A significant reduction in the number of CLABICS episodes was observed when antibiotics were ad-ministered through the catheter (P<.001). Catheter dwell time expressed as adjusted risk per catheter-day was signifi-cantly associated with CLABICS in the logistic regression analysis (odds ratio [OR], 1.1 per day of use [95% confidence interval {CI}, 1.0-1.1]; P = .005). Adjustments were made for extremely low birth weight, exposure to parenteral nu-trition, and antibiotic therapy. For umbilical catheters, the adjusted risk was significant for all catheters (OR, 1.2 per day
of use [95% CI, 1.1-1.3]; P< .001). However, for PICCs the adjusted risk was significant for a dwell time of up to 7 days (OR, 1.2 per day of use [95% CI, 1.1-1.4]; P = .041), but not thereafter (OR, 1.0 per day of use [95% CI, 0.9-1.1]; P = .90).
D I S C U S S I O N
This single-center prospective cohort study includes data re-corded at the individual patient level for 8 years and is the largest and longest of its kind, to the best of our knowledge. The study reveals statistically significant reductions in catheter dwell times over the years, confirms the importance of known risk factors for CLABICS (such as low birth weight and par-enteral nutrition30"32), and highlights the unanticipated finding that for PICCs dwell time is statistically significanuy associated with CLABICS during the first 7 days, but not thereafter.
Although prolonged catheter dwell time among neonates has been repeatedly associated with CLABICS,33"35 a recent study even found an opposite trend for PICCs.36 Our data do not completely contradict these data but add another per-spective to the findings: whereas there was a statistically sig-nificant association between dwell time and CLABICS for umbilical catheters, such an association was significant for PICCs for only up to 7 days of dwell time. The median time to infection was identical for umbilical catheters and PICCs. Because the dwell time of only 10% of umbilical catheters exceeded 7 days, it is no surprise that the dwell time for this catheter type as a whole was associated with CLABICS, whereas for PICCs overall no such association was observed. Our data show that longer dwell times for PICCs are asso-ciated with either antibiotic therapy (OR, 1.1 [95% CI, 1.2]; P< .001) or parenteral nutrition (OR, 1.2 [95% CI, 1.1-1.3 ]; P < .001). Given that longer catheterization is more likely to be associated with antibiotic use (P< .001), which in turn is associated with fewer CLABICS episodes, it is no surprise that the incidence density for CLABICS was lower among PICCs with a longer duration (>7 days). However, our data support the hypothesis that the daily risk for CLABICS changes with dwell time, being highest within 7 days of place-ment but decreasing thereafter. This is most likely due to the indications for PICC use in this context, especially the use of antibiotics. Our data suggest that the routine replacement of PICCs is not advisable. Although we found increased daily risk during the first days of placement, our results are in line with those of a study by Smith et al36 that found no association at all. However, more information is needed before any firm recommendation can be made, and future studies should also compare PICCs with peripheral catheters to verify whether PICCs may be replaced by peripheral lines.
Only a few studies have reported data on time to in-fection.37'38 Ben Jaballah et al38 found a mean of 6.6 (SD, 2.8) days to infection for all catheter types; Hoang et al37 reported a median time of 9 days for PICCs of the upper extremities, although the median time was longer (15 days) for PICCs of
the lower extremities. Our findings are consistent with these data. Importantly, we observed that time to infection was similar among all catheter types. The decrease in time to infection in our population, however, is worrying. Prolonged time to infection has been shown to be a favorable indicator for good catheter care.28 Thus, observing the opposite trend may indicate that issues regarding the quality of catheter care exist in our NICU. Of note, prolonged time to infection could also be associated with the observed changes in case mix.
A key obstacle of HAI reporting is the varying modes of outcome definition and denominator selection. Using the ex-ample of ventilator-associated pneumonia, Eggimann et al27 showed that the method of reporting pneumonia rates has a significant effect on risk estimates. The incidence density dou-bled when rates were adjusted by ventilator-days at risk in-stead of patient-days in intensive care. Our study data are even more pronounced: the difference between incidence densities expressed per 1,000 patient-days compared with 1,000 catheter-days at risk was 4-fold. However, the difference between rates determined on the basis of device-days and device-days at risk was not pronounced. Not only does the denominator influence risk estimates, but the numerator— and hence the definition of the outcome variable—may have a similar effect among neonates. Including laboratory-con-firmed bloodstream infections exclusively in a surveillance or adding cases with clinical sepsis results in considerable dif-ferences in rates. The sensitivity of blood culture in neonates is low, and the CDC definitions of clinical sepsis leave room for interpretation. Considering only laboratory-confirmed bacteremia is likely to underestimate the true rate, whereas including clinical sepsis in the surveillance program is likely to overestimate the rate.23"26 Thus, the true rate probably can-not be determined until more specific markers of neonatal bloodstream infections become available. At a time of public reporting of nosocomial infections, hospitals are tempted to report only laboratory-confirmed infections. However, given the low sensitivity of blood cultures in neonates, such re-porting may underestimate central line-associated blood-stream infection rates unacceptably, as was also evidenced by our study.
Studies and HAI surveillance programs conducted among neonates use different formats for data reporting. The US National Healthcare Safety Network (NHSN) reports labo-ratory-confirmed bloodstream infections and clinical sepsis and stratifies data into 5 birth weight categories, whereas the German Hospital Infection Surveillance System (KISS) strat-ifies into 2 birth weight categories.39,40 Furthermore, the US NHSN distinguishes central from umbilical catheters in its lat-est report.39 Such differences make comparisons and bench-marking difficult, if not impossible. Basically, a center has to decide which surveillance method to use and whether bench-marking with US or European data is preferred. Our detailed and individualized data collection is quite unique and allowed us to compare our data with both the US NHSN and German KISS reports (Table 5). As is shown, our CLABICS incidence
densities were similar to the German KISS data (10.6 [95% CI, 8.6-12.0] vs 11.1 [95% CI, 10.4-11.9] episodes per 1,000 cath-eter-days). However, our rates were consistently higher for cen-tral lines, for umbilical lines, and across all birth weight cat-egories other than 2,500 g or higher when compared with the NHSN (Table 5). There is no explanation for why European rates are so much higher than US rates, but it is noteworthy that not all recent US studies have produced data that are in line with the current (and rather low) NHSN data,39 and data from these studies mirror our results.36,37
A limitation of our study is the lack of data on peripheral lines. Although no evidence to suggest that PICC use increases the risk of adverse events relative to peripheral lines was found,41 it would have been useful to consider our data in the context of all vascular access devices, and more infor-mation on whether peripheral lines could replace PICCs is needed.
In conclusion, the present study has shown that catheter dwell time is a risk factor for CLABICS in neonates with umbilical catheters and PICCs during the first 7 days of their use, but not thereafter. Considering the median dwell time of 7 days, routine PICC replacement is not advisable, in light of our findings. However, a firm recommendation about the dwell time of PICCs in neonates needs confirmation by ad-ditional studies. Individualized catheter surveillance allows benchmarking with different surveillance systems and detec-tion of unanticipated risk factors. Such detailed results on catheter type provide optimal feedback and enable tailor-ing of prevention measures that account for specific local shortcomings.
A C K N O W L E D G M E N T S
We thank the teams of the neonatal unit and the pediatric intensive care unit of the University of Geneva Hospitals for their support and Rosemary Sudan for editorial assistance.
Financial support. This study was conducted as a qualitative research
project and was funded by the University of Geneva Hospitals.
Potential conflicts of interest. All authors report no conflicts of interest
relevant to this article.
Address reprint requests to Didier Pittet, MD, MS, University of Geneva Hospitals and Faculty of Medicine, 4 rue Gabrielle Perret-Gentil, 1211 Geneve 14, Switzerland ([email protected]).
Presented in part at the 48th Annual Interscience Conference on Anti-microbial Agents and Chemotherapy; Washington, DC; October 2008 (Ab-stract K-3419).
R E F E R E N C E S
1. Brady MT. Health care-associated infections in the neonatal intensive care unit. Am J Infect Control 2005;33:268-275.
2. Harbarth S, Pittet D. The intensive care unit. In: Jarvis WR, ed. Bennett
and Brachman's Hospital Infections. Philadelphia, PA: Lippincott Williams
8c Wilkins, 2007:373-393.
3. Stover BH, Shulman ST, Bratcher DF, Brady MT, Levine GL, Jarvis WR. Nosocomial infection rates in US children's hospitals' neonatal and pe-diatric intensive care units. Am J Infect Control 2001;29:152-157. 4. Hentschel J, Brungger B, Studi K, Muhlemann K. Prospective surveillance
of nosocomial infections in a Swiss NICU: low risk of pneumonia on nasal continuous positive airway pressure? Infection 2005;33:350-355. 5. Schwab F, Geffers C, Barwolff S, Ruden H, Gastmeier P. Reducing neo-natal nosocomial bloodstream infections through participation in a na-tional surveillance system. / Hosp Infect 2007;65:319-325.
6. Pittet D, Harbarth S, Ruef C, et al. Prevalence and risk factors for nos-ocomial infections in four university hospitals in Switzerland. Infect
Con-trol Hosp Epidemiol 1999;20:37-42.
7. Sax H, Hugonnet S, Harbarth S, Herrault P, Pittet D. Variation in nos-ocomial infection prevalence according to patient care setting: a hospital-wide survey. J Hosp Infect 2001;48:27-32.
8. Pittet D. Nosocomial bloodstream infections. In: Wenzel RP, ed.
Pre-vention and Control of Nosocomial Infections. Baltimore, MD: Lippincott
WiUiams & Wilkins, 1997;711-769.
9. Contreras-Cuellar GA, Leal-Castro AL, Prieto R, Carvajal-Hermida AL. Device-associated infections in a Colombian neonatal intensive care unit.
Rev Salud Publica (Bogota) 2007;9:439-447.
10. El-Nawawy AA, Abd El-Fattah MM, Metwally HA, Barakat SS, Hassan IA. One year study of bacterial and fungal nosocomial infections among patients in pediatric intensive care unit (PICU) in Alexandria. / Trop
Pediatr 2006;52:185-191.
11. Balkhy HH, Cunningham G, Chew FK, et al. Hospital- and community-acquired infections: a point prevalence and risk factors survey in a tertiary care center in Saudi Arabia. Int J Infect Dis 2006;10:326-333. 12. Couto RC, Carvalho EA, Pedrosa TM, Pedroso ER, Neto MC, Biscione
FM. A 10-year prospective surveillance of nosocomial infections in neo-natal intensive care units. Am J Infect Control 2007;35:183-189. 13. Elward AM, Fraser VJ. Risk factors for nosocomial primary bloodstream
infection in pediatric intensive care unit patients: a 2-year prospective cohort study. Infect Control Hosp Epidemiol 2006;27:553-560. 14. Mireya UA, Marti PO, Xavier KV, Cristina LO, Miguel MM, Magda CM.
Nosocomial infections in paediatric and neonatal intensive care units. /
Infect 2007;54:212-220.
15. Raka L, Zoutman D, Mulliqi G, et al. Prevalence of nosocomial infections in high-risk units in the university clinical center of Kosova. Infect Control
Hosp Epidemiol 2006;27:421-423.
16. Perlman SE, Saiman L, Larson EL. Risk factors for late-onset health care-associated bloodstream infections in patients in neonatal intensive care units. Am J Infect Control 2007;35:177-182.
17. Posfay-Barbe KM, Zerr DM, Pittet D. Infection control in paediatrics.
Lancet Infect Dis 2008;8:19-31.
18. Zingg W, Posfay-Barbe KM, Pittet D. Healthcare-associated infections in neonates. Curr Opin Infect Dis 2008;21:228-234.
19. Pessoa-Silva CL, Hugonnet S, Pfister R, et al. Reduction of health care associated infection risk in neonates by successful hand hygiene pro-motion. Pediatrics 2007;120:e382-e390.
20. International Neonatal Network. The CRIB (clinical risk index for babies) score: a tool for assessing initial neonatal risk and comparing perfor-mance of neonatal intensive care units. Lancet 1993;342:193-198. 21. Apgar V. A proposal for a new method of evaluation of the newborn
infant. Curr Res Anesth Analg 1953;32:260-267.
22. Eggimann P, Harbarth S, Constantin MN, Touveneau S, Chevrolet JC, Pittet D. Impact of a prevention strategy targeted at vascular-access care on incidence of infections acquired in intensive care. Lancet 2000;355: 1864-1868.
23. Connell TG, Rele M, Cowley D, Buttery JP, Curtis N. How reliable is a negative blood culture result? volume of blood submitted for culture in routine practice in a children's hospital. Pediatrics 2007;119:891-896. 24. Hugonnet S, Sax H, Eggimann P, Chevrolet JC, Pittet D. Nosocomial
bloodstream infection and clinical sepsis. Emerg Infect Dis 2004;10:76-81. 25. Garner JS, Jarvis WR, Emori TG, Horan TC, Hughes JM. CDC definitions
for nosocomial infections, 1988. Am J Infect Control 1988;16:128-140. 26. Horan TC, Andrus M, Dudeck MA. CDC/NHSN surveillance definition
of health care-associated infection and criteria for specific types of in-fections in the acute care setting. Am J Infect Control 2008;36:309-332. 27. Eggimann P, Hugonnet S, Sax H, Touveneau S, Chevrolet JC, Pittet D.
Ventilator-associated pneumonia: caveats for benchmarking. Intensive
Care Med 2003;29:2086-2089.
28. Zingg W, Imhof A, Maggiorini M, Stacker R, Keller E, Ruef C. Impact of a prevention strategy targeting hand hygiene and catheter care on the incidence of catheter-related bloodstream infections. Crit Care Med 2009; 37:2167-2173.
29. Zingg W, Sax H, Inan C, et al. Hospital-wide surveillance of catheter-related bloodstream infection: from the expected to the unexpected. /
Hosp Infect 2009;73:41-46.
30. Freeman J, Goldmann DA, Smith NE, Sidebottom DG, Epstein MF, Piatt R. Association of intravenous lipid emulsion and coagulase-negative staphylococcal bacteremia in neonatal intensive care units. N Engl J Med 1990;323:301-308.
31. Holmes A, Dore CJ, Saraswatula A, et al. Risk factors and recommen-dations for rate stratification for surveillance of neonatal healthcare-associated bloodstream infection. / Hosp Infect 2008;68:66-72. 32. Nagata E, Brito AS, Matsuo T. Nosocomial infections in a neonatal
intensive care unit: incidence and risk factors. Am J Infect Control 2002; 30:26-31.
33. Chathas MK, Paton JB, Fisher DE. Percutaneous central venous cathe-terization: three years' experience in a neonatal intensive care unit. Am
J Dis Child 1990;144:1246-1250.
34. Clark R, Powers R, White R, Bloom B, Sanchez P, Benjamin DK Jr. Prevention and treatment of nosocomial sepsis in the NICU. / Perinatal 2004;24:446-453.
35. Stoll BJ, Hansen N, Fanaroff AA, et al. Late-onset sepsis in very low
birth weight neonates: the experience of the NICHD Neonatal Research Network. Pediatrics 2002;110:285-291.
36. Smith PB, Benjamin DK Jr, Cotten CM, et al. Is an increased dwell time of a peripherally inserted catheter associated with an increased risk of bloodstream infection in infants? Infect Control Hosp Epidemiol 2008;29: 749-753.
37. Hoang V, Sills J, Chandler M, Busalani E, Clifton-Koeppel R, Modanlou HD. Percutaneously inserted central catheter for total parenteral nutri-tion in neonates: complicanutri-tions rates related to upper versus lower ex-tremity insertion. Pediatrics 2008; 121:ell52-el 159.
38. Ben Jaballah N, Bouziri A, Mnif K, Hamdi A, Khaldi A, Kchaou W. Epidemiology of hospital-acquired bloodstream infections in a Tunisian pediatric intensive care unit: a 2-year prospective study. Am J Infect
Control 2007;35:613-618.
39. Edwards JR, Peterson KD, Andrus ML, Dudeck MA, Pollock DA, Horan TC. National Healthcare Safety Network (NHSN) report, data summary for 2006 through 2007, issued November 2008. Am J Infect Control 2008; 36:609-626.
40. Geffers C, Baerwolff S, Schwab F, Gastmeier P. Incidence of healthcare-associated infections in high-risk neonates: results from the German surveillance system for very-low-birthweight infants. / Hosp Infect 2008; 68:214-221.
41. Ainsworth SB, Clerihew L, McGuire W. Percutaneous central venous catheters versus peripheral cannulae for delivery of parenteral nutrition in neonates. Cochrane Database Syst Rev 2007:CD004219.