Revisiting susceptibility testing in MDR-TB by a standardized
quantitative phenotypic assessment in a European multicentre study
E. Cambau
1*, M. Viveiros
2, D. Machado
2, L. Raskine
1, C. Ritter
3, E. Tortoli
4, V. Matthys
5, S. Hoffner
6, E. Richter
7,
M. L. Perez Del Molino
8, D. M. Cirillo
4, D. van Soolingen
9,10and E. C. Bo¨ttger
3†
1
AP-HP, Hoˆpital Lariboisie`re, Service de Bacte´riologie, Centre National de Re´fe´rence des Mycobacte´ries et de la Re´sistance des
Mycobacte´ries aux Antituberculeux; IAME UMR1137, INSERM, Universite´ Paris Diderot, 75010 Paris, France;
2Grupo de Micobacte´rias,
Unidade de Microbiologia Me´dica, Instituto de Higiene e Medicina Tropical, Universidade Nova de Lisboa (IHMT/UNL), Rua da Junqueira
100, 1349-008 Lisboa, Portugal;
3Institut fu¨r Medizinische Mikrobiologie, Nationales Zentrum fu¨r Mykobakterien, Universita¨t Zu¨rich, Zu¨rich,
Switzerland;
4IRCCS San Raffaele Scientific Institute, Emerging Bacterial Pathogens Unit Supranational Reference Laboratory, via Olgettina
60, 20132 Milan, Italy;
5National Reference Centre of Tuberculosis and Mycobacteria, Communicable and Infectious Diseases, Scientific
Institute of Public Health (WIV-ISP), Brussels, Belgium;
6Department of Microbiology, Public Health Agency of Sweden and Department of
Microbiology, Cell and Tumor Biology, Karolinska Institute, Stockholm, Sweden;
7National Reference Center for Mycobacteria,
Forschungszentrum Borstel, Borstel, Germany;
8Servicio de Microbiologı´a, CH Universitario de Santiago, Centro de Referencia de
Micobacterias de Galicia, Choupana S/N, 15705 Santiago de Compostela, Spain;
9Tuberculosis Reference Laboratory, National Institute for
Public Health and the Environment (RIVM), PO Box 1, 3720 BA Bilthoven, The Netherlands;
10Department of Pulmonary Diseases/
Department of Clinical Microbiology, Radboud University Medical Centre, PO Box 9101, Nijmegen, The Netherlands
*Corresponding author. Service de Bacte´riologie-Virologie, Groupe Hospitalier Lariboisie`re-Fernand Widal, AP-HP, Paris, France. Tel:+33-1-49-95-65-51; Fax: +33-1-49-95-85-37; E-mail: [email protected]
†E. Cambau, M. Viveiros, D. Machado, L. Raskine, C. Ritter, D. van Soolingen and E. C. Bo¨ttger belong to ESGMYC (ESCMID Study Group for Mycobacterial Infections).
Received 19 July 2014; returned 9 September 2014; revised 27 September 2014; accepted 8 October 2014
Objectives: Treatment outcome of MDR-TB is critically dependent on the proper use of second-line drugs as per
the result of in vitro drug susceptibility testing (DST). We aimed to establish a standardized DST procedure based
on quantitative determination of drug resistance and compared the results with those of genotypes associated
with drug resistance.
Methods: The protocol, based on MGIT 960 and the TB eXiST software, was evaluated in nine European reference
laboratories. Resistance detection at a screening drug concentration was followed by determination of resistance
levels and estimation of the resistance proportion. Mutations in 14 gene regions were investigated using
estab-lished techniques.
Results: A total of 139 Mycobacterium tuberculosis isolates from patients with MDR-TB and resistance beyond
MDR-TB were tested for 13 antituberculous drugs: isoniazid, rifampicin, rifabutin, ethambutol, pyrazinamide,
streptomycin, para-aminosalicylic acid, ethionamide, amikacin, capreomycin, ofloxacin, moxifloxacin and
linezo-lid. Concordance between phenotypic and genotypic resistance was .80%, except for ethambutol. Time to
results was short (median 10 days). High-level resistance, which precludes the therapeutic use of an
antituber-culous drug, was observed in 49% of the isolates. The finding of a low or intermediate resistance level in 16% and
35% of the isolates, respectively, may help in designing an efficient personalized regimen for the treatment of
MDR-TB patients.
Conclusions: The automated DST procedure permits accurate and rapid quantitative resistance profiling of
first-and second-line antituberculous drugs. Prospective validation is warranted to determine the impact on
patient care.
Keywords: antibiotic susceptibility testing, DST, antituberculous drugs, TB eXiST, MGIT
#The Author 2014. Published by Oxford University Press on behalf of the British Society for Antimicrobial Chemotherapy. All rights reserved. For Permissions, please e-mail: [email protected]
Introduction
MDR-TB is a major problem in the global fight against TB.
1–3MDR-TB
is defined as resistance to at least isoniazid and rifampicin, the two
cornerstones of the standard short-course chemotherapy.
4,5Consequently, treatment of MDR-TB requires the use of second-line
drugs such as fluoroquinolones and aminoglycosides.
6–8Moreover,
the treatment of XDR-TB, i.e. MDR-TB with additional resistance to
fluoroquinolones and to amikacin, capreomycin or kanamycin,
requires a hand-tailored regimen using the few remaining
active drugs.
The treatment regimen for MDR- and XDR-TB is designed
according to the results of drug susceptibility testing (DST),
to ensure that the patient receives at least four drugs to which
the Mycobacterium tuberculosis strain is susceptible.
6–8Since
administration of appropriate therapy is a major prognostic factor,
accurate testing of second-line drugs is mandatory.
6,7,9–12However, this testing is generally poorly standardized and often
not quality controlled, which increases the risk of providing
inad-equate treatment.
13–16Several techniques, based on critical proportion and
critical concentration, have been described for M. tuberculosis
DST.
8,9,17–19Procedures for determining isoniazid and rifampicin
resistance are standardized and quality controlled, allowing for
relatively accurate determination of resistance rates for MDR-TB
surveillance at national and supranational levels.
2,3,14,15,20,21However, for second-line drugs these procedures are in part
unre-liable.
13,15,22In addition to poor reproducibility and extended
laboratory turnaround times, currently established techniques
provide no information on quantitative levels of drug resistance,
limiting the possibility of individualized treatment.
Commercially available molecular tests have been recently
implemented to detect mutations associated with resistance,
especially to isoniazid and rifampicin.
23In addition, reference
laboratories use more extended sequencing of molecular targets
to trace mutations associated with resistance.
24,25Mycobacterial growth indicator tube (MGIT) DST is a
well-established, standardized, semi-automated liquid system that
pro-vides reproducible results for first-line antituberculous drugs on the
basis of critical concentration testing using the Becton-Dickinson
(BD) MGIT 960 instrumentation (BD, Sparks, MD, USA).
26The
suit-ability of the system for second-line DST has also been evaluated.
27The TB eXiST (extended individual susceptibility testing) software
(BD) for interpretation of DST on the basis of the MGIT
instrumenta-tion was developed to allow for continuous growth monitoring and
more detailed analysis.
28Here, we used the MGIT 960
instrumen-tation equipped with the TB eXiST software to establish quantitative
DST for M. tuberculosis. The procedure was designed to combine the
endpoints of proportion and concentration testing with continuous
monitoring of bacterial growth. We validated the specificity of the
resistance detected by assessing the concordance with genetic
profiles of resistance. Quantitative DST provides results on
quantita-tive measures of resistance, which can help in optimizing treatment
regimens for MDR-TB patients.
Materials and methods
TB eXiST susceptibility testing protocol
The following antituberculous agents were tested: isoniazid, ethionamide, rifampicin, rifabutin, ethambutol, streptomycin, para-aminosalicylic
acid, pyrazinamide, ofloxacin, moxifloxacin, amikacin, capreomycin and linezolid. Antituberculous drugs were purchased from Sigma (St Louis, MO, USA), except for pyrazinamide, linezolid and moxifloxacin, which were provided by BD, Pfizer (Singapore) and Merck (Whitehouse Station, NJ, USA), respectively. The drug concentrations selected for testing (Table1) were based on literature data on drug resistance, distribution of the WT isolates [epidemiological cut-off (ECOFF)], critical concentrations and in vivo drug concentrations.29–31Stock solutions were prepared
in-house according to the manufacturers’ recommendations. A 10× solu-tion was prepared in a volume of 200 mL and added to a 7 mL MGIT tube along with 0.8 mL of OADC (BD). The 100% inoculum for MGIT testing was prepared as follows. Briefly, strains were grown for an additional 2 days after MGIT reached positivity (growth units .400) and used as pure inocu-lum or strains were grown until 5 days after positivity and diluted to 1 : 5 in 7H9 supplemented with 10% OADC. After 10- and 100-fold dilutions in MGIT medium, 0.5 mL of the 100%, 10% and 1% inocula were distributed into the growth control tubes. The 1% inoculum was termed the growth control (GC). An equal volume of 0.5 mL of the 100% inoculum was distrib-uted in all the drug-containing tubes.
Strains were submitted to a screening protocol in order to distinguish WT strains from strains suspected of resistance. This protocol consisted of testing all drugs at the lowest drug concentration (Table1) used as a screening concentration, which corresponds to an optimized critical or ECOFF concentration. Strains were submitted to a quantitative testing protocol for those drugs for which they were suspected to be resistant on the basis of screening concentration testing. For quantitative testing, three to four concentrations per drug were used, except for pyrazinamide where only one concentration was tested (Table1).
MDR-TB cases and participating centres
Patients living in a European country at the time of diagnosis, whatever their country of birth, were included if their M. tuberculosis strain was MDR. Each centre included between 10 and 30 randomly chosen MDR cases diagnosed in 2009; however, if there were ,10 cases, cases from 2010 were also included (Table S1, available as Supplementary data at JAC Online). Clinical M. tuberculosis strains were subjected to resistome analysis, i.e. a search for resistance-associated gene mutations by using commercial line probe assays followed by PCR sequencing when neces-sary. The gene regions studied are listed in Table2.
Expert laboratories from nine European countries (Belgium, France, Germany, Italy, the Netherlands, Portugal, Spain, Sweden and Switzerland) participated in the study. This protocol received agreement from the institutional ethics review boards of each centre. At least one rep-resentative of each centre participated at the meetings organized: (i) at the beginning of the study to agree on the protocol; (ii) following the cali-bration and proficiency testing to optimize the protocol; and (iii) several times during the study, i.e. when phenotypic (culture-based) and geno-typic (gene mutation-based) results became available. Each centre fol-lowed its established procedures for quality assurance. A steering committee (E. C., M. V. and E. C. B.) met several times between the group meetings and analysed the data. The interlaboratory reproducibility of the protocol was assessed by comparing results obtained in each of the participant laboratories for a set of 10 M. tuberculosis control strains: 5 strains for calibration (strain susceptibility was known to the participant) and 5 strains for evaluating the proficiency testing (strain susceptibility was unknown to the participant). These strains were provided by the National Center for Mycobacteria, Institute of Medical Microbiology, University of Zurich. In addition, each centre tested three to five WT pan-susceptible clinical strains isolated in their country. The calibration panel included three strains monoresistant to isoniazid (two with a katG S315T mutation and one with an inhA c215t mutation conferring resistance also to ethionamide), one strain resistant to isoniazid (katG S315T) and strep-tomycin (rrs a523g), and one strain resistant to rifampicin and rifabutin
(rpoB H526Y). The proficiency testing included two strains with resistance to isoniazid (one inhA c215t and one katG S315T), one strain resistant to rifampicin and rifabutin (rpoB S531L), one strain resistant to isoniazid (katG S315T) and to streptomycin (rpsL K43R), and one strain resistant to isoniazid (katG S315T) and to ethambutol (embB M306V).
Results
General features of TB eXiST DST
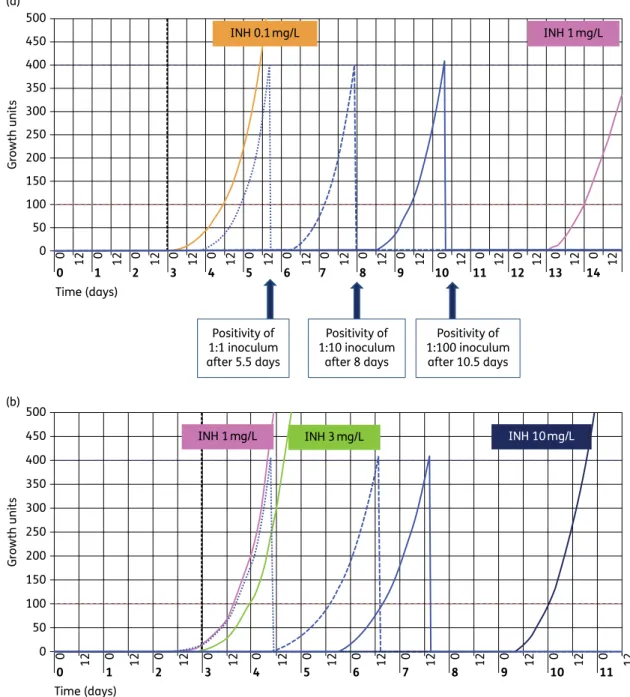
Drug resistance was initially detected by testing growth at the
screening drug concentration. Resistance was subsequently
quantified using higher drug concentrations. Since TB eXiST results
are available in real time, the growth was recorded in parallel in
control tubes and in drug-containing tubes. Figure
1
shows
exam-ples of growth curves for the three control tubes that contained
100%, 10% and 1% of the inoculum, resulting in three parallel
curves separated by a theoretical mean of 3.5 days, which is the
approximate time for an M. tuberculosis bacterial population to
multiply by 10-fold. When growth was observed in the
drug-containing tube before the GC (1% inoculum) was positive, this
indicated that .1% of the population was growing in the
pres-ence of the drug, i.e. as per proportion testing the strain is
consid-ered resistant at the corresponding drug concentration. By
studying bacterial growth at several drug concentrations, we
observed that the quantitative levels of resistance differed
signifi-cantly for the different antituberculous drugs and strains studied
(Figure
1
).
The time to result, calculated as the time elapsed until the GC
became positive, was ,30 days in all centres. Statistics,
calcu-lated in three of the nine centres, showed mean and median
values of time to results between 10 and 11 days with a range
of 8– 30 days. For most isolates, the time to positivity in the
drug-containing tubes was shorter than that of the GC and equal to that
of the 100% inoculum, since for most strains and drugs the
resist-ant proportion was close to 100%. The mean and median time to
obtain resistance testing results was calculated as 4 and 5 days
(range 3.5 – 13.5 days). Since growth curves were observed in a
real-time manner, resistance could be suspected as rapidly as
5 days after inoculation (Figure
1
b and c).
All laboratories performed the calibration and proficiency
test-ing. A high rate of concordance (88% –97% with regard to strain
and drug) was observed. Adjustments were necessary for the
preparation of the stock solutions and we compared the results
of quantitative resistance with regard to strains with the same
genotype. This led to the exclusion of some of the data, for
which we suspected a problem of drug preparation: rifabutin (19
results were excluded), para-aminosalicylic acid (15 results were
excluded) and ethionamide (15 results were excluded).
Assessment of resistance for clinical strains
Testing growth at the screening concentration, i.e. the lowest drug
concentration, distinguished susceptible strains from resistant
strains (Table
1
). Among the 139 MDR strains studied, resistance
to fluoroquinolones and to amikacin or capreomycin was
observed for 10 strains, corresponding to an XDR rate of 7.2%.
Resistant strains were submitted to quantitative testing for
con-firmation of resistance by retesting at the screening drug
concen-tration and for quantitative determination of the level of
resistance by studying growth at two to three additional higher
drug concentrations, except for pyrazinamide for which we tested
only a single concentration. The resistance patterns are presented
in Table
1
.
All strains studied were MDR strains; however, various levels of
resistance were observed for isoniazid and rifampicin. For
isoni-azid, four levels of resistance were observed: low-level resistance
with growth at 0.1 mg/L, but no growth at 1 mg/L (11 strains); two
intermediate levels of resistance with growth at 0.1 and 1 mg/L,
but no growth at 3 and 10 mg/L (51 strains) or growth at 0.1, 1
and 3 mg/L, but no growth at 10 mg/L (58 strains); and high-level
resistance with growth at all drug concentrations (19 strains). For
rifampicin, the resistance was high level for 84% of the strains.
Cross-resistance to rifabutin was observed for 98% of the strains,
although the levels of resistance were different for the two
rifamycins.
In total, 720 resistant characters were observed, with a
resist-ant character being defined as one drug resistance observed in
one isolate. Low-level resistance, i.e. resistance to the screening
concentration, but susceptibility at higher drug concentrations,
was observed in 16% of the test results and at varying rates
according to the drug, from 5% (rifampicin) to 73% (ethambutol).
Conversely, high-level resistance, i.e. resistance to the highest
drug concentration tested, was observed in 49% of the isolates,
at rates between 2% (ethambutol) and 84% (rifampicin)
accord-ing to the drug. Antituberculous drugs could be divided into three
groups: predominantly high levels of resistance were observed for
rifampicin, rifabutin, amikacin; low levels of resistance were
mainly observed for ethambutol; and various levels of resistance
were observed for isoniazid, streptomycin, capreomycin,
para-aminosalicylic acid, ethionamide, ofloxacin and moxifloxacin.
Genotypic investigation of resistance
Data on the number of resistant strains in which we found at least
one mutation involved in resistance are presented in Table
2
.
When molecular assays did not detect a mutation in a resistant
strain, we repeated the molecular analysis on bacteria grown in
the drug-containing tubes in order to avoid false test results
due to heteroresistance, i.e. coexistence of susceptible and
resist-ant bacteria.
32,33Genetic analysis was not done for
para-aminosalicylic acid resistance since the underlying genetic
mechanisms are still a matter of debate
34and not for linezolid
for which no resistant strains were observed. Overall, we observed
resistance mutations in .80% of the resistant strains, except for
ethambutol. Since the same mutation can confer
cross-resistance, we also compared the phenotypes of isoniazid and
ethionamide resistance in the case of inhA mutations, rifampicin
and rifabutin resistance in the case of rpoB mutations, amikacin
and capreomycin resistance in the case of a mutation in the rrs
1400 region and ofloxacin and moxifloxacin resistance in the
case of gyrA mutations.
katG mutations were the most prevalent mutation (85%) in
strains resistant to isoniazid, with S315T being the most frequent
katG mutation (96%) and associated with an intermediate level of
resistance (for the frequency of genotypes see Table
2
, for
geno-type – phenogeno-type relationships see Table
3
and for mutations in
strains with low-level resistance see Table
4
). Mutations in the
inhA promoter region were associated with low-level isoniazid
resistance. rpoB mutations at position 531 were the most
prevalent rifampicin resistance mutation (98/139, 71%) and were
associated with high-level resistance to rifampicin and rifabutin.
Altogether, 21 patterns of rpoB mutations were observed at 13
different codons, reflecting the diversity of the MDR strains in
the nine European countries. We confirmed that rpoB mutations
occurred also frequently at position 516 (12 strains) and at
pos-ition 526 (14 strains). Mutations at pospos-ition 526 were mostly
associated with high-level resistance to rifampicin and rifabutin
(11/14 for rifampicin and 9/11 for rifabutin). In contrast,
muta-tions at position 516 were mostly associated with low-level
resist-ance to rifabutin (8/10 resistant strains) or even no resistresist-ance
(1/11 strains tested). Some, but not all, mutations are shown in
Table
3
. Resistance to ethionamide was associated with
muta-tions in inhA (55%), in ethA (61%) or both (16%). Mutamuta-tions in
0 0 1 2 3 4 5 6 7 8 9 10 11 12 13 14 0 0 0 0 0 0 0 0 0 12 0 0 0 0 0 0 12 12 12 12 12 12 12 12 12 12 12 12 12 12 50 100 150 200 250 300 350 400 450 500 (a) Time (days) Growth units 0 50 100 150 200 250 300 350 400 450 500 (b) Growth units 0 1 0 0 12 Time (days) 2 0 12 3 0 12 4 0 12 5 0 12 6 0 12 7 0 12 8 0 12 9 0 12 10 0 12 11 0 12 12 INH 0.1mg/L INH 1mg/L Positivity of 1:1 inoculum after 5.5 days Positivity of 1:10 inoculum after 8 days Positivity of 1:100 inoculum after 10.5 days INH 10mg/L INH 3mg/L INH 1mg/L
Figure 1. Representative results for quantitative resistance testing using the TB eXiST software. Growth in control tubes appears as blue lines; dotted line for 1:1; discontinuous line for 1:10 and continuous line for 1:100 (GC). (a) Low-level resistance to isoniazid (inhA c215t): resistance to isoniazid at 0.1 mg/L (orange line) observed for 100% of the inoculum, but susceptibility at 1 mg/L (pink line). (b) Intermediate resistance to isoniazid (katG S315T): resistance to isoniazid observed at 1 mg/L (pink line) and at 3 mg/L (green line) for 100% of the inoculum, but susceptibility at 10 mg/L (dark blue line). (c) Homogeneous high-level resistance to ofloxacin (mutation gyrA D94A): resistance observed at 1 mg/L (pink line), 2 mg/L (green line) and 10 mg/L (dark blue line). (d) Heteroresistance for ofloxacin and intermediate level of resistance (gyrA A90V): resistance observed at 1 mg/L (pink line) and 2 mg/L (green line) for between 10% and 1% of the inoculum. See the text for interpretation of positive and negative growth results. INH, isoniazid; OFX, ofloxacin.
ethA were various with deletions and stop codons introduced at
different sites of the gene sequence.
Phenotypic resistance to pyrazinamide, i.e. growth at the
con-centration of 100 mg/L, was highly associated with mutations in
pncA: various missense mutations for 53 strains, deletion
muta-tions for 4 strains and insertion mutamuta-tions for 7 strains. In
add-ition, pyrazinamidase production was negative in 31/33 (94%)
resistant strains subjected to this biochemical test. This shows
that both altered pncA gene and absence of pyrazinamidase
pro-duction confirmed the resistant character. embB mutations at the
hot-spot 306 codon were observed in 70% of the resistant strains,
indicating either that the remaining strains harbour an unknown
mechanism of resistance or that the screening concentration
does not reliably discriminate between susceptible and resistant
strains. However, most of the strains devoid of embB mutations
showed only a low level of resistance. We noticed that mutations
0 50 100 150 200 250 300 350 400 450 500 (c) Growth units 0 1 0 0 12 Time (days) 00 12 10 Time (days) 20 12 30 12 40 12 50 12 60 12 70 12 80 12 90 12 100 12 110 12 120 12 130 12 140 12 12 2 0 12 3 0 12 4 0 12 5 0 12 6 0 12 7 0 12 8 0 12 9 0 12 10 0 12 11 0 12 12 0 12 13 0 12 14 0 12 12 0 50 100 150 200 250 300 350 400 450 500 (d) Growth units OFX 1mg/L OFX 2mg/L OFX 10 mg/L OFX 1mg/L OFX 2mg/L Figure 1. Continued
M306V and M306I were not associated with the same level of
resistance to ethambutol: 42% (10/24) of the strains harbouring
the mutation M306V were resistant at 12.5 mg/L, but only 7%
(1/14) of those with the mutation M306I.
Resistance to streptomycin was associated either with a
muta-tion in the rrs 530 region or in the rpsL gene encoding the S12
ribo-somal protein (position 43 or 88, numbering system of Escherichia
coli). For 23 streptomycin-resistant strains without rrs or rpsL
mutations, we found a gidB mutation in 16 strains. This was
more often associated with low-level resistance. For amikacin
resistance, we observed the mutation a1408g in the rrs gene in
all but four resistant strains, the latter showing resistance at a
low level only. Capreomycin resistance was observed as
cross-resistance with amikacin mediated by the rrs a1408g mutation
and also as isolated capreomycin resistance with mutation in
tlyA in five strains with no rrs mutation.
Resistance to fluoroquinolones correlated with gyrA mutations.
However, the correlation was stronger for moxifloxacin than for
ofloxacin, since three strains without gyrA and gyrB mutations
showed a low level of resistance to ofloxacin, but susceptibility
to moxifloxacin. The main problem for fluoroquinolone molecular
resistance detection was heteroresistance, since in 72% (18/25)
the gyrA mutation was evidenced only when molecular retesting
was done on bacteria grown in drug-containing medium.
Discussion
The lack of standardization and reproducibility in DST of M.
tuber-culosis hinders the control of TB disease and facilitates the spread
of drug-resistant organisms. This is especially true for second-line
agents. In this multicentre study, we evaluated the feasibility and
reliability of a standardized and automated DST procedure able to
quantify levels of drug resistance to first- and second-line
antitu-berculous drugs. The results of our DST measurements were
vali-dated by assessing the concordance with resistance-associated
gene mutations.
The primary objective of DST is to distinguish resistant strains
from susceptible strains, since resistance is prognostic of
treat-ment failure and relapse.
35Historically, two principles were
followed in DST: critical drug concentration and critical
propor-tion.
13,36,37Several DST methods, including newly developed
ones such as microscopic observation drug susceptibility, nitrate
reductase assay and colorimetric tests, have since been
described, all based on, but also limited by the principles of, critical
proportion and critical drug concentration.
17,18,38Unfortunately,
DST is done differently not only in different parts of the world,
but even within Europe. In Europe alone, three methods are
mainly used for DST of M. tuberculosis: proportion testing, the
absolute concentration method and the resistance ratio. As a
result of the different methods used, it is difficult to compare
the results from one laboratory with those from another
labora-tory, even for the same patient and the same strain. In addition,
for most drugs and techniques, only a single drug concentration is
tested while the quantitative levels of resistance may be
import-ant for treatment.
We aimed to improve DST for MDR M. tuberculosis by increasing
the accuracy of resistance detection as well as that of
susceptibil-ity assessment. Since exhaustive testing is required for MDR-TB
cases, we invested into a DST technique compatible with
automa-tion, standardization and rapid time to result. Automated
proce-dures offer significant advantages in terms of personnel handling,
standardization and quality control.
The DST procedure we developed follows a first step in which
bacterial growth is assessed in the presence of a ‘screening drug
Table 1. Phenotypic resistance observed for the 139 MDR strains of M. tuberculosis and detailed for the level of resistance (except pyrazinamide) by quantitative DST
Drug (list of concentrations tested in mg/L) No. of resistant strainsa Low-level resistanceb Intermediate-level resistancec High-level resistanced
Isoniazid (0.1, 1, 3, 10) 139 11 (8%) 109 (78%) 19 (14%) Rifampicin (1, 4, 20) 139 7 (5%) 15 (11%) 117 (84%) Rifabutin (0.1, 0.4, 2) 118 11 (9%) 23 (19%) 84 (71%) Ethambutol (5, 12.5, 50) 56 41 (73%) 14 (25%) 1 (2%) PAS (4, 16, 64) 11 4 (36%) 3 (27%) 4 (36%) Pyrazinamide (100) 65 NT NT NT Streptomycin (1, 4, 20) 107 17 (16%) 22 (21%) 68 (64%) Ethionamide (5, 10, 25) 57 10 (18%) 10 (18%) 37 (65%) Amikacin (1, 4, 20) 22 4 (18%) 0 18 (82%) Capreomycin (2.5, 5, 25) 24 4 (17%) 20 (83%) 0 Ofloxacin (1, 2, 10) 25 3 (12%) 19 (76%) 3 (12%) Moxifloxacin (0.25, 0.5, 2.5, 7.5) 22 3 (14%) 18 (82%) 1 (5%) Linezolid (1, 4, 16) 0 0 0 0
Total resistant characters 720 115 (16%) 253 (35%) 352 (49%)
PAS, para-aminosalicylic acid; NT, not tested.
aPhenotypic resistance was determined by growth at the screening concentration (in bold). This concentration was repeated in the quantitative DST
along with higher concentrations of the drug.
bLow-level resistance was defined as resistance at the screening concentration, but susceptibility at the intermediate drug concentration.
cIntermediate-level resistance was defined as resistance at the screening concentration and the intermediate concentration, but susceptibility at the
highest concentration.
dHigh-level resistance was defined as resistance at all concentrations tested.
concentration’ that is close to the ECOFF described recently for
iso-niazid, rifampicin, ethambutol and fluoroquinolones.
29–31This
concentration is the smallest MIC value for the WT strains, i.e.
sus-ceptible strains will not grow at this concentration. The second
step was limited to strains resistant at the screening drug
concen-tration. This second step confirmed the resistance by retesting the
screening concentration and in addition provided a quantitative
assessment of resistance by testing different drug concentrations.
Knowing the level of resistance has two advantages: it gives
infor-mation on the putative mechanism of resistance and it may have
a significant clinical impact. Recent studies showed that an
increase in the dosage of isoniazid or rifampicin may improve
MDR outcome.
39,40A low level of resistance can also be overcome
by the use of a more potent drug such as the use of moxifloxacin
instead of ofloxacin in case of defined gyrA mutations.
41,42We
also confirmed that some strains resistant to rifampicin are only
low-level resistant to rifabutin and harboured a specific rpoB
mutation at codon 516.
43,44Although the clinical efficacy of
rifa-butin in these cases remains to be demonstrated, the lack of
effective drugs in some MDR cases may benefit from rifabutin if
still active. A low level of resistance to ethionamide, as we
observed in the majority of strains, may allow the use of an
ethio-namide booster in the future.
45,46In addition to quantitative DST determination, we also searched
for resistance-associated mutations with the view to confirm that
most of the strains categorized as resistant were not WT strains
and to increase our knowledge on the resistance levels these
muta-tions confer. Hot-spot mutamuta-tions were found as expected in rpoB at
codon 531 for strains resistant to rifampicin, in katG at codon 315 for
strains resistant to isoniazid, in gyrA at codon 90 or 94 for strains
Table 2. Phenotypic and genotypic resistance per antituberculous drug among the 139 MDR strains of M. tuberculosis tested
Drug
Phenotypic resistancea Genotypic resistance
Gene and codon screened (no. of strains with mutationb; %c)
no. of resistant strains
resistance rate (%)
no. of strains with at least one mutation
rate of phenotypically resistant strains with mutation (%)
Rifampicin 139 100 139 100 rpoB codons 511–533d(139; 100)
Rifabutin 118 100 118 100 rpoB codons 511–533d(118; 100)
Isoniazid 139 100 135 97 katG codon 315eand others (115; 85)
inhA promoter (30; 22) inhA genef(15; 11)
Ethionamide 57 46 49 86 ethA (30; 61)
inhA promoter and inhA genef,g(27; 55)
ethR (0; 0)
Ethambutol 56 40 39 70 embB codon 306e(39; 100)
Pyrazinamide 65 47 64 98 pncA (64; 100%) Streptomycin 107 77 98 92 rpsL codons 43– 88d(68; 69) rrs region 530d(17; 17) gidBh(16; 16) Amikacin 22 16 18 82 rrs region 1400d–1495 (18; 100) Capreomycin 24 17 23 96 rrs region 1400d–1495 (18; 78) tlyAi(5; 22)
Ofloxacin 25 18 22 88 gyrA codons 88e–94 (22; 100) gyrBj(0; 0)
Moxifloxacin 22 16 22 100 gyrA codons 88e–94 (22; 100) gyrBj(0; 0)
PAS 11 9 NA NA NA
Linezolid 0 0 0 0 NA
PAS, para-aminosalicylic acid; NA, not applicable (for PAS resistance, gene mutations have not been established; for linezolid, no resistant strains were observed).
aPhenotypic resistance at the screening concentration.
bStrains may have mutations in several genes (see the text for details). cPercentage of strains with mutation at this codon or in this gene. dNumbering system of E. coli.
eNumbering system of M. tuberculosis. fSequence of the structural inhA gene.
gSixty-seven out of 139 were studied for the entire inhA gene sequence.
hgidB was sequenced for 18 of the 23 streptomycin-resistant strains without mutation in both rrs and rpsL. itlyA was sequenced for the six capreomycin-resistant strains without mutation in rrs.
resistant to ofloxacin and moxifloxacin, in rpsL at codons 43 and 88
for strains resistant to streptomycin and in rrs at nucleotide a1408
for strains resistant to amikacin. Resistance mutations were
scat-tered in genes coding for ethA and pncA as described previously,
since many different mutations can confer a loss or decrease in
the function of these proteins, which activate ethionamide and
pyr-azinamide, respectively.
47,48Although some of the latter mutations
have not been described yet, we consider it unlikely that they are
related to simple gene polymorphisms.
To date, evidence is accumulating that the term ‘resistance’ in
M. tuberculosis is not a biological entity, but quite heterogeneous
and composed of quantitatively different levels of drug resistance.
Most significantly, the quantitatively different resistance levels—
low, moderate and high levels of resistance—are associated
with different genetic mutations.
31,49This biological diversity of
resistance is not recognized by the current critical concentration
or ECOFF testing, but requires measures of quantitative resistance
determination. Through this multicentre study, we established
and evaluated a standardized protocol for quantitative DST. The
procedure developed integrates the established principles of
crit-ical concentration and critcrit-ical proportion, combined with
quanti-tative measures of drug resistance, automated detection and
continuous monitoring, exploring drug susceptibility in the
dimen-sions of concentration, proportion and time. Work still needs to be
done to resolve some discrepancies between phenotypic and
genotypic tests as in the case of ethambutol. In addition, group
4 and 5 antituberculous drugs
8and new ones, such as bedaquiline
and delamanid, will need to be tested.
50,51Hopefully, a more
thor-ough description of resistance in clinical strains will allow better
exploitation of available antituberculous agents in the treatment
Table 3. Genotype–phenotype relationship of the most prevalent resistance gene mutations
Drug Mutationa Low-level resistanceb Intermediate-level resistancec High-level resistanced Isoniazid katG S315T (n¼99) 1/99 92/99 6/99 inhA promoter (n¼6) 5/6 1/6 0/6 Rifampicin rpoB S531L (n¼98) 1/98 2/98 95/98 rpoB D516V (n ¼12) 2/12 9/12 1/12 rpoB H526L (n¼3) 2/3 0/3 1/3 rpoB H526Y (n¼4) 0/4 1/4 3/4 rpoB H526D (n¼6) 0/6 0/6 6/6 Rifabutin rpoB S531L (n¼87) 0/87 17/87 70/87 rpoB D516V (n ¼9) 6/9 2/9 1/9 rpoB H526L (n¼2) 1/2 0/2 1/2 rpoB H526Y (n¼3) 0/3 0/3 3/3 rpoB H526D (n¼5) 0/5 0/5 5/5
Ethambutol embB M306I (n ¼14) 13/14 1/14 0/14
embB M306V (n¼24) 14/24 10/24 0/24
Ethionamide inhA promoter (n¼8) 2/8 2/8 4/8
ethA (n¼21) 4/21 3/21 14/21 Streptomycin rrs a523c (n ¼7) 0/7 2/7 5/7 rrs c526t (n¼8) 3/8 4/8 1/8 rpsL K43R (n¼55) 0/55 2/55 53/55 rpsL K88R (n¼9) 0/9 5/9 4/9 gidBe(n ¼16) 9/16 7/16 0/16
Amikacin rrs a1408 mutation (n¼18) 0/18 0/18 18/18
rrs a1408 WT (n ¼4) 4/4 0/4 0/4
Capreomycin rrs a1408 mutation (n¼18) 3/18 15/18 0/18
tlyAf(n¼5) 1/5 4/5 0/5
Ofloxacin gyrA A90V (n ¼3) 0/3 3/3 0/3
gyrA S91P (n¼5) 0/5 5/5 0/5
gyrA D94G (n¼7) 0/7 6/7 1/7
Moxifloxacin gyrA A90V (n ¼3) 2/3 1/3 0/3
gyrA S91P (n¼5) 0/5 4/5 1/5
gyrA D94G (n¼7) 0/7 7/7 0/7
aOnly single mutations were considered and mutations observed in less than three strains are not shown.
bLow-level resistance was defined as resistance at the screening concentration, but susceptibility at the intermediate drug concentration.
cIntermediate-level resistance was defined as resistance at the screening concentration and the intermediate concentration, but susceptibility at the
highest concentration.
dHigh-level resistance was defined as resistance at all concentrations tested.
eEighteen out 23 streptomycin-resistant strains with no mutation in rrs and rpsL were tested for gidB. fThe six capreomycin-resistant strains WT for rrs 1400 were tested for tlyA.
of drug-resistant TB disease, by tailoring therapy according to the
resistance characteristics of individual strains. The time has come
for personalized medicine in the treatment of drug-resistant TB
disease.
Acknowledgements
We thank very much the following colleagues for their help in the study design, strain collection and testing: Gema Barbeito, Isabel Couto, Ba´rbara Gomila, Vincent Jarlier, Pontus Jureen, Paola Mantegani, Maryse Fauville-Dufaux, Faiza Mougari, Jorge Ramos, Karine Soetaert, Nicolas Veziris and Jim Werngren. We thank the technicians involved in each laboratory participating in the study. We are grateful to Ulrike Kunert for secretarial and logistical assistance.
Funding
This study was supported by internal funding.
Transparency declarations
BD provided assistance for software and helped organizing meetings of the network. BD had no influence on the design of the study or on the decision to publish. E. C. B. is a consultant of BD. All other authors: none to declare.
Supplementary data
Table S1 is available as Supplementary data at JAC Online (http://jac. oxfordjournals.org/).
References
1 Gandhi NR, Nunn P, Dheda K et al. Multidrug-resistant and extensively drug-resistant tuberculosis: a threat to global control of tuberculosis. Lancet 2010; 375: 1830– 43.
2 ECDC/WHO Regional Office for Europe. Tuberculosis Surveillance and Monitoring in Europe 2014. Stockholm: ECDC, 2014.
3 Dheda K, Gumbo T, Gandhi NR et al. Global control of tuberculosis: from extensively drug-resistant to untreatable tuberculosis. Lancet Respir Med 2013; 2: 321–38.
4 Espinal MA, Kim SJ, Suarez PG et al. Standard short-course chemother-apy for drug-resistant tuberculosis: treatment outcomes in 6 countries. JAMA 2000; 283: 2537–45.
5 Quy HT, Lan NT, Borgdorff MW et al. Drug resistance among failure and relapse cases of tuberculosis: is the standard re-treatment regimen adequate? Int J Tuberc Lung Dis 2003; 7: 631– 6.
6 Burman WJ. The value of in vitro drug activity and pharmacokinetics in predicting the effectiveness of antimycobacterial therapy: a critical review. Am J Med Sci 1997; 313: 355– 63.
7 Pietersen E, Ignatius E, Streicher EM et al. Long-term outcomes of patients with extensively drug-resistant tuberculosis in South Africa: a cohort study. Lancet 2014; 383: 1230–9.
8 WHO. Guidelines for the Programmatic Management of Multidrug Resistant Tuberculosis. Geneva: WHO, 2011.
9 Flament-Saillour M, Robert J, Jarlier V et al. Outcome of multi-drug-resistant tuberculosis in France: a nationwide case – control study. Am J Respir Crit Care Med 1999; 160: 587–93.
10 Drobniewski F, Eltringham I, Graham C et al. A national study of clinical and laboratory factors affecting the survival of patients with multiple drug resistant tuberculosis in the UK. Thorax 2002; 57: 810– 6.
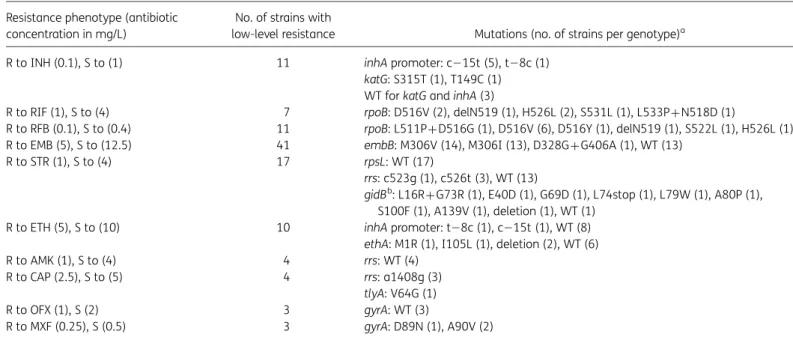
Table 4. Genotypic resistance detailed for the M. tuberculosis strains with a low level of resistance Resistance phenotype (antibiotic
concentration in mg/L)
No. of strains with
low-level resistance Mutations (no. of strains per genotype)a
R to INH (0.1), S to (1) 11 inhA promoter: c215t (5), t28c (1) katG: S315T (1), T149C (1) WT for katG and inhA (3)
R to RIF (1), S to (4) 7 rpoB: D516V (2), delN519 (1), H526L (2), S531L (1), L533P+N518D (1)
R to RFB (0.1), S to (0.4) 11 rpoB: L511P+D516G (1), D516V (6), D516Y (1), delN519 (1), S522L (1), H526L (1) R to EMB (5), S to (12.5) 41 embB: M306V (14), M306I (13), D328G+G406A (1), WT (13)
R to STR (1), S to (4) 17 rpsL: WT (17)
rrs: c523g (1), c526t (3), WT (13)
gidBb: L16R+G73R (1), E40D (1), G69D (1), L74stop (1), L79W (1), A80P (1),
S100F (1), A139V (1), deletion (1), WT (1) R to ETH (5), S to (10) 10 inhA promoter: t28c (1), c215t (1), WT (8)
ethA: M1R (1), I105L (1), deletion (2), WT (6) R to AMK (1), S to (4) 4 rrs: WT (4)
R to CAP (2.5), S to (5) 4 rrs: a1408g (3) tlyA: V64G (1) R to OFX (1), S (2) 3 gyrA: WT (3)
R to MXF (0.25), S (0.5) 3 gyrA: D89N (1), A90V (2)
INH, isoniazid; RIF, rifampicin; RFB, rifabutin; EMB, ethambutol; ETH, ethionamide; STR, streptomycin; AMK, amikacin; CAP, capreomycin; OFX, ofloxacin; MXF, moxifloxacin; R, resistant; S, susceptible.
a
Only single mutations are listed, unless indicated otherwise. See Table2for numbering systems.
11 Turett GS, Telzak EE, Torian LV et al. Improved outcomes for patients with multidrug-resistant tuberculosis. Clin Infect Dis 1995; 21: 1238– 44.
12 Johnston JC, Shahidi NC, Sadatsafavi M et al. Treatment outcomes of multidrug-resistant tuberculosis: a systematic review and meta-analysis. PLoS One 2009; 4: e6914.
13 Heifets LB, Cangelosi GA. Drug susceptibility testing of Mycobacterium tuberculosis: a neglected problem at the turn of the century. Int J Tuberc Lung Dis 1999; 3: 564– 81.
14 Cambau E, Rush-Gerdes S. First and second line susceptibility testing for Mycobacterium tuberculosis complex. In: ECDC, ed. Mastering the Basics of Tuberculosis Control: Development of a Handbook on TB Diagnostic Methods. Stockholm: ECDC, 2011; 79 –87.
15 Drobniewski F, Rusch-Gerdes S, Hoffner S. Antimicrobial susceptibility testing of Mycobacterium tuberculosis (EUCAST document E.DEF 8.1)— report of the Subcommittee on Antimicrobial Susceptibility Testing of Mycobacterium tuberculosis of the European Committee for Antimicrobial Susceptibility Testing (EUCAST) of the European Society of Clinical Microbiology and Infectious Diseases (ESCMID). Clin Microbiol Infect 2007; 13: 1144–56.
16 Streicher EM, Muller B, Chihota V et al. Emergence and treatment of multidrug resistant (MDR) and extensively drug-resistant (XDR) tubercu-losis in South Africa. Infect Genet Evol 2011; 12: 686– 94.
17 Martin A, Imperiale B, Ravolonandriana P et al. Prospective multicentre evaluation of the direct nitrate reductase assay for the rapid detection of extensively drug-resistant tuberculosis. J Antimicrob Chemother 2014; 69: 441–4.
18 Fitzwater SP, Sechler GA, Jave O et al. Second-line anti-tuberculosis drug concentrations for susceptibility testing in the MODS assay. Eur Respir J 2012; 41: 1163– 71.
19 Clinical and Laboratory Standards Institute. Susceptibility Testing of Mycobacteria, Nocardiae, and Other Aerobic Actinomycetes—Second Edition: Approved Standard M24-A2. CLSI, Wayne, PA, USA, 2011. 20 Bernard C, Brossier F, Sougakoff W et al. A surge of MDR and XDR tuber-culosis in France among patients born in the former Soviet Union. Euro Surveill 2013; 18: pii¼20555.
21 Perdigao J, Macedo R, Silva C et al. From multidrug-resistant to exten-sively drug-resistant tuberculosis in Lisbon, Portugal: the stepwise mode of resistance acquisition. J Antimicrob Chemother 2012; 68: 27– 33. 22 Cambau E, Truffot-Pernot C, Boulahbal F et al. Mycobacterial growth indicator tube versus the proportion method on Lowenstein – Jensen medium for antibiotic susceptibility testing of Mycobacterium tuberculosis. Eur J Clin Microbiol Infect Dis 2000; 19: 938–42.
23 Hillemann D, Rusch-Gerdes S, Richter E. Evaluation of the GenoType MTBDRplus assay for rifampin and isoniazid susceptibility testing of Mycobacterium tuberculosis strains and clinical specimens. J Clin Microbiol 2007; 45: 2635– 40.
24 Brossier F, Veziris N, Aubry A et al. Detection by GenoType MTBDRsl test of complex mechanisms of resistance to second-line drugs and etham-butol in multidrug-resistant Mycobacterium tuberculosis complex isolates. J Clin Microbiol 2010; 48: 1683– 9.
25 Ritter C, Lucke K, Sirgel FA et al. Evaluation of the AID TB resistance line probe assay for rapid detection of genetic alterations associated with drug resistance in Mycobacterium tuberculosis strains. J Clin Microbiol 2014; 52: 940–6.
26 Bemer P, Palicova F, Rusch-Gerdes S et al. Multicenter evaluation of fully automated BACTEC Mycobacteria Growth Indicator Tube 960 system for susceptibility testing of Mycobacterium tuberculosis. J Clin Microbiol 2002; 40: 150–4.
27 Rodrigues C, Jani J, Shenai S et al. Drug susceptibility testing of Mycobacterium tuberculosis against second-line drugs using the Bactec MGIT 960 System. Int J Tuberc Lung Dis 2008; 12: 1449– 55.
28 Springer B, Lucke K, Calligaris-Maibach R et al. Quantitative drug sus-ceptibility testing of Mycobacterium tuberculosis by use of MGIT 960 and EpiCenter instrumentation. J Clin Microbiol 2009; 47: 1773–80.
29 Schon T, Jureen P, Chryssanthou E et al. Wild-type distributions of seven oral second-line drugs against Mycobacterium tuberculosis. Int J Tuberc Lung Dis 2011; 15: 502–9.
30 Angeby KA, Jureen P, Giske CG et al. Wild-type MIC distributions of four fluoroquinolones active against Mycobacterium tuberculosis in relation to current critical concentrations and available pharmacokinetic and phar-macodynamic data. J Antimicrob Chemother 2010; 65: 946– 52. 31 Bottger EC. The ins and outs of Mycobacterium tuberculosis drug sus-ceptibility testing. Clin Microbiol Infect 2011; 17: 1128– 34.
32 Folkvardsen DB, Svensson E, Thomsen VO et al. Can molecular meth-ods detect 1% isoniazid resistance in Mycobacterium tuberculosis? J Clin Microbiol 2013; 51: 1596– 9.
33 Streicher EM, Bergval I, Dheda K et al. Mycobacterium tuberculosis population structure determines the outcome of genetics-based second-line drug resistance testing. Antimicrob Agents Chemother 2012; 56: 2420– 7.
34 Mathys V, Wintjens R, Lefevre P et al. Molecular genetics of para-aminosalicylic acid resistance in clinical isolates and spontaneous mutants of Mycobacterium tuberculosis. Antimicrob Agents Chemother 2009; 53: 2100– 9.
35 Canetti G. Present aspects of bacterial resistance in tuberculosis. Am Rev Respir Dis 1965; 92: 687– 703.
36 Canetti G, Froman S, Grosset J et al. Mycobacteria: Laboratory Methods for Testing Drug Sensitivity and Resistance. Bull World Health Organ 1963; 29: 565–78.
37 Mitchison DA. What is drug resistance? Tubercle 1969; 50: Suppl: 44– 7. 38 Banfi E, Scialino G, Monti-Bragadin C. Development of a microdilution method to evaluate Mycobacterium tuberculosis drug susceptibility. J Antimicrob Chemother 2003; 52: 796–800.
39 Katiyar SK, Bihari S, Prakash S et al. A randomised controlled trial of high-dose isoniazid adjuvant therapy for multidrug-resistant tuberculosis. Int J Tuberc Lung Dis 2008; 12: 139–45.
40 van Ingen J, Aarnoutse R, de Vries G et al. Low-level rifampicin-resistant Mycobacterium tuberculosis strains raise a new therapeutic chal-lenge. Int J Tuberc Lung Dis 2011; 15: 990– 2.
41 Maruri F, Sterling TR, Kaiga AW et al. A systematic review of gyrase mutations associated with fluoroquinolone-resistant Mycobacterium tuberculosis and a proposed gyrase numbering system. J Antimicrob Chemother 2012; 67: 819–31.
42 Fillion A, Aubry A, Brossier F et al. Impact of fluoroquinolone resistance on bactericidal and sterilizing activity of a moxifloxacin-containing regi-men in murine tuberculosis. Antimicrob Agents Chemother 2013; 57: 4496– 500.
43 Yang B, Koga H, Ohno H et al. Relationship between antimycobacterial activities of rifampicin, rifabutin and KRM-1648 and rpoB mutations of Mycobacterium tuberculosis. J Antimicrob Chemother 1998; 42: 621– 8. 44 Sirgel FA, Warren RM, Bottger EC et al. The rationale for using rifabutin in the treatment of MDR and XDR tuberculosis outbreaks. PLoS One 2013; 8: e59414.
45 Grau T, Selchow P, Tigges M et al. Phenylethyl butyrate enhances the potency of second-line drugs against clinical isolates of Mycobacterium tuberculosis. Antimicrob Agents Chemother 2012; 56: 1142– 5.
46 Willand N, Dirie B, Carette X et al. Synthetic EthR inhibitors boost anti-tuberculous activity of ethionamide. Nat Med 2009; 15: 537–44.
47 Petrella S, Gelus-Ziental N, Maudry A et al. Crystal structure of the pyrazinamidase of Mycobacterium tuberculosis: insights into natural and acquired resistance to pyrazinamide. PLoS One 2011; 6: e15785.
48 Brossier F, Veziris N, Truffot-Pernot C et al. Molecular investigation of resistance to the antituberculous drug ethionamide in multidrug-resistant clinical isolates of Mycobacterium tuberculosis. Antimicrob Agents Chemother 2010; 55: 355–60.
49 Springer B, Calligaris-Maibach RC, Ritter C et al. Tuberculosis drug resistance in an area of low endemicity in 2004 to 2006: semiquantitative drug susceptibility testing and genotyping. J Clin Microbiol 2008; 46: 4064–7. 50 Gler MT, Skripconoka V, Sanchez-Garavito E et al. Delamanid for multidrug-resistant pulmonary tuberculosis. N Engl J Med 2012; 366: 2151– 60.
51 Andries K, Verhasselt P, Guillemont J et al. A diarylquinoline drug active on the ATP synthase of Mycobacterium tuberculosis. Science 2005; 307: 223–7.