O R I G I N A L A R T I C L E
Identi
fication of novel genes for glucose metabolism
based upon expression pattern in human islets and
effect on insulin secretion and glycemia
Jalal Taneera
1,
*, Joao Fadista
1
, Emma Ahlqvist
1
, David Atac
1
,
Emilia Ottosson-Laakso
1
, Claes B. Wollheim
1,2
, and Leif Groop
1
1
Department of Clinical Sciences, Diabetes and Endocrinology, Lund University Diabetes Centre, Skåne
University Hospital, Lund University, 205 02 Malmö, Sweden, and
2Department of Cell Physiology and
Metabolism, Université de Genève, University Medical Centre, 1 rue Michel-Servet, Geneva 4 1211, Switzerland
*To whom correspondence should be addressed at: Department of Clinical Science, Diabetes and Endocrinology, Lund University Diabetes Centre, Lund University, 205 02 Malmö, Sweden. Email: [email protected]Abstract
Normal glucose homeostasis is characterized by appropriate insulin secretion and low HbA1c. Gene expression signatures associated with these two phenotypes could be essential for islet function and pathophysiology of type 2 diabetes (T2D). Herein, we employed a novel approach to identify candidate genes involved in T2D by correlating islet microarray gene expression data (78 donors) with insulin secretion and HbA1c level. The expression of 649 genes (P < 0.05) was correlated with insulin secretion and HbA1c. Of them,five genes (GLR1A, PPP1R1A, PLCDXD3, FAM105A and ENO2) correlated positively with insulin secretion/ negatively with HbA1c and one gene (GNG5) correlated negatively with insulin secretion/positively with HbA1c were followed up. Thefive positively correlated genes have lower expression levels in diabetic islets, whereas GNG5 expression is higher. Exposure of human islets to high glucose for 24 h resulted in up-regulation of GNG5 and PPP1R1A expression, whereas the expression of ENO2 and GLRA1 was down-regulated. No effect was seen on the expression of FAM105A and PLCXD3. siRNA silencing in INS-1 832/13 cells showed reduction in insulin secretion for PPP1R1A, PLXCD3, ENO2, FAM105A and GNG5 but not GLRA1. Although no SNP in these gene loci passed the genome-wide significance for association with T2D in DIAGRAM+ database, four SNPs influenced gene expression in cis in human islets. In conclusion, we identified and confirmed PPP1R1A, FAM105A, ENO2, PLCDX3 and GNG5 as potential regulators of islet function. We provide a list of candidate genes as a resource for exploring their role in the pathogenesis of T2D.
Introduction
Diabetes is a globally expanding health issue, causing a great bur-den on healthcare in both developing and industrialized coun-tries (1). The incidence of type 2 diabetes (T2D) is increasing globally and expected to affect >550 million people by 2030 (www.idf.org/diabetesatlas), of which T2D accounts for >90% of cases. T2D is characterized by increased blood glucose owing to defects in insulin secretion from the pancreatic beta cells and impaired insulin action.
The pathogenesis of T2D is still not fully understood. It is well established that T2D develops from an interaction between gen-etic susceptibility and a westernized lifestyle characterized by in-creasing obesity. In the past 10 years, several genome-wide association studies (GWAS) have discovered >100 genetic var-iants associated with T2D or blood glucose/insulin secretion (2–12). Despite this large number, these variants can only explain 10–15% of the heritability of the disease (13,14). One main reason is that the effect size of each individual variant is very modest.
Received: September 3, 2014. Revised: November 13, 2014. Accepted: December 1, 2014
© The Author 2014. Published by Oxford University Press. All rights reserved. For Permissions, please email: [email protected] doi: 10.1093/hmg/ddu610
Advance Access Publication Date: 8 December 2014 Original Article
The key question is therefore whether more variants (close to 1000) would be able to explain the full genetic background of T2D or whether we need more holistic approaches combining DNA, RNA and protein information (15).
Diabetes is defined as a condition of chronic hyperglycemia, which can be monitored by measuring glycated hemoglobin A1c (HbA1c) (www.who.int/diabetes/publications/report-hba1c_2011). In untreated individuals, one would expect elevated HbA1c to be associated with impaired insulin secretion and vice versa, i.e. a low HbA1c value in normoglycemic individuals with normal or high insulin secretion.
Herein, we introduced a novel approach by correlating islet gene expression with insulin secretion and HbA1c levels in islets from 78 organ donors. Five genes correlated positively with insu-lin secretion/negatively with HbA1c (GLR1A, PPP1R1A, PLCDXD3, FAM105A and ENO2), whereas one gene (GNG5) correlated nega-tively with insulin secretion and posinega-tively with HbA1c. We then followed up thesefindings by siRNA silencing of the genes in an INS-1 cell line. We also analyzed whether SNPs in these genetic loci are associated with T2D in the DIAGRAM+ database or could influence gene expression in cis expression quantitative trait loci (eQTLs).
Results
Correlation between gene expression and insulin secretion and Hba1c
In this study, we utilized human pancreatic islet microarray expression data (GeneChip®Human Gene 1.0 ST) obtained from
78 donors (68 non-diabetic and 10 diabetic, see Materials and Methods). Each donor was characterized by measuring insulin response to glucose in the islet preparation and glycemic control (HbA1c) from the same individual. Spearman’s test was used to perform a global correlation of gene expression (adjusted for age and sex) with insulin secretion and HbA1c in the same 78 donors (each array has∼22 000 genes) (Fig.1). The expression of 649 genes (P-value < 0.05) showed significant correlation with insulin secretion and HbA1c levels (Fig.1B). Of these, 518 genes were positively correlated with insulin secretion and negatively with HbA1c, 128 genes were negatively correlated with insulin secretion and positively with HbA1c, 2 genes were positively correlated both with HbA1c and insulin secretion and only 1 gene negatively correlated with HbA1c and insulin secretion (Fig.1B, Supplementary Material, Table S1).
Figure 1. Spearman correlation of the expression of 22 000 genes on the chip against insulin secretion and HbA1c levels in human islets (A). (B) In total, 649 genes showed a significant correlation with insulin and HbA1c (P-value < 0.05). Of these, 518 genes correlated positively with insulin secretion and negatively with HbA1c (green square), 128 genes correlated negatively with insulin secretion and positively with Hba1c (red square), 2 genes correlated positively both with insulin secretion and HbA1c (black square), and one gene correlated negatively with insulin secretion and HbA1c (blue square). The X-axis and Y-axis scales represent the correlation coefficient. FDR and Bonferroni thresholds for each correlation are shown in Supplementary Material, Table S1. (C) Correlation of mean centroid of the 11 positively correlated genes to insulin secretion and HbA1c level. (D) Correlation of mean centroid of the 10 negatively correlated genes to insulin secretion and HbA1c levels.
Ranking of positively and negatively correlated genes
We ranked the 518 genes showing positive correlation with insu-lin and negative correlation with HbA1c (+insuinsu-lin/−HbA1c) and the 128 genes showing negative correlation with insulin and positive with HbA1c (insulin/+HbA1c) based upon the sum of their P-value correlation with insulin and HbA1c levels, given a rank from 1 to 518 or 128, respectively; the lowest ranking sum re-presents the top-ranked genes. We selected the 10 top-ranked genes from each group for further functional analyses.
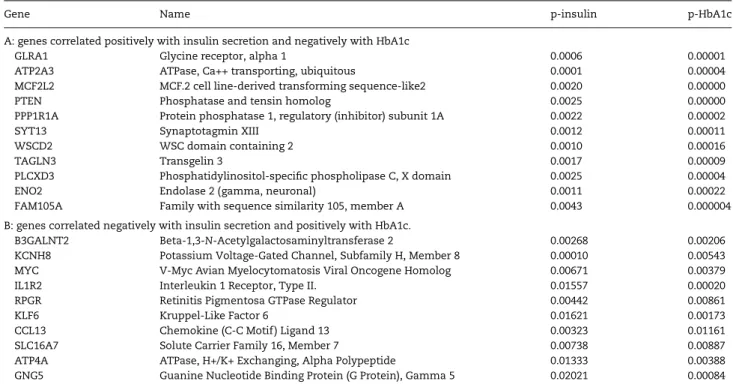
The top 10 ranked genes from the positively correlated group were GLRA1, ATP2A3, MCF2L2, PTEN, PPP1R1A, SYT13, WSCD2, TAGLN3, PLCXD3 and ENO2 (Table1A). To ensure that the 10 selected genes are indeed expressed inβ-cells, the genes were
filtered based upon recently published RNA-sequencing expres-sion data from sorted human pancreatic endocrine cells (16). All of them showed higher expression inβ-cells compared with α-cells or exocrine cells. Analysis of the expression profile of these genes in the islet expression array revealed a significant down-regulation in diabetic/hyperglycemic donors compared with non-diabetic/normoglycemic (Fig.2). Plotting expression centroid of the top 10 positively correlated genes against insulin secretion and HbA1c level showed a strong positive correlation with insulin secretion and an inverse correlation with HbA1c (Fig.1C). Moreover, analysis of the co-expression of these genes with glucagon (GCG) expression ( probes for the insulin gene were not on the affy chip) showed a significant positive
Table 1. Ten top-ranked genes ordered by the lowest sum of P-value for the correlation with HbA1c and insulin secretion
Gene Name p-insulin p-HbA1c
A: genes correlated positively with insulin secretion and negatively with HbA1c
GLRA1 Glycine receptor, alpha 1 0.0006 0.00001
ATP2A3 ATPase, Ca++ transporting, ubiquitous 0.0001 0.00004
MCF2L2 MCF.2 cell line-derived transforming sequence-like2 0.0020 0.00000
PTEN Phosphatase and tensin homolog 0.0025 0.00000
PPP1R1A Protein phosphatase 1, regulatory (inhibitor) subunit 1A 0.0022 0.00002
SYT13 Synaptotagmin XIII 0.0012 0.00011
WSCD2 WSC domain containing 2 0.0010 0.00016
TAGLN3 Transgelin 3 0.0017 0.00009
PLCXD3 Phosphatidylinositol-specific phospholipase C, X domain 0.0025 0.00004
ENO2 Endolase 2 (gamma, neuronal) 0.0011 0.00022
FAM105A Family with sequence similarity 105, member A 0.0043 0.000004
B: genes correlated negatively with insulin secretion and positively with HbA1c.
B3GALNT2 Beta-1,3-N-Acetylgalactosaminyltransferase 2 0.00268 0.00206
KCNH8 Potassium Voltage-Gated Channel, Subfamily H, Member 8 0.00010 0.00543
MYC V-Myc Avian Myelocytomatosis Viral Oncogene Homolog 0.00671 0.00379
IL1R2 Interleukin 1 Receptor, Type II. 0.01557 0.00020
RPGR Retinitis Pigmentosa GTPase Regulator 0.00442 0.00861
KLF6 Kruppel-Like Factor 6 0.01621 0.00173
CCL13 Chemokine (C-C Motif ) Ligand 13 0.00323 0.01161
SLC16A7 Solute Carrier Family 16, Member 7 0.00738 0.00887
ATP4A ATPase, H+/K+ Exchanging, Alpha Polypeptide 0.01333 0.00388
GNG5 Guanine Nucleotide Binding Protein (G Protein), Gamma 5 0.02021 0.00084
Figure 2. Fold change differences in islet expression of the top correlated genes between diabetic/hyperglycemic and nondiabetic/normoglycemic donors. The expression of the positive correlated genes GLRA1 (P = 0.001), ATP2A3 (P = 0.002), MCF2L2 (P = 0.003), PTEN (P = 0.007), PPP1R1A (P = 0.0002), SYT13 (P = 0.001), WSCD2 (P = 0.003), TAGLN3 (P = 0.003), PLCXD3 (P = 0.0001), ENO2 (P = 0.003) and FAM105A (P = 0.0003) was lower in diabetic/hyperglycemic (n = 23) donors compared with nondiabetic/normoglycemic (n = 43). The expression of the negative correlated genes B3GALNT2 (P = 0.047), MYC (P = 0.001), IL1R2 (P = 0.00002), SLC16A7 (P = 0.01) and GNG5 (P = 0.007) was lower in diabetic/hyperglycemic donors compared with nondiabetic/normoglycemic, whereas no change was seen in the expression of KCNH8, RPGR, KLF6, CCL13 and ATP4A. Bars represent mean ± SEM.
correlation with GCG (Fig.3). Some genes, e.g. ATP2A3 (17–19), PTEN (20,21) and SYT13 (22), have previously been implicated in insulin secretion and were not further examined. FAM105A was ranked as number 12, but because it belongs to the genes with unknown function in islets, we included it for functional fol-low-up. Hence, of the positively correlated genes, we selected five genes GLRA1, PPP1R1A, PLCXD3, ENO2 and FAM105A for fur-ther investigations.
Of the top-ranked negatively correlated genes B3GALNT2, KCNH8, MYC, IL1R1, RPGR, KLF6, CCL13, SLC16A7, ATP4A and GNG5 (Table 1B), the expression of B3GALNT2, MYC, IL1R1, SLC16A7 and GNG5 was higher in diabetic/hyperglycemic com-pared with non-diabetic/normoglycemic donors (Fig. 2). The expression centroid of the top 10 negative genes showed a strong negative correlation with insulin secretion and positive correl-ation with HbA1c (Fig.1D). Moreover, these 10 genes were signifi-cantly negatively correlated with glucagon (GCG) expression (Supplementary Material, Fig. S1). KCNH8 expression showed no correlation with GCG. Out of the 10 negatively correlated genes, 8 showed higher expression in pancreaticα-cells com-pared with β-cells, CCL13 was equally expressed and GNG5 showed higher expression in pancreaticβ-cells than that in α-cells (16). Therefore, only GNG5 was selected for functional studies.
Effect of glucose exposure on gene expression
The correlation with high HbA1c can either be the cause or con-sequence of elevated glucose levels. To address this question, we exposed human pancreatic islets from 51 donors to low (5.5 m) and high (18.9 m) glucose concentration for 24 h, assuming that genes whose expression increased after exposure to 24 h of glu-cose would represent secondary changes but still could mediate glucotoxic effects on islets. Given that these experiments were performed a year later than the microarray experiments, we switched to RNA sequencing for the glucose exposure experi-ments. Short-term exposure to high glucose showed a significant up-regulation of the expression of GNG5 (P = 0.0001) and PPP1R1A (P = 0.0002), whereas the expression of ENO2 (P = 0.002) and GLRA1 (P = 0.02) was down-regulated (Fig.4). No effect of acute high glucose exposure was seen on the expression of FAM105A (P = 0.9) and PLCXD3 (P = 0.4) (Fig.4).
Down-regulation of gene expression in clonal ratβ-cells (INS-1)
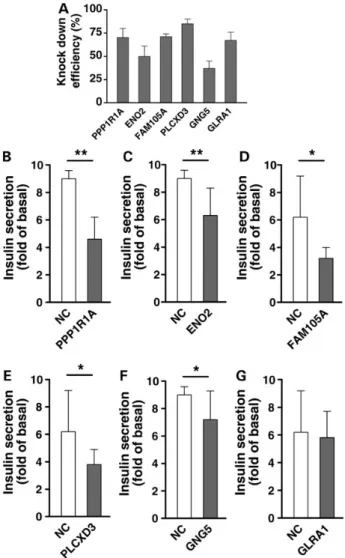
To explore whether the down-regulation of genes seen in hyper-glycemic islets would result in impaired insulin secretion and, in turn, hyperglycemia, we used RNA interference (siRNA) to silence the expression of 6 genes in INS-1 832/13 cells. We used RT-qPCR
to demonstrate sufficient knock-down efficiency that ranged from 50 to 85% (Fig.5A). Silencing of PPP1R1A, FAM105A, PLCXD3 ENO2 and GNG5 significantly reduced glucose-stimulated insulin secre-tion after 1 h of incubasecre-tion in 16.7 m glucose, whereas there was no effect of down-regulation of GLRA1 on insulin secretion (Fig.5B–F).
Association between SNPs in the selected genes and risk of T2D in the DIAGRAM+ database
We also analyzed whether SNPs within a region spanning ±50 kb up- and down-stream of the six selected genes were associated with T2D in the DIAGRAM+ database. This analysis included 193 SNPs in or around the GLR1A gene, 94 SNPs in PPP1R1A, 114 SNPs in FAM105A, 304 SNPs in PLCXD3, 139 in GNG5 and 28 in ENO2. While none of them as expected would pass the threshold for genome-wide significance, we cannot from the data exclude that any SNP in these genes could be pathogenically involved in T2D (Table2).
SNP effect on gene expression (eQTLs)
We also analyzed whether SNPs influenced gene expression in cis (within 250 kb of the SNP). For analysis purposes, we identified a single best‘sentinel’ SNP for each gene, defined as the SNP with the lowest P-value per eQTL gene. Applying these criteria and thresholds, we identified four cis-eQTLs in four genes. The strongest eQTLs were seen for rs35039612 (ENO2), rs1512906 (PPP1R1A), rs2347598 (GLRA1) and rs26173 (FAM105A) (Fig.6).
Discussion
In this study, we applied a novel approach to uncover potential candidate genes that contribute to the pathophysiology of T2D.
The material used included a large number of islets from cadaver donors, in which DNA and RNA profiles could be related to glu-cose-stimulated insulin secretion as well as HbA1c levels. We first tried to identify a gene pattern associated with low HbA1c and normal or high insulin secretion (n = 518). To verify the link between insulin secretion and HbA1c, we disrupted the expres-sion of some of the genes showing this pattern. Secondly, we as-sumed that genes associated with high HbA1c and low insulin secretion could contribute to disease susceptibility (n = 128). However, the latter scenario could also be secondary to elevated HbA1c with the so-called glucotoxicity [for review, see Weir and Bonner-Weir (23)]. To explore this possibility, we also exposed human islets to short-term high glucose to identify genes whose expression would change. These gene lists should provide a resource for further studies (see gene description in the Supple-mentary Material for the top correlated genes). We could only select a small number of genes for follow-up studies (siRNA) and focused on genes with little prior information on their poten-tial involvement in the regulation of insulin secretion. These genes are primarily expressed inβ-cells and, therefore, the siRNA experi-ments were performed in a clonal rat insulinoma cell line.
ATP2A3, PTEN and SYT13 from the positively correlated genes were excluded, as they have previously been implicated in insulin secretion and islet function. ATP2A3 plays a vital role in the se-questration of cytosolic Ca2+into the endoplasmic reticulum
(24). Several reports have shown that loss of ATP2A3 or down-regu-lation of gene expression inβ-cells was associated with diabetes in db/db mice (19), Goto-Kakizaki Wistar (GK) rats (18) and humans (17). SYT13 is a member of the synaptotagmin family and involved inβ-cell exocytosis (25). Recently, we showed that siRNA silencing of SYT13 expression reduced glucose-stimulated insulin secretion in INS-1 cells, which suggests that SYT13 contributes to impaired insulin secretion (22). PTEN is a phosphoinositide phosphatase
Figure 4. Effect of glucose exposure on gene expression. Human pancreatic islets (n = 51) treated with low (5.5 m) and high (18.9 m) glucose concentration for 24 h. Analysis of differential expression by RNA-seq showed a similar down-regulation of ENO2 (P = 0.002) and GLRA1 (P = 0.02) as seen during chronic hyperglycemia. In contrast, the expression of GNG5 (P = 0.0001) and PPP1R1A (P = 0.0002) was up-regulated by short-term elevated glucose. Glucose exposure had no effect on the expression of FAM105A (P = 0.9) and PLCXD3 (P = 0.4).
that regulates the PI3K/Akt signaling pathway (20). It was identi-fied as a negative regulator of insulin signaling with a major role in regulating glucose metabolism via the Akt/PKB signaling path-way (21). Additionally, one report has identified three mutations in the PTEN gene in T2D patients, suggesting that the PTEN gene is associated with insulin resistance and T2D (26).
PPP1R1A was correlated positively with insulin secretion and negatively with HbA1c. The gene has lower expression in diabetic islets compared with non-diabetic islets (Fig.2) but was up-regulated by short-term exposure to high glucose (Fig.4), suggest-ing that the decreased expression in hyperglycemic islets hardly is a consequence of hyperglycemia. RNA sequencing has also verified higher expression in β-cells than that in α-cells or exo-crine cells (16). Knock-down of PPP1R1A resulted in markedly re-duced insulin secretion, suggesting that a high expression could enhance insulin metabolism–secretion coupling (Fig.5). PPP1R1A was previously found as a novelβ cell marker with high-molar protein abundance andβ cell-restricted expression in human pancreas (27). Moreover, using mass spectrometry of sorter-purified β-cells, PPP1R1A was suggested as a biomarker for acuteβ-cell destruction (28). PPP1R1A belongs to a family of 200 proteins (encoding inhibitor-1 proteins) that bind to and target the isoforms of protein phosphatase 1 (PP-1) to their substrates in the cell [for review, see Gregorio et al. (29)]. PPP1R1A is itself regulated by protein phosphorylation. Another I-1, R6 (encoded by PPP1R3D) regulates AMP kinase and its knock-down in MIN6 cells attenuated glucose-stimulated insulin secretion by impair-ing dephosphorylation/inactivation of AMP kinase (30). In con-trast, blockade of PP-1 acutely by the nonselective inhibitors okadaic acid or Cal A decreased glucose-induced insulin secre-tion of pancreaticβ-cells owing to inhibition of Ca2+influx and
impaired regulation of vesicular fusion of secretory vesicles (31,32). It remains to be demonstrated how long-term alteration of PP-1 activity influences these mechanisms in the β-cell.
ENO2 was down-regulated in hyperglycemic islets and also by exposure to high glucose in vitro (Figs.2and4). Disruption of ENO2 resulted in impaired insulin secretion, suggesting that appropriate expression of ENO2 is required for normal islet function (Fig.4). ENO2 functions as a neuron-specific enolase (NSE) in neurons, glia and also neuro-endocrine cells (33,34). NSE is a phosphopyru-vate hydratase, which is a key enzyme in the conversion of glucose to pyruvate. As glucose enters the cell, it has to be converted to pyruvate for the formation of ATP in the mitochondria to initiate depolarization of the cell by closure of ATP-dependent K+-channels and subsequently increased Ca2+influx by voltage-gated Ca2+
-channels (35). This strongly suggests that NSE could regulate glycolysis within theβ-cell and insulin secretion. Hence, it is con-ceivable to hypothesize that decreased expression of ENO2 in pan-creaticβ-cells may contribute to increased susceptibility to T2D by limiting pyruvate generation, leading to inadequate production of ATP, causing impaired Ca2+influx and attenuated insulin secretion.
Further studies are required to elucidate the potential role of ENO2 inβ-cell failure and the pathogenesis of hyperglycemia.
FAM105A correlated positively with insulin secretion and negatively with HbA1c. The gene was down-regulated in hyper-glycemic islets, but acute increase in glucose concentration had no influence on its expression (Figs.2 and4). However,
Figure 5. Glucose-stimulated insulin secretion in transfected clonalβ-cells. (A) Knock-down efficiency of siRNA of PPP1R1A, ENO2, FAM105A, PLCXD3, GNG5 and GLRA1 in INS-1 cells. (B) siRNA experiments for the above-listed genes show insulin secretion in response to 2.8 m and 16.7 m glucose 72 h after transfection as measured during 1 h of static incubation. Secretion was expressed as fold increase (insulin secreted at 16.7 m/insulin secreted at 2.8 m glucose) and normalized for protein content (ng/mg/h). Data are shown from three experiments. Bars represent mean ± SD. *<0.05, **<0.01.
Table 2. Association between SNPs in the six selected genes and T2D in the DIAGRAM+ database
Gene SNP Chromosome Position Risk allele P-value P-Genome-wide significance
GLRA1 rs170020 5 151 324 751 A 1.10E− 03 2.60E– 04
PPP1R1A rs1153146 12 53 317 187 C 3.00E− 02 5.40E− 04
FAM105A rs153822 5 14 680 833 G 1.50E− 02 4.40E− 04
PLCXD3 rs17263168 5 41 320 500 C 3.20E− 03 1.60E− 04
ENO2 rs7955412 12 6 868 632 C 7.10E− 01 3.60E− 04
GNG5 rs6677436 1 84 687 888 T 5.30E− 01 1.80E− 03
knock-down of FAM105A resulted in a clear decrease in insulin secretion suggesting that it could play a pathogenic role in dia-betes (Fig.5). FAM105A has previously been ascribed a role in Amenorrhea (www.genecards.org). A paralog of this gene is FAM105B, which is required for angiogenesis, craniofacial and neuronal development by regulating the canonical Wnt signaling (genecards.org). The cellular mechanisms how FAM105A influ-ences insulin secretion remain to be clarified.
PLCXD3 correlated positively with insulin secretion and in-versely with HbA1c and its disruption reduced insulin secretion (Fig.5). PLCDX3 was down-regulated in islets from hyperglycemic donors, but short-term exposure to high glucose did not influ-ence its expression (Fig.4).
PLCXDs are a subtype of the phosphatidylinositol-specific phospholipase C (PLCs) protein family. PLCs are receptor-regulated phosphodiesterases that regulate hormones, growth factors and neurotransmitters by generating the calcium-mobilizing mes-senger inositol-1,4,5-trisphosphate (IP3) and the membrane-bound protein kinase C activator diacylglycerol (DAG) (36–39). Several lines of evidence suggest that PLC plays an important role in the regulation of insulin secretion in the pancreatic β cells. In addition to receptor activation, the influx of calcium has been shown to activate PLC, resulting in exocytosis (40,41). Such positive feedback is important in the regulation of insulin secretion by neurotransmitters (42). Thus, the failure of PLC acti-vation resulted in impairment of insulin secretion (43–45).
GLRA1 is an ion channel that binds glycine to increase chlor-ide conductance. The gene was on top of the list showing positive correlation with insulin and negative with HbA1c. The gene is also down-regulated in hyperglycemic islets and in response to high glucose exposure (Figs.2and4). However, siRNA of the GLRA1 gene did not influence insulin secretion (Fig.4). In support of this, a recent report by Li et al. showed that glycine does not stimulate insulin secretion in human islets but rather increases glucagon release instead (46). Additionally, GLRA1 showed a posi-tive correlation with glucagon (GCG) expression in human islets (Fig.2). Glycine has been suggested as a biomarker for future
T2D risk, perhaps participating in the hyperglucagonemia of the disease (47,48).
Somewhat surprisingly, the expression of the positively corre-lated genes (associated with low HbA1c and high insulin secretion) showed a very consistent positive correlation with the glucagon gene, whereas the opposite was seen for the negatively correlated genes. The positive correlation between proglucagon mRNA and low HbA1c (Fig.3) could point to a protective effect of the incretin hormone GLP-1, which potentiates insulin secretion, protects beta cells from apoptosis and increases cell-to-cell coupling in human islets (49). It has been demonstrated that 20% of human islet alpha cells contain and release GLP-1 in response to stimulatory glucose concentrations (50). GLP-1 production in the islet is rendered pos-sible as this subpopulation, in contrast to the bulk of alpha cells, expresses the prohormone convertase PC1/3, necessary for the processing of the proglucagon peptide to GLP-1. In addition, islet GLP-1 production is increased by exercise, an effect that appears to be mediated by IL-6. Moreover, glucagon itself has been shown to participate in GSIS in human islets, and alpha–beta cell contacts improve insulin secretion caused by glucose (51–53). Future work should focus on the further elucidation of the role of intra-islet GLP-1 in the maintenance of beta cell function.
In contrast, GNG5 expression correlated negatively with insulin secretion and positively with HbA1c, and its expression was up-regulated in diabetic islets (Fig.2). This could potentially represent a homeostatic adaptation to the hyperglycemic milieu, as knock-down of GNG5 in INS-1 cells resulted in decreased insulin secre-tion (Fig.5). This is also supported by thefinding of up-regulation of GNG5 in response to high glucose exposure (Fig.4). GNG5 encodes an isoform of the Gγsubunit, which together with a Gβ
subunit forms a Gβγdimer, and couples signals from G
protein-coupled receptors to activate adenylyl cyclases or potassium channels (54–56). Inβ-cells, heterotrimeric G proteins are involved in several regulatory pathways influencing glucose-stimulated in-sulin secretion, such as through mediation of adrenergic inhib-ition and effects on insulin granule exocytosis. Which specific role GNG5 would play inβ-cells is not known (57,58), but disruption
Figure 6. cis-eQTL effects on four of the selected genes. SNP genotyped in human islets were analyzed for influence on gene expression (eQTL) in cis (within 250 kb of the SNP) using array expression data. The strongest eQTLs were seen for rs35039612 (ENO2), rs1512906 (PPP1R1A), rs2347598 (GLRA1) and rs26173 (FAM105A).
of GNG5 caused embryonic lethality in mice linked to reduction of cardiac precursor cell numbers (59).
In conclusion, we introduced a novel approach to discover new candidate genes involved in the pathogenesis of T2D. Five genes PPP1R1A, FAM105A, PLCXD3, ENO2 and GNG5 were identi-fied and experimentally validated as potential players in the pathogenesis of islet dysfunction in T2D. We also provide a list of potential genes involved in protection from and susceptibility to T2D based upon correlation between their expression in human pancreatic islets and insulin secretion and glycemia (HbA1c). This gene list should serve as a resource for future stud-ies exploring their potential role inβ-cell failure and the patho-genesis of hyperglycemia and T2D.
Materials and Methods
Human pancreatic islets
Islets from cadaver donors (78 donors) were provided by the Nordic Islet Transplantation Program (www.nordicislets.org), Uppsala University. All procedures were approved by the ethics commit-tees at Lund University. Islets were obtained from 68 non-diabetic donors (30 females, 37 males, age 59 ± 10, BMI 25.9 ± 3.5, HbA1c 5.5 ± 1.1 and days of culture 3.5 ± 1.9) and 10 T2D donors (4 females, 6 males, age 60.7 ± 12, BMI 28.1 ± 4.5, HbA1c 7.1 ± 1.2 and days of culture 2 ± 0.9). Purity of the islet preparations was assessed by di-thizone staining amounted to 60.1 ± 20% in the T2D and 70 ± 17% in the non-diabetic islets (P = 0.10). Insulin content was measured as a surrogate marker forβ-cell mass in pancreatic islets from hyperglycemic (HbA1c > 6.0%) and normoglycemic (HbA1c < 6.0%) donors, which revealed a modest and insignificant decrease in in-sulin content in islets from hyperglycemic donors (4.8 ± 3.2 versus 5.6 ± 3.2 ng/ml in normoglycemic donors; P = 0.4). We also mea-sured the contribution of exocrine and endocrine tissue as previ-ously described (15). The estimated contribution of endocrine tissue showed no difference between non-diabetic and T2D do-nors (72 versus 68%, respectively, P = 0.29). RNA-seq showed higher insulin expression in non-diabetic donors [351 arbitrary unit (AU)] compared with diabetic donors (255 AU; P < 0.05). The islets were cultured in CMRL 1066 (ICN Biomedicals, Costa Mesa, CA, USA) supplemented with 10 m/l HEPES, 2 m/l l-glutamine, 50 µg/ml gentamicin, 0.25 µg/ml Fungizone (GIBCO, BRL, Gaithersburg, MD, USA), 20 µg/ml ciprofloxacin (Bayer Healthcare, Leverkusen, Germany) and 10 m/l nicotinamide at 37°C (5% CO2) prior to
RNA preparation.
Microarray gene expression in human pancreatic islets
RNA was isolated with the AllPrep DNA/RNA Mini Kit (Qiagen, Hil-den, Germany). RNA quality and concentration were measured using an Agilent 2100 bioanalyzer (Bio-Rad, Hercules, CA, USA) and Nanodrop ND-1000 equipment (NanoDrop Technologies, Wil-mington, DE, USA). The microarrays (GeneChip®Human Gene 1.0
ST) were performed using the Affymetrix standard protocol as pre-viously described (15). The array data were summarized and nor-malized with Robust Multi-array Analysis method using the ligo package from BioConductor. Also, batch correction was done with COMBACT function from SVA package from Bioconductor. All data are MIAME compliant, and the raw data have been depos-ited in a MIAME database (GEO, accession number: GSE 50398 and GSE 50397).
RNA sequencing
Human islets from 51 donors were divided in two pools of 3000 to 5000 islets and were then incubated in CMRL 1066 medium (ICN
Biomedicals) containing 5.5 m or 18.9 m glucose for 24 h. Fol-lowing treatment, the total RNA including miRNA was extracted using miRNeasy mini kit (Qiagen) and quality was assessed with the 2200 Tapestation (Agilent Technologies). One microgram of total RNA of sufficient quality (RIN > 8) was used for sample prep-aration for sequencing with a TruSeq RNA sample prepprep-aration kit (Illumina). The size selection was done using Agencourt AMPure XP beads (Beckman Coulter) aiming at a fragment size of∼300 bp. The resulting libraries were quality controlled on a 2200 Tapesta-tion (Agilent Technologies) before combining six samples into 1 pool for sequencing on 1 lane on a Flow cell sequenced on a HiSeq 2000 (Illumina). Illumina Casava v.1.8.2 software was used for base calling. Paired-end 101-bp-length output reads were aligned to the human reference genome (hg19) with STAR (60), and the number of reads aligned to specific transcripts was counted using HTSeq (61) (Simon Anders, Paul Theodor Pyl, Wolf-gang Huber). Raw data were normalized using trimmed mean of M-values and transformed using voom (limma R-package) before linear modeling. The data extracted is part of an unpublished data set.
Genotyping
Genotyping was performed on the Illumina HumanOmniExpress 12v1 C chips, and genotype calling was done with the Illumina Genome studio software. All the samples passed standard geno-type QC (quality control) metrics: sample call rate >98%.
Glucose-stimulated insulin secretion
Islets were hand-picked under a stereomicroscope and pre-incu-bated for 30 min at 37°C in Krebs Ringer bicarbonate (KRB) buffer ( pH 7.4) containing (in m) 120 NaCl, 25 NaHCo3, 4.7 KCl, 1.2
MgSO4, 2.5 CaCl2, 1.2 KH2PO, 10 HEPES supplemented with
0.1% bovine serum albumin, N-2 hydroxyethylpiperazine-N′-2-ethanesulfonic acid (10 mmol/1) and 1 m glucose. Each incuba-tion vial contained 12 islets in 1.0 ml KRB buffer soluincuba-tion and was treated with 95% O2–5% CO2to obtain constant pH and
oxygen-ation. After pre-incubation, the buffer was changed to a KRB buf-fer containing either 1 m (basal secretion) or 16.7 m glucose (stimulated secretion). The islets were then incubated for 1 h at 37°C in a metabolic shaker (30 cycles per min). Immediately after incubation, an aliquot of the medium was removed for ana-lysis of insulin using a radioimmunoassay kit (Euro-Diagnostica, Malmö, Sweden). Insulin content in homogenized human islets was assessed by ELISA (Mercodia, Uppsala, Sweden), and values were normalized to the total DNA in each sample as determined by afluorometric assay (Quant-iT Picogreen, Invitrogen Molecu-lar Probes, Stockholm, Sweden).
Culturing of INS-1 cell line
INS-1 832/13 is a clonal ß-cell line derived from INS-1 rat insulino-ma cells containing the huinsulino-man pro-insulin gene (18,19). Cells were cultured at 37°C in humid environment with 95% O2/5%
CO2and split 1 : 4 by using 0.05% trypsin-EDTA (Invitrogen). We
used RPMI 1640 culture medium (Gibco) containing 11.1 m D-glucose, 10% fetal bovine serum (Sigma), 5 ml penicillin/strep-tomycin (1000 µ/10 mg/ml; Sigma), 5.6 ml Hepes (1, Sigma), 2 m -glutamine (200 m, Sigma), 1 m sodium pyruvate (Sigma) and 50 µ ß-mercaptoethanol (14.3 M, Sigma).
RNA interference and insulin secretion assay
Clonal INS-1 832/13β-cells were cultured as previously described (15,20) and transfected using a mixture of DharmaFECT® 1
(Dharmacon; Lafayette, CO, USA) and the respective siRNAs. Dif-ferent sets of siRNA sequences were purchased with siRNA iden-tification numbers ID: s130439 and 130437 (GLRA1), s133049 and s133049 (PPP1R1A), s160229 and 160230 (FAM105A), s160317 and s160319 (PLCXD3), s127701 and s127702 (ENO2), and s135096 and s135097 (GNG5) (Ambion). For control purposes, a previously described control sequence Silencer®Negative Control #2 from
Ambion was employed. Cells were cultured in medium for 72 h at 37°C in the presence of 40 n siRNA in 24-well cell culture mi-croplates. After transfection, insulin secretion measurements were performed. Confluent plates containing transfected INS1– 832/13 cells were washed twice with 1 ml pre-warmed Secretion Assay Buffer (SAB), pH 7.2 (114 m NaCl, 4.7 m KCl, 1.2 m KH
2-PO4, 1.16 m MgSO4, 20 m HEPES, 2.5 m CaCl2, 25.5 m
NaHCO3and 0.2% bovine serum albumin) containing 2.8 m
glu-cose. The cells were then pre-incubated for 2 hours in new 2 ml SAB with 2.8 m glucose. Subsequently, separate wells were in-cubated for 1 h in 1 ml SAB containing either 2.8 m or 16.7 m glucose. Secreted insulin was measured in the supernatant using Coat-a-Count Insulin radioimmunoassay kit (Siemens), and the values were normalized using total protein content indi-vidually for each well.
Quantitative RT-qPCR
Total RNA from transfected INS-1 cells was performed 48 h post-transfection using RNeasy Plus Mini Kit 50 (Qiagen). Assessment of quality and quantity of extracted RNA was performed using Nano-Drop ND-1000 Spectrophotometer (Thermo Fisher Scientific, Inc., Waltham, MA, USA). Synthesis of cDNA from extracted RNA was per-formed by using Fermentas RevertAid H Minus First Strand cDNA Synthesis Kit (Thermo Fisher Scientific, Inc.). Knock-down efficiency was assessed by RT-qPCR of the target genes as described earlier using the following Taqman®gene expression assays (Life Technolo-gies): GLRA1 (Rn00565582_m1), PPP1R1A (Rn00575374_m1), FAM105A (Rn01524442_m1), PLCXD3 (Rn01762608_m1), ENO2 (Rn00595017_m1) and GNG5 (Rn00821205_g1) in triplicate on 384-well plates. qPCR was performed in ABI 7900 platform (Applied Biosystems, Foster City, CA, USA). The rat HPRT1 (Rn01527840_m1) was used to normalize gene expression by ΔΔCt method, where the final normalized quantity was expressed as 2(Ct target−Ct control).
cis-eQTL analysis
The cis-eQTL analysis of the genes GLRA1, PPP1R1A, PLCXD3, FAM105A, ENO2 and GNG5 was performed on islets microarray from 89 individuals. A linear model adjusting for age and sex as implemented in the R Matrix eQTL package (21) was used to com-pute associations between these gene expression levels and SNPs within 250 kb up- or down-stream of each of these genes.
DIAGRAM database
DIAGRAM (DIAbetes Genetics Replication And Meta-analysis) is a meta-analysis of eight GWASs for T2D (WTCCC, DGI, FUSION, De-code, DGDG, KORAgen, Rotterdam and EUROSPAN) comprising 8130 T2D cases and 38 987 controls of European descent. Details of the samples and the GWAS platforms used in each scan have been described elsewhere (8). Briefly, analyses of fixed-effects, additive-model for 2 426 886 imputed and genotyped SNPs were combined using the inverse-variance method. Imputation was performed using IMPUTE (http://mathgen.stats.ox.ac.uk/impute/ impute.html/). The replication sample included in silico data from independent three GWASs (ARIC, Nurses’ Health Study,
Framingham Heart Study: 2832 cases, 15 843 controls) and de novo genotyping (31 580 cases and 44 082 controls) totaling 34 412 cases and 59 925 control subjects of European descent.
Statistical analysis
Differences in expression levels were analyzed by Student’s t-test or nonparametric Mann–Whitney test (two tails). Expression cor-relation with Glucagon (GCG) was analyzed by nonparametric Spearman’s test. The Global correlation of gene expression with HbA1c and insulin secretion was done using Spearman’s tests in R. All Statistical tests were performed using the Statistical Pack-age for the Social Sciences (SPSS) version 19.0 software (SPSS, Chicago, IL, USA). P-values of <0.05 were considered as significant for all tests.
Supplementary Material
Supplementary Material is available at HMG online.
Acknowledgements
We thank SCIBLU Genomics at Lund University for their help with microarrays preparation.
Conflict of Interest statement. None declared.
Funding
This work was supported by grants from the Swedish Research Council incl. project grant (L.G.: Dnr. 251-2007-4037, collaborative project grant Dnr. 521-2008-2974, strategic research area grant (EXODIAB: Dnr. 2009-1039) and Linnaeus grant (LUDC): Dnr. 349-2008-6589 as well as equipment grants from Wallenberg KAW 2009-0243) and Lundberg Foundation (grant no. 359). L.G. and C.W. are also funded by grants from the Hjelte Foundation. Human pancreatic islets were provided by the Nordic Network for Clinical Islet Transplantation by the courtesy of O. Korsgren, Uppsala, Sweden, supported by EXODIAB and grants from JDRF.
References
1. Zimmet, P., Alberti, K.G. and Serrano Rios, M. (2005) A new international diabetes federation worldwide definition of the metabolic syndrome: the rationale and the results. Rev. Esp. Cardiol., 58, 1371–1376.
2. Dupuis, J., Langenberg, C., Prokopenko, I., Saxena, R., Soranzo, N., Jackson, A.U., Wheeler, E., Glazer, N.L., Bouatia-Naji, N., Gloyn, A.L. et al. (2010) New genetic loci implicated in fasting glucose homeostasis and their impact on type 2 diabetes risk. Nat. Genet., 42, 105–116.
3. Saxena, R., Voight, B.F., Lyssenko, V., Burtt, N.P., de Bakker, P.I., Chen, H., Roix, J.J., Kathiresan, S., Hirschhorn, J.N., Daly, M.J. et al. (2007) Genome-wide association analysis identifies loci for type 2 diabetes and triglyceride levels. Science, 316, 1331– 1336.
4. Saxena, R., Hivert, M.F., Langenberg, C., Tanaka, T., Pankow, J.S., Vollenweider, P., Lyssenko, V., Bouatia-Naji, N., Dupuis, J., Jackson, A.U. et al. (2010) Genetic variation in GIPR influences the glucose and insulin responses to an oral glucose chal-lenge. Nat. Genet., 42, 142–148.
5. Scott, L.J., Mohlke, K.L., Bonnycastle, L.L., Willer, C.J., Li, Y., Duren, W.L., Erdos, M.R., Stringham, H.M., Chines, P.S., Jack-son, A.U. et al. (2007) A genome-wide association study of
type 2 diabetes in Finns detects multiple susceptibility var-iants. Science, 316, 1341–1345.
6. Sladek, R., Rocheleau, G., Rung, J., Dina, C., Shen, L., Serre, D., Boutin, P., Vincent, D., Belisle, A., Hadjadj, S. et al. (2007) A genome-wide association study identifies novel risk loci for type 2 diabetes. Nature, 445, 881–885.
7. Steinthorsdottir, V., Thorleifsson, G., Reynisdottir, I., Bene-diktsson, R., Jonsdottir, T., Walters, G.B., Styrkarsdottir, U., Gretarsdottir, S., Emilsson, V., Ghosh, S. et al. (2007) A variant in CDKAL1 influences insulin response and risk of type 2 dia-betes. Nat. Genet., 39, 770–775.
8. Voight, B.F., Scott, L.J., Steinthorsdottir, V., Morris, A.P., Dina, C., Welch, R.P., Zeggini, E., Huth, C., Aulchenko, Y.S., Thor-leifsson, G. et al. (2010) Twelve type 2 diabetes susceptibility loci identified through large-scale association analysis. Nat. Genet., 42, 579–589.
9. Zeggini, E., Scott, L.J., Saxena, R., Voight, B.F., Marchini, J.L., Hu, T., de Bakker, P.I., Abecasis, G.R., Almgren, P., Andersen, G. et al. (2008) Meta-analysis of genome-wide association data and large-scale replication identifies additional suscep-tibility loci for type 2 diabetes. Nat. Genet., 40, 638–645. 10. Kooner, J.S., Saleheen, D., Sim, X., Sehmi, J., Zhang, W.,
Fros-sard, P., Been, L.F., Chia, K.S., Dimas, A.S., Hassanali, N. et al. (2011) Genome-wide association study in individuals of South Asian ancestry identifies six new type 2 diabetes sus-ceptibility loci. Nat. Genet., 43, 984–989.
11. Strawbridge, R.J., Dupuis, J., Prokopenko, I., Barker, A., Ahlq-vist, E., Rybin, D., Petrie, J.R., Travers, M.E., Bouatia-Naji, N., Dimas, A.S. et al. (2011) Genome-wide association identifies nine common variants associated with fasting proinsulin levels and provides new insights into the pathophysiology of type 2 diabetes. Diabetes, 60, 2624–2634.
12. Cho, Y.S., Chen, C.H., Hu, C., Long, J., Ong, R.T., Sim, X., Takeu-chi, F., Wu, Y., Go, M.J., YamauTakeu-chi, T. et al. (2012) Meta-analysis of genome-wide association studies identifies eight new loci for type 2 diabetes in east Asians. Nat. Genet., 44, 67–72. 13. Manolio, T.A., Collins, F.S., Cox, N.J., Goldstein, D.B., Hindorff,
L.A., Hunter, D.J., McCarthy, M.I., Ramos, E.M., Cardon, L.R., Chakravarti, A. et al. (2009) Finding the missing heritability of complex diseases. Nature, 461, 747–753.
14. Lyssenko, V., Jonsson, A., Almgren, P., Pulizzi, N., Isomaa, B., Tuomi, T., Berglund, G., Altshuler, D., Nilsson, P. and Groop, L. (2008) Clinical risk factors, DNA variants, and the develop-ment of type 2 diabetes. N. Engl. J. Med., 359, 2220–2232. 15. Taneera, J., Lang, S., Sharma, A., Fadista, J., Zhou, Y., Ahlqvist,
E., Jonsson, A., Lyssenko, V., Vikman, P., Hansson, O. et al. (2012) A systems genetics approach identifies genes and pathways for type 2 diabetes in human islets. Cell Metab., 16, 122–134.
16. Bramswig, N.C., Everett, L.J., Schug, J., Dorrell, C., Liu, C., Luo, Y., Streeter, P.R., Naji, A., Grompe, M. and Kaestner, K.H. (2013) Epigenomic plasticity enables human pancreatic alpha to beta cell reprogramming. J. Clin. Invest., 123, 1275–1284. 17. Varadi, A., Lebel, L., Hashim, Y., Mehta, Z., Ashcroft, S.J. and
Turner, R. (1999) Sequence variants of the sarco(endo)plas-mic reticulum Ca(2+)-transport ATPase 3 gene (SERCA3) in Caucasian type II diabetic patients (UK Prospective Diabetes Study 48). Diabetologia, 42, 1240–1243.
18. Varadi, A., Molnar, E., Ostenson, C.G. and Ashcroft, S.J. (1996) Isoforms of endoplasmic reticulum Ca(2+)-ATPase are differ-entially expressed in normal and diabetic islets of Langer-hans. Biochem. J., 319 (Pt 2), 521–527.
19. Roe, M.W., Philipson, L.H., Frangakis, C.J., Kuznetsov, A., Mertz, R.J., Lancaster, M.E., Spencer, B., Worley, J.F. 3rd and
Dukes, I.D. (1994) Defective glucose-dependent endoplasmic reticulum Ca2+ sequestration in diabetic mouse islets of Langerhans. J. Biol. Chem., 269, 18279–18282.
20. Tang, X., Powelka, A.M., Soriano, N.A., Czech, M.P. and Guilherme, A. (2005) PTEN, but not SHIP2, suppresses insulin signaling through the phosphatidylinositol 3-kinase/Akt pathway in 3T3-L1 adipocytes. J. Biol. Chem., 280, 22523–22529.
21. Vinciguerra, M. and Foti, M. (2006) PTEN and SHIP2 phosphoi-nositide phosphatases as negative regulators of insulin sig-nalling. Arch. Physiol. Biochem., 112, 89–104.
22. Andersson, S.A., Olsson, A.H., Esguerra, J.L., Heimann, E., Ladenvall, C., Edlund, A., Salehi, A., Taneera, J., Degerman, E., Groop, L. et al. (2010) Reduced insulin secretion correlates with decreased expression of exocytotic genes in pancreatic islets from patients with type 2 diabetes. Mol. Cell Endocrinol., 364, 36–45.
23. Weir, G.C. and Bonner-Weir, S. (2004) Five stages of evolving beta-cell dysfunction during progression to diabetes. Dia-betes, 53(Suppl 3), S16–S21.
24. Worley, J.F. 3rd, McIntyre, M.S., Spencer, B., Mertz, R.J., Roe, M.W. and Dukes, I.D. (1994) Endoplasmic reticulum calcium store regulates membrane potential in mouse islet beta-cells. J. Biol. Chem., 269, 14359–14362.
25. Pang, Z.P. and Sudhof, T.C. (2010) Cell biology of Ca2+
-triggered exocytosis. Curr. Opin. Cell Biol., 22, 496–505. 26. Ishihara, H., Sasaoka, T., Kagawa, S., Murakami, S., Fukui, K.,
Kawagishi, Y., Yamazaki, K., Sato, A., Iwata, M., Urakaze, M. et al. (2003) Association of the polymorphisms in the 5′-un-translated region of PTEN gene with type 2 diabetes in a Japa-nese population. FEBS Lett., 554, 450–454.
27. Martens, G.A., Jiang, L., Hellemans, K.H., Stange, G., Heim-berg, H., Nielsen, F.C., Sand, O., Van Helden, J., Van Lommel, L., Schuit, F. et al. (2011) Clusters of conserved beta cell marker genes for assessment of beta cell phenotype. PloS One, 6, e24134.
28. Jiang, L., Brackeva, B., Ling, Z., Kramer, G., Aerts, J.M., Schuit, F., Keymeulen, B., Pipeleers, D., Gorus, F. and Martens, G.A. (2013) Potential of protein phosphatase inhibitor 1 as bio-marker of pancreatic beta-cell injury in vitro and in vivo. Dia-betes, 62, 2683–2688.
29. Gregorio, L.K., Esteves, S.L. and Fardilha, M. (2014) Protein phosphatase 1 catalytic isoforms: specificity toward interact-ing proteins. Transl. Res., 164, 366–391.
30. Garcia-Haro, L., Garcia-Gimeno, M.A., Neumann, D., Beullens, M., Bollen, M. and Sanz, P. (2010) The PP1-R6 protein phos-phatase holoenzyme is involved in the glucose-induced de-phosphorylation and inactivation of AMP-activated protein kinase, a key regulator of insulin secretion, in MIN6 beta cells. FASEB J., 24, 5080–5091.
31. Sato, Y., Mariot, P., Detimary, P., Gilon, P. and Henquin, J.C. (1998) Okadaic acid-induced decrease in the magnitude and efficacy of the Ca2+signal in pancreatic beta cells and
inhib-ition of insulin secretion. Br. J. Pharmacol., 123, 97–105. 32. Haby, C., Larsson, O., Islam, M.S., Aunis, D., Berggren, P.O. and
Zwiller, J. (1994) Inhibition of serine/threonine protein phos-phatases promotes opening of voltage-activated L-type Ca2+
channels in insulin-secreting cells. Biochem. J., 298(Pt 2), 341–346.
33. Schmechel, D., Marangos, P.J., Zis, A.P., Brightman, M. and Goodwin, F.K. (1978) Brain endolases as specific markers of neuronal and glial cells. Science, 199, 313–315.
34. Marangos, P.J., Schmechel, D., Parma, A.M., Clark, R.L. and Goodwin, F.K. (1979) Measurement of neuron-specific (NSE)
and non-neuronal (NNE) isoenzymes of enolase in rat, monkey and human nervous tissue. J. Neurochem., 33, 319–329.
35. MacDonald, P.E., Joseph, J.W. and Rorsman, P. (2005) Glucose-sensing mechanisms in pancreatic beta-cells. Philos. Trans. R. Soc. Lond. B. Biol. Sci., 360, 2211–2225.
36. Suh, P.G., Park, J.I., Manzoli, L., Cocco, L., Peak, J.C., Katan, M., Fukami, K., Kataoka, T., Yun, S. and Ryu, S.H. (2008) Multiple roles of phosphoinositide-specific phospholipase C isozymes. BMB Rep., 41, 415–434.
37. Torres, M., Encina, G., Soto, C. and Hetz, C. (2011) Abnormal calcium homeostasis and protein folding stress at the ER: a common factor in familial and infectious prion disorders. Commun. Integr. Biol., 4, 258–261.
38. Nishizuka, Y. (1988) The molecular heterogeneity of protein kinase C and its implications for cellular regulation. Nature, 334, 661–665.
39. Di Paolo, G. and De Camilli, P. (2006) Phosphoinositides in cell regulation and membrane dynamics. Nature, 443, 651–657.
40. Ganesan, S., Calle, R., Zawalich, K., Greenawalt, K., Zawalich, W., Shulman, G.I. and Rasmussen, H. (1992) Immunocyto-chemical localization of alpha-protein kinase C in rat pancre-atic beta-cells during glucose-induced insulin secretion. J. Cell Biol., 119, 313–324.
41. Ganesan, S., Calle, R., Zawalich, K., Smallwood, J.I., Zawalich, W.S. and Rasmussen, H. (1990) Glucose-induced transloca-tion of protein kinase C in rat pancreatic islets. Proc. Natl Acad. Sci. USA, 87, 9893–9897.
42. Thore, S., Dyachok, O., Gylfe, E. and Tengholm, A. (2005) Feed-back activation of phospholipase C via intracellular mobiliza-tion and store-operated influx of Ca2+in insulin-secreting
beta-cells. J. Cell Sci., 118, 4463–4471.
43. Fiume, R., Ramazzotti, G., Faenza, I., Piazzi, M., Bavelloni, A., Billi, A.M. and Cocco, L. (2012) Nuclear PLCs affect insulin se-cretion by targeting PPARgamma in pancreatic beta cells. FASEB J., 26, 203–210.
44. Zawalich, W.S., Tesz, G.J., Yamazaki, H., Zawalich, K.C. and Philbrick, W. (2006) Dexamethasone suppresses phospholip-ase C activation and insulin secretion from isolated rat islets. Metabolism, 55, 35–42.
45. Yamazaki, H., Philbrick, W., Zawalich, K.C. and Zawalich, W.S. (2006) Acute and chronic effects of glucose and carbachol on insulin secretion and phospholipase C activation: studies with diazoxide and atropine. Am. J. Physiol. Endocrinol. Metab., 290, E26–E33.
46. Li, C., Liu, C., Nissim, I., Chen, J., Chen, P., Doliba, N., Zhang, T., Nissim, I., Daikhin, Y., Stokes, D. et al. (2013) Regulation of glucagon secretion in normal and diabetic human islets by gamma-hydroxybutyrate and glycine. J. Biol. Chem., 288, 3938–3951.
47. Floegel, A., Stefan, N., Yu, Z., Muhlenbruch, K., Drogan, D., Joost, H.G., Fritsche, A., Haring, H.U., Hrabe de Angelis, M., Peters, A. et al. (2013) Identification of serum metabolites
associated with risk of type 2 diabetes using a targeted meta-bolomic approach. Diabetes, 60, 2624–2634.
48. Wang-Sattler, R., Yu, Z., Herder, C., Messias, A.C., Floegel, A., He, Y., Heim, K., Campillos, M., Holzapfel, C., Thorand, B. et al. (2012) Novel biomarkers for pre-diabetes identified by meta-bolomics. Mol. Syst. Biol., 8, 615.
49. Hodson, D.J., Mitchell, R.K., Bellomo, E.A., Sun, G., Vinet, L., Meda, P., Li, D., Li, W.H., Bugliani, M., Marchetti, P. et al. (2013) Lipotoxicity disrupts incretin-regulated human beta cell connectivity. J. Clin. Invest., 123, 4182–4194.
50. Marchetti, P., Lupi, R., Bugliani, M., Kirkpatrick, C.L., Sebastia-ni, G., Grieco, F.A., Del Guerra, S., D’Aleo, V., Piro, S., Marselli, L. et al. (2012) A local glucagon-like peptide 1 (GLP-1) system in human pancreatic islets. Diabetologia, 55, 3262–3272. 51. Huypens, P., Ling, Z., Pipeleers, D. and Schuit, F. (2000)
Gluca-gon receptors on human islet cells contribute to glucose com-petence of insulin release. Diabetologia, 43, 1012–1019. 52. Pipeleers, D.G., Schuit, F.C., in’t Veld, P.A., Maes, E.,
Hooghe-Peters, E.L., Van de Winkel, M. and Gepts, W. (1985) Interplay of nutrients and hormones in the regulation of insulin re-lease. Endocrinology, 117, 824–833.
53. Wojtusciszyn, A., Armanet, M., Morel, P., Berney, T. and Bosco, D. (2008) Insulin secretion from human beta cells is heterogeneous and dependent on cell-to-cell contacts. Diabe-tologia, 51, 1843–1852.
54. Clapham, D.E. and Neer, E.J. (1997) G protein beta gamma sub-units. Annu. Rev. Pharmacol. Toxicol., 37, 167–203.
55. Logothetis, D.E., Kurachi, Y., Galper, J., Neer, E.J. and Clapham, D.E. (1987) The beta gamma subunits of GTP-binding proteins activate the muscarinic K+ channel in heart. Nature, 325, 321–326.
56. Tang, W.J. and Gilman, A.G. (1991) Type-specific regulation of adenylyl cyclase by G protein beta gamma subunits. Science, 254, 1500–1503.
57. Seaquist, E.R., Neal, A.R., Shoger, K.D., Walseth, T.F. and Robertson, R.P. (1992) G-proteins and hormonal inhibition of insulin secretion from HIT-T15 cells and isolated rat islets. Diabetes, 41, 1390–1399.
58. Konrad, R.J., Young, R.A., Record, R.D., Smith, R.M., Butkerait, P., Manning, D., Jarett, L. and Wolf, B.A. (1995) The heterotri-meric G-protein Gi is localized to the insulin secretory gran-ules of beta-cells and is involved in insulin exocytosis. J. Biol. Chem., 270, 12869–12876.
59. Moon, A.M., Stauffer, A.M., Schwindinger, W.F., Sheridan, K., Firment, A. and Robishaw, J.D. (2014) Disruption of G-protein γ5 subtype causes embryonic lethality in mice. PloS One, 9, e90970.
60. Dobin, A., Davis, C.A., Schlesinger, F., Drenkow, J., Zaleski, C., Jha, S., Batut, P., Chaisson, M. and Gingeras, T.R. (2013) STAR: ultrafast universal RNA-seq aligner. Bioinformatics, 29, 15–21. 61. Anders, S., Pyl, P.T. and Huber, W. (2014) HTSeq - a python framework to work with high-throughput sequencing data. Bioinformatics,http://biorxiv.org/content/biorxiv/early/2014/ 08/19/002824.full.pdf10.1101/002824.