Original article
Trends in cancer mortality in the Americas, 1970 – 2000
C. Bosetti
1*, M. Malvezzi
1, L. Chatenoud
1, E. Negri
1, F. Levi
2& C. La Vecchia
1,3 1Istituto di Ricerche Farmacologiche ‘Mario Negri’, Via Eritrea 62, 20157 Milan;2Unite´ d’Epide´miologie du Cancer and Registres Vaudois et Neuchaˆtelois des Tumeurs, Institut universitaire de me´decine sociale et pre´ventive, Centre Hospitalier Universitaire Vaudois, Falaises 1, 1011 Lausanne, Switzerland;3Istituto di Statistica Medica e Biometria, Universita` degli Studi di Milano, Via Venezian 1, 20133 Milan, Italy
Received 7 September 2004; revised 20 October 2004; accepted 25 October 2004
Background: Data and statistics on cancer mortality over the last decades are available for most developed countries, while they are more difficult to obtain, in a standardized and comparable format, for countries of Latin America.
Patients and methods: Age standardized (world population) mortality rates around the year 2000, derived from the WHO database, are presented for 14 selected cancers and total cancer in 10 countries of Latin America, plus, for comparative purposes, Canada and the USA. Trends in mortality are also given over the period 1970 – 2000.
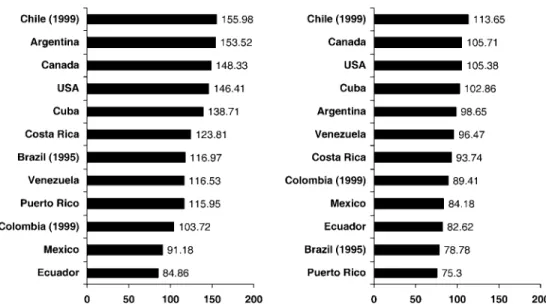
Results:In 2000, the highest total cancer mortality for males was observed in Argentina and Chile, with rates comparable to those of Canada and the USA, i.e. about 155/100 000. For women, Chile and Cuba had the highest rates in Latin America (114 and 103/100 000, respectively), again compar-able to those of North America (around 105/100 000). These reflect the comparatively high mortality from cancer of the stomach (for Chile), lung and intestines (for Argentina) in men, and of stomach and uterus (for Chile), intestines and lung (for Cuba) in women. Colombia, Ecuador and Mexico had the lowest total cancer mortality for men, due to low mortality from stomach, colorectal and lung cancer. For women, the lowest rates were in Brazil and Puerto Rico, reflecting their low stomach and cervical cancer rates. In Argentina, Chile, Colombia, Costa Rica and Venezuela cancer mortality rates tended to decline, particularly in men. Rates were stable in Ecuador and Puerto Rico, and were increasing in Mexico and Cuba.
Conclusions: Mortality from some common cancers (including colorectal and lung) is still low in Latin America compared with Canada and the USA, and decreasing trends have been observed in the last decades for some cancer sites (including stomach, uterus, lung and other tobacco-related cancers) in several countries. However, mortality from female lung and breast cancers has been increasing in most countries of Latin America, and several countries still show an extremely elev-ated mortality from cancer of the cervix. Selected neoplasms amenable to treatment, including testis and leukemias, also show unsatisfactory trends in Latin America.
Key words:cancer, Latin America, mortality, trends
Introduction
Data and statistics on cancer mortality over the last few dec-ades are easily available for most developed countries, includ-ing Europe [1], North America and Japan [2 – 5], while they are more difficult to obtain, in a standardized and comparable format, for countries of Latin America [3, 6].
In the early 1990s, a summary overview was published of cancer mortality in the Americas between 1955 and 1989 [6]. In the present report, trends in cancer mortality in selected
countries of the Americas (including, mainly for comparative purposes, the USA and Canada) have been updated to the year 2000. Since long-term trends provide useful information to understand recent patterns and to project most likely future trends [7], this paper also gives a summary overview of trends since 1970. The major aim of the present work is to provide a comprehensive documentation of the patterns of cancer mor-tality trends in the Americas, and has therefore relevant impli-cations for further investigation and public health intervention.
Patients and methods
Certified deaths from 14 selected cancer sites and for total cancer mortality for the calendar period considered (1970 – 2000), stratified for sex and 5-year age groups, were derived from the WHO database [8] for *Correspondence to: Dr C. Bosetti, Laboratorio di Epidemiologia, Istituto
di Ricerche Farmacologiche ‘Mario Negri’, Via Eritrea 62, 20157 Milan, Italy. Tel: +39-02-39014526; Fax: +39-02-33200231;
E-mail: bosetti@marionegri.it
Published online 24 January 2005
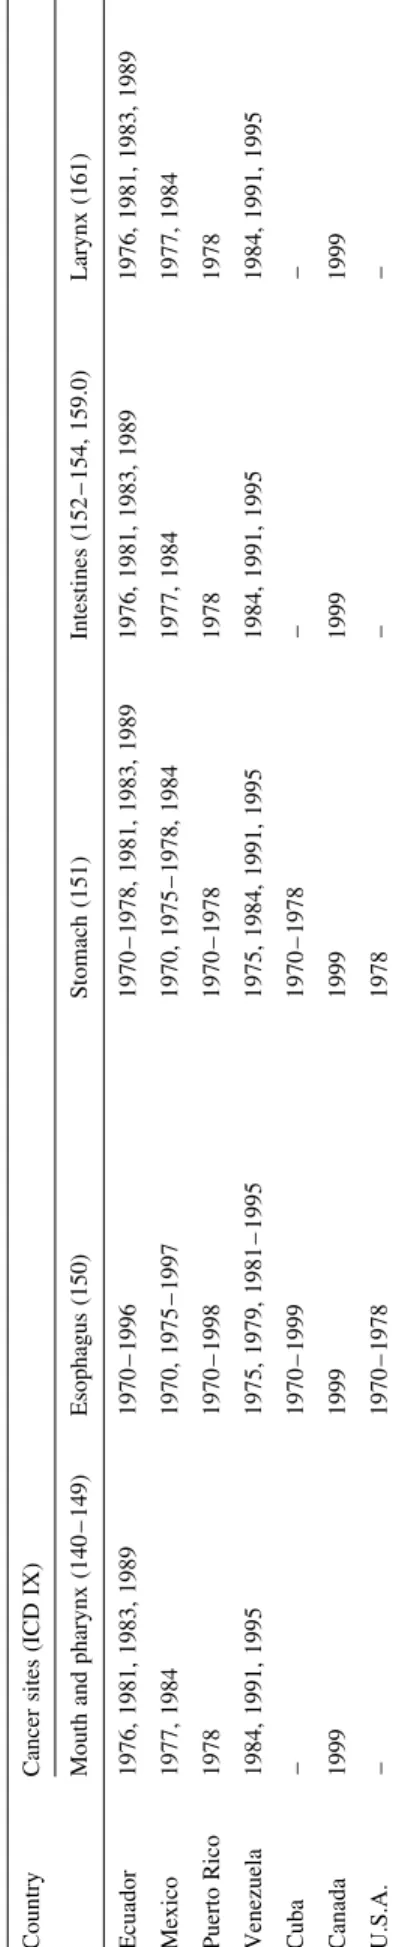
Country Cancer sites (ICD IX)
Mouth and pharynx (140 – 149) Esophagus (150) Stomach (151) Intestines (152 – 154, 159.0) Larynx (161)
Argentina 1971 – 1976, 1998, 1999 1971 – 1976, 1998, 1999 1971 – 1976, 1998, 1999 1971 – 1976, 1998, 1999 1971 – 1976, 1998, 1999 Brazila 1970 – 1985, 1996 – 1999 1970 – 1985, 1996 – 1999 1970 – 1985, 1996 – 1999 1970 – 1985, 1996 – 1999 1970 – 1985, 1996 – 1999 Chile – – – – – Colombia 1970, 1971, 1973, 1978 – 1983, 1987 – 1990, 1999 1970, 1971, 1973, 1978 – 1983, 1987 – 1990, 1999 1970, 1971, 1973, 1978 – 1983, 1987 – 1990, 1999 1970, 1971, 1973, 1978 – 1983, 1987 – 1990, 1999 1970, 1971, 1973, 1978 – 1983, 1987 – 1990, 1999 Costa Rica – – – – – Cuba – – – – – Ecuador 1976, 1981, 1983, 1989 1976, 1981, 1983, 1989 1976, 1981, 1983, 1989 1976, 1981, 1983, 1989 1976, 1981, 1983, 1989 Mexico 1977, 1984 1977, 1984 1977, 1984 1977, 1984 1977, 1984 Puerto Rico 1978 1978 1978 1978 1978 Venezuela 1984, 1991, 1995 1984, 1991, 1995 1984, 1991, 1995 1984, 1991, 1995 1984, 1991, 1995 Canada 1999 1999 1999 1999 1999 USA – – – – –
Lung (162) Bone (170) Breast (174) Uterus (179 – 182) Ovary (183)
Argentina 1971 – 1976, 1998, 1999 1971 – 1976, 1998, 1999 1971 – 1976, 1998, 1999 1971 – 1976, 1998, 1999 1970 – 1979, 1982 – 1996, 1998, 1999 Brazila 1970 – 1985, 1996 – 1999 1970 – 1985, 1996 – 1999 1970 – 1985, 1996 – 1999 1970 – 1985, 1996 – 1999 1970 – 1999 Chile – – – – 1970 – 1982, 1984 – 1996 Colombia 1970, 1971, 1973, 1978 – 1983, 1987 – 1990, 1999 1970, 1971, 1973, 1978 – 1983, 1987 – 1990, 1999 1970, 1971, 1973, 1978 – 1983, 1987 – 1990, 1999 1970, 1971, 1973, 1978 – 1983, 1987 – 1990, 1999 1970 – 1996, 1999 Costa Rica – – – – 1970 – 1996 Cuba – – – – 1970 – 1999 Ecuador 1976, 1981, 1983, 1989 1976, 1981, 1983, 1989 1976, 1981, 1983, 1989 1976, 1981, 1983, 1989 1970 – 1996 Mexico 1977, 1984 1977, 1984 1977, 1984 1977, 1984 1970, 1975 – 1997 Puerto Rico 1978 1978 1978 1978 1970 – 1998 Venezuela 1984, 1991, 1995 1984, 1991, 1995 1984, 1991, 1995 1984, 1991, 1995 1975, 1979, 1981 – 1995 Canada 1999 1999 1999 1999 1999 USA – – – – 1978
Prostate (185) Testis (186) Bladder (188) Leukemias (204 – 208) All neoplasms (140 – 239)
Argentina 1971 – 1976, 1998, 1999 1970 – 1979, 1982 – 1996, 1998, 1999 1970 – 1978, 1998, 1999 1971 – 1976, 1998, 1999 1971 – 1976, 1998, 1999 Brazila 1970 – 1985, 1996 – 1999 1970 – 1999 1970 – 1985, 1996 – 1999 1970 – 1985, 1996 – 1999 1970 – 1985, 1996 – 1999 Chile – 1970 – 1982, 1984 – 1996 1970 – 1979 – – Colombia 1970, 1971, 1973, 1978 – 1983, 1987 – 1990, 1999 1970 – 1996, 1999 1970 – 1983, 1987 – 1990, 1999 1970, 1971, 1973, 1978 – 1983, 1987 – 1990, 1999 1970, 1971, 1973, 1978 – 1983, 1987 – 1990, 1999 Costa Rica – 1970 – 1996 1970 – 1979 – –
10 countries of Latin America with available and updated mortality and population data, i.e. Argentina, Brazil, Chile, Colombia, Costa Rica, Cuba, Ecuador, Mexico, Puerto Rico and Venezuela, plus Canada and the USA. For Brazil, data from only the south, south-east and central-west regions were available (about 100 million inhabitants).
During the calendar periods considered, three different Revisions of the International Classification of Diseases (ICD) were used [9 – 11]. Classifi-cation of cancer deaths was thus recoded for all calendar periods accord-ing to the IX Revision of the ICD [10]. To improve data comparability between different countries and calendar periods, we pooled together all intestinal cancers (chiefly colon and rectum), all uterine cancers (cervix and corpus) and all leukemias. We did not consider some rare cancers (i.e. gallbladder, sarcomas, lymphomas and thyroid), and a few other sites (i.e. liver, pancreas, skin, kidney and brain) which involve major difficulties or inconsistencies in diagnosis and certification.
Estimates of the resident populations, based on official censuses, were obtained from the same WHO database [8] whenever available, and from the Pan American Health Organization (PAHO) [12], when the WHO data were unavailable. Since the PAHO database provided only data for broad age groups, subsequent quinquennia of age were estimated by interpolat-ing from the WHO distribution of the last year available for each country.
From the matrices of certified deaths and resident population, age-specific rates for each 5-year age group and calendar period were com-puted, for men and women. Age-standardized rates per 100 000 popu-lation, at all ages and truncated at age 35 – 64 years, were computed by the direct method, on the basis of the world standard population [13].
In a few countries, data were missing for one or more calendar years (Table 1). No extrapolation was made for missing data.
Results and discussion
This is essentially a descriptive report, and no inference is made on the statistical significance of rates and trends. A few general comments are, however, included to assist in critical reading and interpretation of results. First, it is important to consider problems related to random variation, which are greater in smaller populations and for rarer cancers. Secondly, and more complex, there are problems of death certification reliability and validity, which may differ in various countries [14 – 16]. In general, for several common cancer sites, includ-ing lung, stomach, colorectum and breast, death certification is sufficiently reliable to permit meaningful inference on trends in most American countries, particularly within countries and under age 65 years. Greater caution is required for a few countries and cancer sites, whose diagnosis and certification can be appreciably influenced by the availability and utilization of diagnostic techniques and the accuracy of death certifica-tion, including, among others, bone, prostate and leukemias.
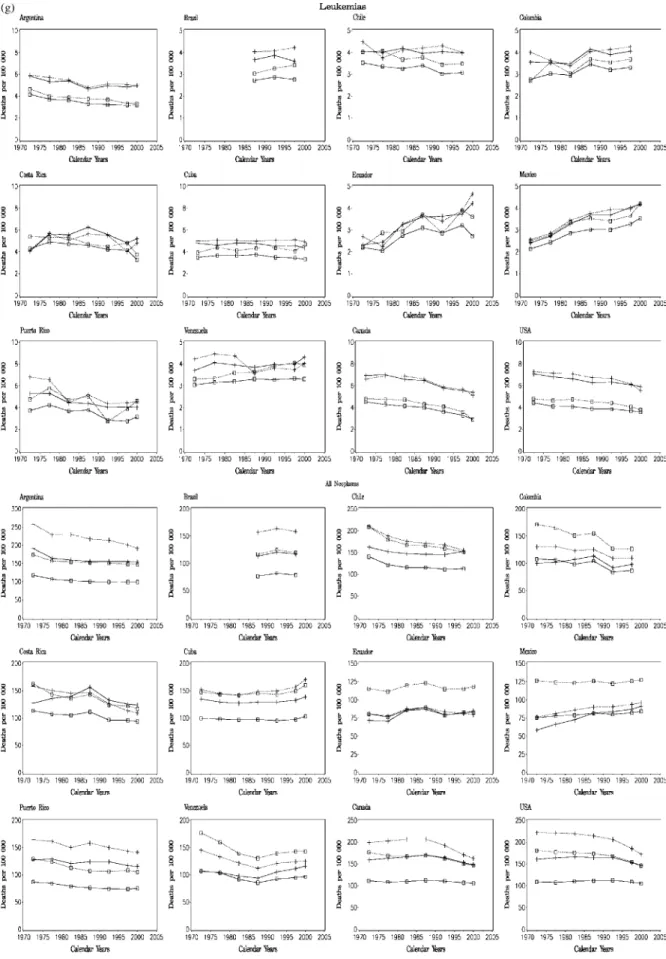
Table 2 includes, for the 14 selected cancers and for each country and sex, the observed number of deaths and the age-standardized (world standard) overall and truncated (35 – 64 years) mortality rates per 100 000 over the most recent year (2000, whenever available). Figure 1 gives the histograms of the overall age-standardized death rates for total cancer mor-tality for each cancer site (by country and sex) for the year 2000 (or the most recent calendar year available). Figure 2 shows the trends in the world standardized rates (at all ages and truncated at 35 – 64 years) for each cancer site in the 12
Table 1. (Co ntinued ) Countr y Cancer sites (ICD IX) Mou th and pharyn x (140 – 149) Esop hagus (1 50) Stomac h (1 51) Intestin es (152 – 154, 159. 0) Larynx (161) Ecuado r 1976, 1981 , 1983, 1989 1970 – 1996 1970 – 1978 , 1981 , 1983 , 1989 1976, 1981 , 1983, 1989 1976, 1981 , 1983, 1989 Mexico 1977, 1984 1970 , 1975 – 1997 1970, 1975 – 1978 , 1984 1977, 1984 1977, 1984 Puerto Rico 1978 1970 – 1998 1970 – 1978 1978 1978 Venezuela 1984, 1991 , 1995 1975 , 1979, 1981 – 1995 1975, 1984 , 1991 , 1995 1984, 1991 , 1995 1984, 1991 , 1995 Cuba – 1970 – 1999 1970 – 1978 – – Canada 1999 1999 1999 1999 1999 U.S.A. – 1970 – 1978 1978 – – aD ata fro m sout h, sout h-east, and cen tral-west reg ions.
Table 2.Certified number of deaths and age-standardized (world standard) overall and truncated 35 – 64 years mortality rates per 100 000 for 14 cancer sites plus all cancers, in selected countries of the Americas in 2000 (unless mentioned in parentheses)
Country Men Women
Deaths no. World standard Truncated 35 – 64 Deaths no. World standard Truncated 35 – 64 Mouth and pharynx
Argentina 617 3.34 6.66 200 0.74 1.02 Brazil (1995) 2576 6.64 13.15 536 1.15 1.77 Chile (1999) 125 2.16 3.30 47 0.55 0.57 Colombia (1999) 250 2.00 2.41 181 1.22 1.41 Costa Rica 37 2.66 3.51 17 1.13 1.25 Cuba 377 5.74 9.87 115 1.48 1.94 Ecuador 54 1.35 1.57 22 0.48 0.48 Mexico 498 1.70 2.19 275 0.77 0.86 Puerto Rico 111 5.22 9.98 25 0.86 1.09 Venezuela 173 2.47 3.78 86 1.07 1.19 Canada 594 2.77 4.46 307 1.04 1.36 USA 4952 2.73 4.81 2540 0.98 1.36 Esophagus Argentina 1398 7.16 9.50 582 2.05 2.14 Brazil (1995) 3024 7.99 14.23 966 2.09 3.10 Chile (1999) 446 7.54 5.30 305 3.53 2.75 Colombia (1999) 411 3.40 3.19 228 1.50 1.41 Costa Rica 29 2.27 2.63 17 1.04 0.23 Cuba 293 4.52 7.31 100 1.40 2.10 Ecuador 74 2.00 1.39 25 0.57 0.74 Mexico 551 1.89 2.23 219 0.61 0.59 Puerto Rico 117 5.09 7.26 38 1.24 0.97 Venezuela 165 2.44 3.13 54 0.67 0.45 Canada 1052 4.79 6.55 340 1.11 1.02 USA 9279 4.98 7.60 2953 1.09 1.32 Stomach Argentina 1965 9.93 12.31 1004 3.75 5.00 Brazil (1995) 5710 15.17 20.65 2805 5.90 7.32 Chile (1999) 2014 33.75 35.31 1024 12.11 11.86 Colombia (1999) 2469 19.93 24.76 1643 10.97 12.02 Costa Rica 356 27.20 28.55 212 13.68 12.32 Cuba 463 6.86 9.62 261 3.52 4.68 Ecuador 781 20.66 21.67 586 13.58 15.02 Mexico 2760 9.32 11.06 2249 6.36 7.89 Puerto Rico 167 6.97 9.07 110 3.42 3.01 Venezuela 1013 14.89 15.47 676 8.46 8.88 Canada 1195 5.16 5.75 793 2.55 3.01 USA 7328 3.65 4.65 5317 1.84 2.27 Table 2.(Continued)
Country Men Women
Deaths no. World standard Truncated 35 – 64 Deaths no. World standard Truncated 35 – 64 Intestine Argentina 2986 14.89 16.20 2609 9.31 10.97 Brazil (1995) 2341 6.11 7.78 2718 5.67 6.86 Chile (1999) 482 7.96 7.87 632 7.36 6.87 Colombia (1999) 700 5.47 7.12 887 5.84 6.86 Costa Rica 90 6.96 6.83 129 8.53 8.66 Cuba 736 10.46 11.87 999 12.84 15.06 Ecuador 131 3.42 4.08 191 4.48 4.95 Mexico 1316 4.38 5.58 1306 3.65 4.96 Puerto Rico 275 11.91 15.89 243 8.05 10.30 Venezuela 520 7.49 8.73 543 6.78 8.62 Canada 3549 15.43 17.82 3094 9.75 11.39 USA 28 462 13.96 16.33 29 015 9.82 11.48 Larynx Argentina 849 4.50 7.67 93 0.37 0.65 Brazil (1995) 1819 4.81 9.06 254 0.56 0.98 Chile (1999) 101 1.73 1.80 24 0.29 0.28 Colombia (1999) 330 2.72 3.10 101 0.70 0.77 Costa Rica 22 1.69 1.08 2 0.13 0.23 Cuba 472 7.26 11.69 89 1.23 1.79 Ecuador 36 0.90 0.88 12 0.27 0.13 Mexico 695 2.44 2.79 153 0.44 0.49 Puerto Rico 70 3.21 5.60 10 0.32 0.32 Venezuela 240 3.54 5.28 41 0.54 0.49 Canada 416 1.87 2.34 90 0.33 0.28 USA 3041 1.62 2.39 820 0.35 0.49 Lung Argentina 6691 35.02 54.70 1718 6.88 11.41 Brazil (1995) 7689 20.73 28.67 2899 6.32 9.40 Chile (1999) 1243 21.28 27.15 600 7.52 8.45 Colombia (1999) 1762 14.60 17.51 1115 7.76 10.15 Costa Rica 165 12.74 9.84 90 6.00 3.89 Cuba 2546 38.29 53.76 1153 16.72 27.10 Ecuador 289 7.71 8.18 161 3.80 4.92 Mexico 4259 14.90 15.21 2014 5.86 6.88 Puerto Rico 399 17.52 21.07 193 6.87 7.57 Venezuela 1310 18.95 25.90 796 10.11 15.80 Canada 9650 43.13 50.30 6484 24.65 36.98 USA 90 469 46.92 57.31 65 052 26.21 35.61 Bone Argentina 235 1.23 1.76 175 0.69 0.81 Brazil (1995) 430 1.00 1.23 294 0.61 0.73
Table 2.(Continued)
Country Men Women
Deaths no. World standard Truncated 35 – 64 Deaths no. World standard Truncated 35 – 64 Chile (1999) 64 0.96 0.89 57 0.69 0.32 Colombia (1999) 142 0.91 1.18 88 0.50 0.45 Costa Rica 15 0.96 1.03 13 0.74 0.57 Cuba 82 1.27 1.97 71 1.14 1.40 Ecuador 51 1.21 1.50 56 1.22 1.22 Mexico 179 0.50 0.61 171 0.43 0.65 Puerto Rico 17 0.66 0.74 19 0.74 0.64 Venezuela 93 1.05 1.04 65 0.73 1.04 Canada 81 0.46 0.38 66 0.35 0.17 USA 682 0.41 0.41 530 0.26 0.22 Breast Argentina 5015 20.65 37.14 Brazil (1995) 5831 12.45 25.04 Chile (1999) 973 12.55 22.32 Colombia (1999) 1434 9.46 19.09 Costa Rica 182 11.85 24.28 Cuba 1012 14.82 28.22 Ecuador 287 6.97 14.10 Mexico 3468 9.90 21.27 Puerto Rico 338 13.75 27.96 Venezuela 1107 13.34 27.17 Canada 4857 18.24 32.60 USA 41 872 17.56 31.95 Uterus Argentina 2422 10.68 21.49 Brazil (1995) 4379 9.27 17.88 Chile (1999) 908 11.58 19.43 Colombia (1999) 2126 13.93 27.20 Costa Rica 174 11.60 18.04 Cuba 958 14.13 28.09 Ecuador 627 14.72 26.50 Mexico 5198 14.82 28.36 Puerto Rico 119 4.88 9.07 Venezuela 1437 16.92 30.77 Canada 1038 3.79 6.14 USA 10 786 4.59 7.92 Ovary Argentina 1133 4.74 8.73 Brazil (1995) – – – Chile (1999) 318 4.21 7.63 Colombia (1999) 456 3.08 5.60 Costa Rica 50 3.50 6.15 Table 2.(Continued)
Country Men Women
Deaths no. World standard Truncated 35 – 64 Deaths no. World standard Truncated 35 – 64 Cuba 218 3.35 6.85 Ecuador 98 2.26 4.04 Mexico 1186 3.44 6.39 Puerto Rico 79 2.93 4.39 Venezuela 305 3.64 5.92 Canada 1429 5.34 8.41 USA 14 453 5.84 9.04 Prostate Argentina 3510 16.28 6.48 Brazil (1995) 4380 11.95 6.11 Chile (1999) 1224 19.85 5.44 Colombia (1999) 1828 14.54 6.64 Costa Rica 282 21.70 4.58 Cuba 1844 23.06 10.49 Ecuador 580 15.32 5.26 Mexico 3852 13.14 5.62 Puerto Rico 524 17.49 6.77 Venezuela 1408 22.26 8.60 Canada 3718 13.86 5.10 USA 31 078 12.73 5.27 Testis Argentina 132 0.71 0.78 Brazil (1995) – – – Chile (1999) 105 1.30 1.55 Colombia (1999) 77 0.40 0.40 Costa Rica 12 0.68 0.70 Cuba 17 0.28 0.33 Ecuador 25 0.48 0.61 Mexico 311 0.66 0.60 Puerto Rico 6 0.28 0.16 Venezuela 37 0.36 0.47 Canada 37 0.20 0.26 USA 338 0.21 0.32 Bladder Argentina 944 4.61 4.03 318 1.04 0.86 Brazil (1995) 979 2.64 2.11 431 0.90 0.92 Chile (1999) 152 2.51 1.84 94 1.09 0.75 Colombia (1999) 204 1.61 1.34 113 0.77 0.71 Costa Rica 35 2.76 1.38 15 0.98 0.75 Cuba 306 4.00 3.05 96 1.15 0.93 Ecuador 36 0.98 0.44 29 0.63 0.28 Mexico 398 1.38 1.08 220 0.62 0.57 Puerto Rico 65 2.53 2.28 37 1.12 0.96
countries of the Americas for 5-year calendar periods from 1970 – 1974 to 1995 – 99 and year 2000, for men and women. Different scales were adopted for each neoplasm and country, in order to provide more easily readable and interpretable patterns.
Mouth and pharynx
In the year 2000, the highest rates for oral and pharyngeal cancer mortality in men were observed in Brazil, Cuba and Puerto Rico with values around 5 – 6/100 000, i.e. 1.5- to 2.0-fold higher than values from Canada and the USA. Colombia, Ecuador and Mexico showed the lowest rates, with values around 1 – 2/100 000. As in Canada, the USA and several countries of Europe [1], a leveling or even a fall in mortality
rates from oral and pharyngeal cancer was observed in various Latin American countries, starting from the 1970s in Puerto Rico and Venezuela, since the early 1980s in Argentina and Chile, and since the late 1980s in Colombia. In Mexico, mor-tality from cancers of the mouth and pharynx in men increased between 1970 and 1989, and leveled off thereafter. In Cuba, after a favorable trend between 1970 and 1985, rates have started to increase again, notwithstanding a nationwide screen-ing program implemented for a number of years [17]. No clear trend was observed in Costa Rica and Ecuador. Mortality rates for cancer of the mouth and pharynx in women were very low (between 0.5 and 1.5/100 000) and showed no appreciable trends in any country, except in Venezuela, where rates continuously declined between the 1970s (characterized by particularly high rates) and the 1980s, and tended to level off thereafter.
Since alcohol drinking and tobacco smoking are the major risk factors for cancer of the mouth and pharynx [18 – 21], recent favorable trends in mortality in most American countries would indicate favorable changes in the exposure to these two risk factors over the last decades [22]. Additional factors, mainly related to improvement in diet [23] and mate´ drinking—particularly in Argentina and Brazil [24]—may also have had some role on recent trends.
Esophagus
In 2000, Argentina, Brazil, Chile and Puerto Rico had the highest rates for male esophageal cancer mortality (values about 7 – 8/100 000). The same countries were also character-ized by high esophageal mortality in women (values between 2 and 3/100 000). Ecuador and Mexico showed very low mor-tality rates from esophageal cancer in both sexes. In some of the high risk countries, rates steadily declined in both sexes in the last three decades. Similar decreasing trends were found in most other Latin American countries, including Venezuela, which started from high rates in the 1970s, Colombia, Costa Rica and Ecuador, where the decline started since the late 1980s. In Cuba and Mexico, as well as in Canada and the USA, upward trends in rates were observed in men, but not in women.
In most countries, mortality patterns were similar for eso-phageal and oral and pharyngeal cancers, underlining simi-larities of risk factors for these two neoplasms, i.e. alcohol drinking and tobacco smoking [18, 19, 21], plus mate´ drinking [25] and other dietary items [23]. The rising trends observed in the last decades in Canada and in the USA are probably due to an increased incidence and mortality from adenocarci-noma of the esophagus, associated with overweight, obesity and gastro-esophageal reflux besides tobacco smoking, but not to alcohol drinking [26 – 28].
Stomach
Over recent calendar periods, male stomach cancer mortality was exceedingly high in some Latin American countries, including Chile, Costa Rica and Ecuador (with rates higher Table 2.(Continued)
Country Men Women
Deaths no. World standard Truncated 35 – 64 Deaths no. World standard Truncated 35 – 64 Venezuela 125 1.89 1.62 61 0.75 0.50 Canada 1082 4.34 3.17 437 1.20 0.92 USA 8163 3.65 2.83 3839 1.15 0.95 Leukemia Argentina 969 4.96 4.95 764 3.20 3.32 Brazil (1995) 1554 3.61 4.23 1340 2.76 3.43 Chile (1999) 282 4.29 4.72 252 3.22 3.38 Colombia (1999) 766 4.52 4.39 656 3.58 4.10 Costa Rica 82 5.20 4.82 55 3.29 3.77 Cuba 268 4.36 4.95 223 3.35 4.69 Ecuador 225 4.23 4.66 150 2.73 3.62 Mexico 1739 4.20 4.18 1562 3.54 4.20 Puerto Rico 95 4.02 4.59 85 3.15 4.62 Venezuela 410 4.31 4.02 335 3.31 3.97 Canada 1190 5.40 5.12 858 2.92 2.90 USA 11 777 5.94 5.56 9562 3.58 3.80 All neoplasms Argentina 30 253 153.52 191.32 25 237 98.65 147.22 Brazil (1995) 44 774 116.97 158.76 37 110 78.78 119.74 Chile (1999) 9426 155.98 154.46 9151 113.65 147.60 Colombia (1999) 13 343 103.72 116.20 13 588 89.41 130.13 Costa Rica 1662 123.81 109.22 1431 93.74 117.16 Cuba 9536 138.71 170.93 7270 102.86 160.58 Ecuador 3346 84.86 79.73 3584 82.62 118.51 Mexico 27 841 91.18 96.02 29 940 84.18 127.47 Puerto Rico 2766 115.95 141.47 2092 75.30 105.28 Venezuela 8217 116.53 124.82 7993 96.47 143.23 Canada 34 096 148.33 163.07 30 015 105.71 146.53 USA 292 641 146.41 172.04 273 996 105.38 146.26
than 20/100 000), Argentina, Brazil, Colombia and Venezuela (with rates between 10 and 20/100 000 in men). Only Cuba,
Mexico and Puerto Rico had male rates lower than
10/100 000, but still higher than those in Canada (5.2/100 000) and the USA (3.7/100 000). Stomach cancer mortality in women was lower than in men, but the geographical differ-ences were similar to those in men. Thus, rates were higher in Chile, Costa Rica and Ecuador (over 12/100 000), and lower in Argentina, Cuba and Puerto Rico (below 4/100 000). Corre-sponding figures in Canada and the USA were 2.6/100 000 and 1.8/100 000, respectively.
Mortality from stomach cancer continued to steadily decrease in the last three decades in most countries of Latin America, including Colombia and Ecuador, where rates showed increasing trends up to the 1980s. The reasons for the generalized favorable patterns in gastric cancer rates in these countries, as well as in the USA [4], Europe [1] and elsewhere in the world, are not completely understood, but almost cer-tainly include better food conservation—including refriger-ation—a more varied and affluent diet [23, 29, 30], reduced prevalence of Helicobacter pylori infection [31 – 33], and a possible reduction in tobacco smoking, at least in men [34]. However, mortality from stomach cancer is still extremely high in several Latin American countries, underlining the importance of continuous monitoring and effort in the preven-tion of this malignancy.
Intestines, chiefly colon and rectum
Mortality rates from cancer of the intestines in 2000 were below 10/100 000 in most countries of Latin America, the only exceptions being Argentina and Puerto Rico, where men had rates of 14.9 and 11.9/100 000, respectively, and Cuba where men had rates of 10.5/1000 and women of 12.8/100 000. Corresponding values in Canada and the USA were around 14 – 15/100 000 in men and around 10/100 000 in women. While in Canada and the USA mortality from colorectal cancer showed continuous downward trends in the last three decades [35], the pattern of colorectal cancer mortality in other countries of the Americas was less favorable. In Argentina, after a decline between the 1970s and the 1980s [36], rates were stable, or even slightly increasing, in the two last dec-ades. Increasing colorectal cancer mortality has also been observed in several other countries of Latin America.
The low rates for colorectal cancer in countries like Brazil, Colombia and Mexico, if not due to substantial underreport-ing, likely reflect long-term favorable dietary habits in these countries. However, patterns of colorectal cancer mortality are unfavorable in these, as in other countries of Latin America, probably as a consequence of modifications in dietary and life-style habits, including an increase in the prevalence of over-weight and obesity [37 – 39]. The relatively high colorectal cancer mortality in Argentina is consistent with a role of red meat (frequently consumed in this country) on colorectal car-cinogenesis [23]. In Cuba, as in Costa Rica and Ecuador, col-orectal cancer mortality rates (both all ages and truncated) were higher in women than in men, but there is no satisfactory
explanation for the peculiar sex ratio in these countries [40, 41]. It appears that Cuban women not only have higher rates of tobacco- (and alcohol-) related neoplasms, but also of col-orectal cancer, which is moderately associated with alcohol and tobacco consumption, but is probably related to nutrition and diet [42].
Larynx
In 2000, male mortality from laryngeal cancer was high in Argentina, Brazil and Cuba, with rates between 4 and 7/100 000 men, whereas countries with lower mortality were Chile, Costa Rica and Ecuador, with rates between 0.9 and 1.7/100 000, i.e. similar to those reported in Canada and the USA. Declines in mortality rates were observed in Argentina, Chile, particularly in middle-aged men, Ecuador, and Puerto Rico. A similar decrease in rates was observed in the USA since the early 1970s, and in Canada since the late 1980s. A steady upward trend since the late 1980s was observed in men from Cuba and Venezuela, particularly in middle-aged ones. The pattern in laryngeal cancer mortality was less clear in other countries. Female rates were extremely low (between 0.1 and 0.7/100 000) in most American countries (except Cuba, with a value of 1.2/100 000), and their trends were unremarkable.
This is another neoplasm strongly related to tobacco smok-ing and alcohol consumption [19], and its trends are consist-ent, although somewhat less favorable, with those for oral, pharyngeal and esophageal cancer, probably reflecting the pre-dominant role of tobacco on laryngeal carcinogenesis [21]. Rates in Canada, and particularly in the USA, were lower than in Latin American countries, as a consequence of a decrease in tobacco consumption in men in the last decades [22]. Mod-ern low tar yield cigarettes, which are deeply inhaled, are also associated with lower laryngeal cancer risk, compared to older ones [43]. Rates in Cuba, which are among the highest on a worldwide scale [2] can also be related to cigar [44], and con-sequently to black tobacco smoking [43, 45, 46].
Trachea, bronchus and lung
In 2000, lung cancer mortality rates in men were much lower in most Latin American countries (rates between 13 and 21/100 000) than in North America (rates over 40/100 000). The highest rates for men were registered in Argentina and Cuba (35.0 and 38.3/100 000, respectively), whereas the low-est rate was observed in Ecuador (7.7/100 000). In Argentina, rates have steadily, though moderately, decreased in the last three decades and are now lower than in the 1970s [36]. Conversely, in Cuba trends were stable overall, and slightly increasing in middle-aged men. In other Latin American countries, mortality from lung cancer, after a steady increase up to the 1980s [47], showed a tendency to level off in the last two decades, and even to decrease in middle-aged adults. Only in Ecuador and Venezuela, are rates in lung cancer mor-tality are still increasing. In the USA and Canada, substantial declines were observed in overall lung cancer rates over
the last two decades, and even greater declines in middle-aged adults since the early 1990s [48, 49]. Female lung cancer rates, in most Latin American countries, were still below 10/100 000, i.e. substantially lower than in North American women (rates over 20/100 000), with the only exception of Cuba (16.7/100 000). In several countries of Latin America, as in the USA [50], lung cancer mortality in women has, however, been increasing over the last decades [51].
Since the lung is the most important tobacco-related cancer site, these trends essentially reflect smoking habits of sub-sequent generations of men and women in various American countries [22]. Thus, while in men they probably reflect a decline in tobacco smoking in several countries, the persistent comparatively low rates in women from most Latin American countries indicate the scope of the intervention in tobacco con-trol, to avoid a major lung cancer epidemic in Latin American women in the near future. Occupational, mainly asbestos con-trol, environmental and perhaps dietary factors of lung cancer may also have exerted some influences on these favorable trends in men [52].
Bone
Mortality rates from bone cancer were higher in most countries in Latin America than they were in Canada and the USA, with rates around 1/100 000 in men and slightly lower in women. Since bone is one of the commonest sites of metastasis [15], this may reflect less accurate death certifica-tion in several Latin American countries compared with North America. Mortality trends for bone neoplasms are therefore difficult to interpret, but a general tendency to decline can be observed in various Latin American countries, as in Canada and the USA, probably reflecting improvements in accuracy and validity of death certification over recent calendar periods.
Breast
Female breast cancer mortality in 2000 was highest in Argen-tina (20.7/100 000), with rates higher than those reported in North America (i.e. around 18/100 000). In all other Latin American countries, rates were around 12 – 15/100 000, with the exception of Colombia, Ecuador and Mexico, where rates were below 10/100 000. Trends in mortality rates over the last decades were stable in Argentina, Chile and Cuba, while they were increasing in other Latin American countries, particu-larly those characterized by originally lower mortality. Con-versely, in North America, breast cancer mortality has been steadily declining, particularly in middle-aged women, in the last two decades [53, 54].
The increase in female breast cancer trends is likely to be related to changes in reproductive habits of subsequent cohorts of American women, and in particular to a decreased fertility [55]. Changes in dietary habits and other lifestyle factors [56], and increased overweight [37] may also have played some role in the recent upward trends in breast cancer. The declines in breast cancer mortality in North America, together with the stable rates in high and intermediate mortality areas from Latin America, and the systematic upwards trends in the low mor-tality ones indicate that rates tend to level off across the Amer-icas, probably as a consequence of a general tendency towards more uniform reproductive and lifestyle habits. The falls in breast cancer mortality observed in Canada and the USA, as well as in European countries [1], are probably attributable to advancements in therapy, including the widespread use of tamoxifen and adjuvant chemotherapy [57 – 59], although some role of (mammographic) screening is also possible [60]. Uterus (cervix and corpus)
On the basis of death certification, it is not possible to dis-tinguish cancers arising from cervix and from the corpus uteri Figure 1. Age-standardized (world population) death rates per 100 000 from 14 cancer sites plus total cancer mortality in selected countries of the Ameri-cas in 2000 (unless mentioned in parentheses).
Figure 2. Trends in age-standardized (world population) death rates per 100 000 from 14 cancer sites plus total cancer mortality in selected countries of the Americas, between 1970 and 2000; solid line and crosses, men, all ages; dotted line and crosses, men, truncated 35 – 64 years; solid line and open squares, women, all ages; dotted line and open squares, women, truncated 35 – 64 years.
(endometrium), and in several countries a substantial, though variable, proportion of deaths from uterine cancers are attribu-ted to ‘uterus unspecified’. However, since endometrial cancer mortality is rare at younger ages, truncated trends at age 35 – 64 years are probably due mainly to cervical cancer.
Uterine cancer rates were exceedingly high in Latin Amer-ica, essentially due to high rates of cervical cancer, as also indicated by the high mortality in middle-aged women. Rates were more than 15/100 000 overall and more than 30/100 000 at age 35 – 64 in Ecuador, Mexico and Venezuela, and more than 10/100 000 in all women and more than 20/100 000 at age 35 – 64 in most other countries. Only in Puerto Rico were mortality rates lower (4.9/100 000 in all women, and 9.1/100 000 in middle-aged ones). Rates in North America were around 4/100 000 overall and 7/100 000 truncated. A sys-tematic and steady fall in uterine cancer mortality was observed since the 1970s in most Latin American countries— particularly in middle-aged women—with the exception of Argentina and Cuba, where rates remained stable [61]. These downward trends are probably due to a decline in cervical cancer mortality, following some adoption, though still largely inadequate, of cervical screening in these countries [62, 63]. However, the excess mortality in most Latin America (still two- to four-fold higher than in North America) indicates the need of more adequate screening programs to limit the conse-quences of this avoidable cause of death [64, 65].
Ovary
Mortality data for ovarian cancer mortality were available only for a few countries from Latin America, and for a limited number of years. Ovarian cancer mortality rates in most Latin American countries were comparatively low (between 2 and 5/100 000 women) on an international scale (rates around 5 – 6/100 000 in North America). However, upward trends were observed in Argentina, Chile and Mexico in the last decades.
This pattern probably reflects a number of factors, includ-ing—as for breast cancer—the declined parity of subsequent generations of Latin American women, although modifications of dietary and other lifestyle factors may also have played some role on ovarian cancer rates [66]. Conversely, in Canada and the USA, ovarian cancer rates are now declining mainly in middle-aged women, probably as a consequence of a more widespread utilization of oral contraceptive in subsequent gen-erations of women [67].
Prostate
In 2000, Cuba and Venezuela had the highest prostate cancer mortality (rates over 20/100 000 overall), followed by Chile and Costa Rica, with overall rates around 20/100 000. Rates at
age 35 – 64 years were exceedingly high in Cuba
(10.5/100 000) and Venezuela (8.6/100 000) [68]. The lowest mortality was observed in Brazil and Mexico, with rates com-parable to those of North America, i.e. around 12 – 13/100 000 overall and 5 – 6/100 000 truncated. In the last decades, overall
prostate cancer mortality showed a moderate upward trend in all countries from Latin America. Since, however, no appreci-able trends have been observed below age 65, it is likely that the overall trends are influenced by recent changes in diagno-sis and certification of prostate cancer in the elderly [69]. This is particularly true for Chile, Costa Rica, Ecuador and Vene-zuela, showing substantial diverging trends over the last dec-ade for all age and truncated rates. In Canada and the USA, mortality from prostate cancer has long been stable, but has been declining in the last decade below age 65 years. In the elderly, after a rise up to the 1990s, a subsequent fall in rates has been observed [70].
Prostate cancer incidence essentially reflects the variable adoption of prostate specific antigen (PSA) testing in various populations. The favorable mortality trends observed in North America, however, likely reflect an increase in survival rates, due to improvements in treatment, including an earlier adop-tion of trans-urethral resecadop-tion of the prostate, as well as the use of hormonal and radio-therapy for patients with locally advanced prostate cancer [5, 71 – 73]. An earlier diagnosis of the disease, following the introduction of PSA since the late 1980s or early 1990s, may also have played a role over the last few years considered [74, 75]. In order to reduce prostate cancer mortality in Latin American countries, it is therefore important that diagnostic advancements and modern thera-peutic approaches for prostate cancer are urgently adopted.
Testis
As for ovarian cancer, testicular cancer mortality data were only available for a few countries and calendar years. In 2000, rates in Latin America ranged between 0.3/100 000 in Cuba and 1.3/100 000 in Chile. In North America, as in Europe [1], mortality rates have been steadily declining since the 1970 s, and in 2000 were about 0.2/100 000. Testicular cancer mor-tality is thus now appreciably higher in Latin America than in North America, reflecting an inadequate adoption of modern platinum-based chemotherapy regimens, which have substan-tially reduced mortality from testicular cancer in developed areas of the world since the early 1970s [76, 77]. Again, this calls for urgent adoption of modern treatment for a largely avoidable cause of death in young men.
Bladder
In 2000, bladder cancer mortality rates in Argentina and Cuba for men were at values comparable to those of North Ameri-can men (i.e. about 4/100 000). Male rates were lower in other countries of Latin America. In the last decades, rates showed a downward trend in Argentina and Venezuela, as in Canada and the USA, whereas trends were less clear in other countries. Since bladder cancer is another neoplasm strongly related to tobacco smoking [21], its mortality rates, with recent declines for males in various countries of Latin America, may reflect the patterns of tobacco smoking for sub-sequent generations of American men. Moreover, a variable role in the fall in bladder cancer mortality has probably been
played by reduced occupational exposure to carcinogens, too [78]. Higher bladder cancer mortality rates in Argentina and Cuba may also be related to black tobacco smoking [79, 80]. Bladder cancer in women is rarer, and its rates show no clear pattern of trends over time. As for lung cancer, the highest rates (around 1/100 000) were observed in Cuba, where tobacco smoking has long been common also in women. Leukemias
In 2000, mortality from leukemias in men was between 3 and 5/100 000 in countries from Latin America, i.e. slightly lower than that of Canada and the USA (rates around 5 – 6/100 000). Values in women from Latin America were between 2 and 4/100 000, comparable with those of North America. In North America, a steady decrease was observed since the early 1970s, following the adoption of integrated therapy regimens, mainly in children and young adults [81 – 83]. Trends in countries of Latin America were less consistent, with some declines in Argentina, and even increases in Ecuador and Mexico. As for testicular cancer, this would suggest some delay in the adoption of modern effective therapy schemes, although it is possible that these trends were also influenced by improved accuracy of diagnosis and certification [84]. All neoplasms (benign and malignant)
Total cancer mortality in countries of Latin America showed different patterns, which reflect the variable mortality rates and trends for site-specific cancers. In 2000, the highest total male cancer mortality was observed in Argentina and Chile, with rates comparable with those of Canada and the USA, i.e. about 150/100 000. For women, Chile and Cuba had the high-est rates in Latin America (113.7 and 102.9/100 000, respect-ively), again comparable with those of North America (around 105/100 000). These rates reflect the comparatively high mor-tality from cancer of the stomach (for Chile), lung and intes-tine (for Argentina) in men, and of stomach and uterus (for Chile), intestines and lung (for Cuba) in women. Colombia, Ecuador and Mexico [85] had the lowest male cancer mor-tality, due to low mortality from stomach, colorectal and lung cancer in those countries. For women, the lowest rates were in Brazil and Puerto Rico, reflecting their low stomach and cervi-cal cancer rates. In Argentina, Chile, Colombia, Costa Rica and Venezuela cancer mortality rates tended to decline, par-ticularly in men. Rates were stable in Ecuador and Puerto Rico, and increasing in Mexico and Cuba.
Thus, mortality from some common cancers (including col-orectal and lung) is still low in Latin America compared with Canada and the USA, and decreasing trends have been observed in the last decades for some cancer sites (including stomach, uterus, lung and other tobacco-related cancers) in several countries. However, mortality from female lung and breast cancers has been increasing in most countries of Latin America, and several countries still showed an extremely elev-ated mortality from cancer of the cervix.
Favorable trends in cancer mortality in Latin America in the near future would therefore require an integrated strategy
of prevention focused on the control of tobacco and alcohol, particularly for countries like Cuba and Brazil, adoption of a richer and more favorable diet for stomach cancer particularly in Chile, Costa Rica and Colombia, as well as screening and early diagnosis for cervical cancer. Adoption of therapeutic advancements for selected neoplasms amenable to treatment, including testicular cancer and leukemias, is also a priority for most countries of Latin America [86].
Acknowledgements
We thank M.P. Bonifacino for editorial assistance. This work was conducted with the contribution of the Italian Association for Cancer Research, and the Italian and Swiss Leagues Against Cancer.
References
1. Levi F, Lucchini F, Negri E et al. Cancer mortality in Europe, 1995 – 1999, and an overview of trends since 1960. Int J Cancer 2004; 110: 155 – 169.
2. Levi F, Lucchini F, Negri E, La Vecchia C. Worldwide patterns of cancer mortality, 1990 – 1994. Eur J Cancer Prev 1999; 8: 381 – 400. 3. Parkin DM, Bray F, Ferlay J, Pisani P. Estimating the world cancer
burden: GLOBOCAN 2000. Int J Cancer 2001; 94: 153 – 156. 4. Wingo PA, Cardinez CJ, Landis SH et al. Long-term trends in cancer
mortality in the United States, 1930 – 1998. Cancer 2003; 97: 3133 – 3275.
5. Jemal A, Clegg LX, Ward E et al. Annual report to the nation on the status of cancer, 1975 – 2001, with a special feature regarding survi-val. Cancer 2004; 101: 3 – 27.
6. La Vecchia C, Lucchini F, Negri E et al. Trends in cancer mor-tality in the Americas, 1955 – 1989. Eur J Cancer 1993; 29A: 431 – 470.
7. La Vecchia C, Negri E, Levi F et al. Cancer mortality in Europe: effects of age, cohort of birth and period of death. Eur J Cancer 1998; 34: 118 – 141.
8. World Health Organization Statistical Information System. WHO mortality database. Available from: http://www3.who.int/whosis/ menu.cfm. Geneva: World Health Organization 2003.
9. World Health Organization. International Classification of Disease: 8th Revision. Geneva: World Health Organization 1967.
10. World Health Organization. International Classification of Disease: 9th Revision. Geneva: World Health Organization 1977.
11. World Health Organization. International Statistical Classification of Disease and Related Health Problems: 10th Revision. Geneva: World Health Organization 1992.
12. Pan American Health Organization (PAHO). Special Program for Health, Technical Information System. Regional Mortality Database, 2001. Available from: http://www.paho.org.
13. Doll R, Smith PG. Comparison between registries: age-standardized rates. In Waterhouse JAH, Muir CS, Shanmugaratnam K et al. (eds): Cancer Incidence in Five Continents, Vol IV. IARC Sci Publ No 42. Lyon: International Agency for Research on Cancer 1982; 671 – 675. 14. Percy C, Staneck E, Gloeckler L. Accuracy of cancer death
certifica-tion and its effects on mortality statistics. Am J Public Health 1981; 71: 242 – 250.
15. Doll R, Peto R. The causes of cancer: quantitative estimates of avoid-able risk of cancer in the United States today. J Natl Cancer Inst 1981; 66: 1191 – 1308.
16. Boyle P. Relative value of incidence and mortality data in cancer research. Recent results. Cancer Res 1989; 114: 41 – 63.
17. Fernandez Garrote L, Sankaranarayanan R, Lence Anta JJ et al. An evaluation of the oral cancer control program in Cuba. Epidemiology 1995; 6: 428 – 431.
18. International Agency for Research on Cancer. IARC Monographs on the Evaluation of Carcinogenic Risk to Humans, Vol. 44: Alcohol Drinking. Lyon: International Agency for Research on Cancer 1988. 19. Franceschi S, Talamini R, Barra S et al. Smoking and drinking in
relation to cancers of the oral cavity, pharynx, larynx and esophagus in Northern Italy. Cancer Res 1990; 50: 6502 – 6507.
20. Wunsch-Filho V, de Camargo EA. The burden of mouth cancer in Latin America and the Caribbean: epidemiologic issues. Semin Oncol 2001; 28: 158 – 168.
21. International Agency for Research on Cancer. IARC Monographs on the Evaluation of Carcinogenic Risk to Humans, Vol. 83: Tobacco Smoke and Involuntary Smoking. Lyon: International Agency for Research on Cancer 2004.
22. World Health Organization. Tobacco or Health. A Global Status Report. Geneva: World Health Organization 1997.
23. World Cancer Research Fund. Food, Nutrition, and the Prevention of Cancer: a Global Perspective. Washington, DC: American Institute for Cancer Research 1997.
24. Franco EL, Kowalski LP, Oliveira BV et al. Risk factors for oral can-cer in Brazil: a case – control study. Int J Cancan-cer 1989; 43: 992 – 1000. 25. Castellsague X, Mun˜oz N, de Stefani E et al. Influence of mate drink-ing, hot beverages and diet on esophageal cancer risk in South Amer-ica. Int J Cancer 2000; 88: 658 – 664.
26. Blot WJ, Devesa SS, Kneller RW, Fraumeni JF. Rising incidence of adenocarcinoma of the esophagus and gastric cardia. JAMA 1991; 265: 1287 – 1289.
27. La Vecchia C, Negri E, Lagiou P, Trichopoulos D. Oesophageal ade-nocarcinoma: a paradigm of mechanical carcinogenesis? Int J Cancer 2002; 102: 269 – 270.
28. Vaughan TL, Davis S, Kristal A, Thomas DB. Obesity, alcohol, and tobacco as risk factors for cancers of the esophagus and gastric cardia: adenocarcinoma versus squamous cell carcinoma. Cancer Epidemiol Biomarkers Prev 1995; 4: 85 – 92.
29. La Vecchia C, Negri E, D’Avanzo B, Franceschi S. Electric refriger-ation use and gastric cancer risk. Br J Cancer 1990; 62: 136 – 137. 30. La Vecchia C, Munoz SE, Braga C et al. Diet diversity and gastric
cancer. Int J Cancer 1997; 72: 255 – 257.
31. Mun˜oz N. Is Helicobacter pylori a cause of gastric cancer? An apprai-sal of the seroepidemiologic evidence. Cancer Epidemiol Biomarkers Prev 1994; 3: 445 – 451.
32. Mun˜oz N, Kato I, Peraza S et al. Prevalence of precancerous lesions of the stomach in Venezuela. Cancer Epidemiol Biomarkers Prev 1996; 5: 41 – 46.
33. Morris Brown L. Helicobacter pylori: epidemiology and routes of transmission. Epidemiol Rev 2000; 22: 283 – 297.
34. Tre´daniel J, Boffetta P, Buiatti E et al. Tobacco smoking and gastric cancer: a review and meta-analysis. Int J Cancer 1997; 72: 565 – 573. 35. Ries LA, Wingo PA, Miller DS et al. The annual report to the nation
on the status of cancer, 1973 – 1997, with a special section on colorec-tal cancer. Cancer 2000; 88: 2398 – 2424.
36. Mun˜oz SE, Chatenoud L, La Vecchia C et al. Trends in cancer mor-tality in Argentina, 1966 – 1991. Eur J Cancer Prev 1998; 7: 37 – 44. 37. Filozof C, Gonzalez C, Sereday M et al. Obesity prevalence and
trends in Latin-American countries. Obes Rev 2001; 2: 99 – 106. 38. Aguilar-Salinas CA, Vazquez-Chavez C, Gamboa-Marrufo R et al.
Obesity, diabetes, hypertension, and tobacco consumption in an urban adult Mexican population. Arch Med Res 2001; 32: 446 – 453.
39. Kain J, Vio F, Albala C. Obesity trends and determinant factors in Latin America. Cad Saude Publica 2003; 19: S77 – S86.
40. Fernandez E, Bosetti C, La Vecchia C et al. Sex differences in colo-rectal cancer mortality in Europe, 1955 – 1996. Eur J Cancer Prev 2000; 9: 99 – 104.
41. Levi F, La Vecchia C, Lucchini F, Negri E. Trends in cancer mor-tality sex ratios in Europe, 1950 – 1989. World Health Stat Q 1992; 45: 117 – 164.
42. Schottenfeld D, Winawer SJ. Cancers of the large intestine. In Schottenfeld D and Fraumeni JF (eds), Cancer Epidemiology and Prevention. New York: Oxford University Press 1996; 619 – 636. 43. La Vecchia C, Bidoli E, Barra S et al. Type of cigarettes and cancers
of the upper digestive and respiratory tract. Cancer Causes Control 1990; 1: 69 – 74.
44. La Vecchia C, Bosetti C, Negri E et al. Cigar smoking and cancers of the upper digestive tract. J Natl Cancer Inst 1998; 90: 1670.
45. Sancho-Garnier H, Theobald S. Black (air-cured) and blond (flue-cured) tobacco and cancer risk II: pharynx and larynx cancer. Eur J Cancer 1993; 29: 273 – 276.
46. Gallus S, Altieri A, Bosetti C et al. Cigarette tar yield and risk of upper digestive tract cancers: case – control studies from Italy and Switzerland. Ann Oncol 2003; 14: 209 – 213.
47. Boffetta P, La Vecchia C, Levi F, Lucchini F. Mortality patterns and trends for lung cancer and other tobacco-related cancers in the Ameri-cas, 1955 – 1989. Int J Epidemiol 1993; 22: 377 – 384.
48. Wingo PA, Ries LAG, Giovino GA et al. Annual Report to the Nation on the status of cancer, 1973 – 1996, with a special section on lung cancer and tobacco smoking. J Natl Cancer Inst 1999; 91: 675 – 690. 49. Jemal A, Chu KC, Tarone RE. Recent trends in lung cancer mortality
in the United States. J Natl Cancer Inst 2001; 93: 277 – 283.
50. Howe HL, Wingo PA, Thun MJ et al. Annual report to the nation on the status of cancer (1973 through 1998), featuring cancers with recent increasing trends. J Natl Cancer Inst 2001; 93: 824 – 842. 51. Center for Disease Control and Prevention. Women and smoking: a
report of the Surgeon General (Executive Summary). MMWR 2002; 51: 1 – 13. (No. RR-12).
52. Blot WJ, Fraumeni JF Jr. Cancer of the lung and pleura. In Schotten-feld D, Fraumeni JF Jr (eds): Cancer Epidemiology and Prevention, 2nd edition. New York: Oxford University Press 1996; 637 – 665. 53. Weir HK, Thun MJ, Hankey BF et al. Annual report to the nation on
the status of cancer, 1975 – 2000, featuring the uses of surveillance data for cancer prevention and control. J Natl Cancer Inst 2003; 95: 1276 – 1299. [Erratum in: J Natl Cancer Inst 2003; 95: 1641]. 54. Ghafoor A, Jemal A, Ward E et al. Trends in breast cancer by race
and ethnicity. CA Cancer J Clin 2003; 53: 342 – 355.
55. Henderson BE, Pike MC, Berstein L, Ross RK. Breast cancer. In Schottenfeld D, Fraumeni JF Jr (eds): Cancer Epidemiology and Prevention, 2nd edition. New York: Oxford University Press 1996; 1022 – 1039.
56. Mezzetti M, La Vecchia C, Decarli A et al. Population attributable risk for breast cancer: diet, nutrition, and physical exercise. J Natl Cancer Inst 1998; 90: 389 – 394.
57. Early Breast Cancer Trialists’ Collaborative Group. Tamoxifen for early breast cancer: an overview of the randomised trials. Lancet 1998; 351: 1451 – 1467.
58. Early Breast Cancer Trialists’ Collaborative Group. Polychemother-apy for early breast cancer: an overview of the randomised trials. Lancet 1998; 352: 930 – 942.
59. Mariotto A, Feuer EJ, Harlan LC et al. Trends in use of adjuvant multi-agent chemotherapy and tamoxifen for breast cancer in the Uni-ted States: 1975 – 1999. J Natl Cancer Inst 2002; 94: 1626 – 1634.
60. Jatoi I, Miller AB. Why is breast cancer mortality declining? Lancet Oncol 2003; 4: 251 – 254.
61. Bocciolone L, La Vecchia C, Levi F et al. Trends in uterine cancer mortality in the Americas, 1955 – 1988. Gynecol Oncol 1993; 51: 335 – 344.
62. IARC, Working Group on Evaluation of Cervical Screening Pro-grammes. Screening for squamous cervical cancer: duration of low risk after negative results of cervical cytology and its implication for screening policies. BMJ 1986; 293: 659 – 664.
63. Peto J, Gilham C, Fletcher O, Matthews FE. The cervical cancer epi-demic that screening has prevented in the UK. Lancet 2004; 364: 249 – 256.
64. Robles SC, White F, Peruga A. Trends in cervical cancer mortality in the Americas. Bull Pan Am Health Organ 1996; 30: 290 – 301. 65. Arossi S, Sankaranarayanan R, Parkin DM. Incidence and mortality
of cervical cancer in Latin America. Salud Publica Mex 2003; 45 (Suppl 3): S306– S314.
66. La Vecchia C. Epidemiology of ovarian cancer: A summary review. Eur J Cancer Prev 2001; 10: 125 – 129.
67. Bosetti C, Negri E, Trichopoulos D et al. Long-term effects of oral con-traceptives on ovarian cancer risk. Int J Cancer 2002; 102: 262 – 265. 68. Alvarez YH, Guerra Yi ME, Garrote LF, Rodrı´guez RC. Incidence,
mortality and survival from prostate cancer in Cuba, 1977 – 1999. Eur J Cancer Prev 2004; 13: 377 – 381.
69. Boyle P. Prostate cancer: creation and control of an epidemic. J Epi-demiol Biostat 1996; 1: 65 – 67.
70. Tarone RE, Chu KC, Brawley OW. Implications of stage-specific sur-vival rates in assessing recent declines in prostate cancer mortality rates. Epidemiology 2000; 11: 167 – 170.
71. Bolla M, Gonzalez D, Warde P et al. Improved survival in patients with locally advanced prostate cancer treated with radiotherapy and goserelin. N Engl J Med 1997; 337: 295 – 300.
72. Messing EM, Manola J, Sarosdy M et al. Immediate hormonal therapy compared with observation after radical prostatectomy and pelvic lymphadebectomy in men with node-positive prostate cancer. N Engl J Med 1999; 341: 1781 – 1788.
73. Kupelian PA, Buchsbaum JC, Elshaikh MA et al. Improvement in relapse-free survival throughout the PSA era in patients with localized prostate cancer treated with definitive radiotherapy: year of treatment an independent predictor of outcome. Int J Radiat Oncol Biol Phys 2003; 57: 629 – 634.
74. Hankey BF, Feuer EJ, Clegg LX et al. Cancer surveillance series: interpreting trends in prostate cancer—part I: evidence of the effects of screening in recent prostate cancer incidence, mortality, and survi-val rates. J Natl Cancer Inst 1999; 91: 1017 – 1024.
75. Levi F, La Vecchia C, Boyle P. The rise and fall of prostate cancer. Eur J Cancer Prev 2000; 9: 381 – 385.
76. Levi F, Lucchini F, Boyle P et al. Testicular cancer mortality in East-ern Europe. Int J Cancer 2003; 105: 574.
77. Boyle P. Testicular cancer: the challenge for cancer control. Lancet Oncol 2004; 5: 56 – 61.
78. Negri E, La Vecchia C. Epidemiology and prevention of bladder can-cer. Eur J Cancer Prev 2001; 10: 714.
79. Iscovich J, Castelletto R, Esteve J et al. Tobacco smoking, occu-pational exposure and bladder cancer in Argentina. Int J Cancer 1987; 40: 734 – 740.
80. D’Avanzo B, Negri E, La Vecchia C et al. Cigarette smoking and bladder cancer. Eur J Cancer 1990; 26: 714 – 718.
81. La Vecchia C, Levi F, Lucchini F et al. Trends in childhood cancer mortality as indicator of quality of medical care in the developed world. Cancer 1998; 83: 2223 – 2227.
82. Pui CH, Evans WE. Acute lymphoblastic leukemia. N Engl J Med 1998; 339: 605 – 615.
83. Levi F, Lucchini F, Negri E et al. Trends in mortality from leukemia in subsequent age groups. Leukemia 2000; 14: 1980 – 1985. 84. Linet MS, Cartwright RA. The Leukemias. In Schottenfeld D, JF Jr
(eds): Cancer Epidemiology and Prevention, 2nd edition. New York: Oxford University Press 1996; 841 – 892.
85. Malvezzi M, Rodriguez T, Chatenoud L et al. Trends in cancer mor-tality in Mexico, 1970 – 1999. Ann Oncol 2004; 15: 1712 – 1718. 86. Garattini S, La Vecchia C. Perspectives in cancer chemotherapy. Eur