Development of a Global Facility Location Analysis Tool
By
Briana F. Johnson
Bachelor of Science in Mechanical Engineering (1998)
Submitted to the MIT Sloan School of Management and the Engineering Systems Division in Partial Fulfillment of the Requirements for the Degrees of
Master of Business Administration AND
Master of Science in Engineering Systems Division
MASSACHUSETTS OF TECHNOL
JUN 2 5 2
LIBRARI
In conjunction with the Leaders for Manufacturing Program at the
Massachusetts Institute of Technology June 2008
© 2008 Massachusetts Institute of Technology. All rights reserved
Signature of Author
P neering Systems Division &
M Sloan School of Management
A May 9, 2008
Certified by
Debor Nighting *, Thesi upervisor
Professor of the Practice, Dept. of Aeronautics & Astronautics and Engineering Systems Division Certified by
Roy Welsch, Thesis Supervisor
Professor of StatsIc and Management Science, Director CCREMS Accepted by
Dr. Richard Larson, Professor of Engineering Systems Chair, ESD Education Committee Accepted by
/ -Debbie Berechman
Executive Director of MBA Program, MIT Sloan School of Management
INSTIU .OGY
008
Development of a Global Facility Location Analysis Tool
By
Briana F. Johnson
Submitted to the MIT Sloan School of Management and the
Engineering Systems Division on May 9, 2008 in Partial Fulfillment of the Requirements for the Degrees of Master of Business Administration and
Master of Science in Engineering Systems Division
ABSTRACT
With an economy and customer base that is global, companies are increasingly expanding outside their home country's borders. Many times this is done to take advantage of lower labor or material rates, to increase proximity to the customer, to decrease logistics and transportation costs, to avoid tariffs and other taxes as well as many other factors. How does a company take advantage of the benefits of global operations while still taking into account the corporate strategy and risks associated with a location? By looking beyond standard matrix analysis tools that provide a one number comparison of potential locations, this thesis will expand the existing tools to incorporate the views of Enterprise Architecting to provide a more complete picture of how the decision to expand to one location versus another supports the desired architecture of the firm. This thesis combines analytical hierarchy process with a two level decision matrix to quantify the score of each location. A risk profile was developed to quantify the risk associated with specific locations and criteria in order to provide a more complete picture of the potential costs and benefits of building a facility in a certain location. This more complete view of location analysis will provide a tool that is both repeatable and reliable in its results and allows for an objective decision to be made on location in terms of the critical factors.
Thesis Supervisor: Deborah Nightingale
Title: Professor of the Practice, Department of Aeronautics & Astronautics and Engineering Systems Division
Thesis Supervisor: Roy Welsch
Acknowledgments
I would like to thank all of my friends and family back home in Washington but most of all my Mother for all of her love and support throughout school and in particular during the internship when I would call her at all hours of the day and night from exotic locales. Thanks to my classmates and friends for their tireless support and friendship throughout the past two years. Thank you to all of the people at Schlumberger who allowed me access to their sites and their countries of operations. I appreciate the efforts of Jon and JR who helped me to learn more about the locations I was visiting. To Michelle Bernson, whose persistent encouragement resulted in my attending LFM, must go a special thank you. Finally thank you to The Boeing Company for their generous sponsorship and support that enabled me to attend the LFM program.
Biographical Note
Briana Johnson was born and raised in the Puget Sound region of Western Washington. She attended the University of Washington, graduating in 1998 with a Bachelor of Science in Mechanical Engineering. Joining The Boeing Company in 1998 she spent over 6 years as a Liaison Engineer on the 747 program. Much of her time working with the 747 program involved the application of lean principles and practices to the engineering office and production support functions. Immediately before joining the LFM program, as a student sponsored by The Boeing Company, she spent a year working for the 787 program on process development. She is currently planning to return to work for The Boeing Company in the Puget Sound area.
Table of Contents
Acknowledgments ... 5 Biographical Note ... 7 Table of Contents ... ... 9 T able of Figures ... 11 T able of T ables ... 13 1. Introduction ... 151.1. Problem Statem ent ... ... 15
1.2. Company Background ... ... 16
1.2.1. Needs for Global Expansion... 17
1.3. Previous Location Decision Processes within the Company... 18
1.4. Scope of Location Analysis Tool ... 18
1.4.1. What is included, what is not included and why... 20
2. Literature Review ... 23
3. Methodology...y ... 25
3.1. Approach to Solving the Problem ... ... ... 25
3.1.1. Understanding Previous Location Decision Tools and Methods ... 25
3.1.2. The Schlumberger Completion Products Manufacturing Value Chain ... 25
3.2. Overarching Tool M ethodology... ... 30
3.2.1. Tool Goals and Features ... ... .. 30
3.2.2. Notional Flow of Information and Involvement ... ... 32
3.3. Location D ecision M atrix ... ... .... ... ... ... ... ...35
3.3.1. Categories ... ... ... 35
3.3.2. Criteria ... 36
3.3.3. Use of Importance and Attractiveness Ratings ... ... 37
3.3.4. How Ratings Determine the Final Score...38
3.4. Analytical Hierarchy Process...40
3.4.1. Discussion of how Analytical Hierarchy Process works ... 41
3.4.2. Benefits of the Analytical Hierarchy Process... 42
3.4.3. Deficiencies of the Analytical Hierarchy Process ... 42
3.5. R isk Profile ... ... ... ... 43
3.5.1. Using Importance and Attractiveness to Determine Risk Level ... 44
3.5.2. R isk Levels ... ... .... ... ... ... 44
3.5.3. Building a Risk Matrix...45
3.5.4. A djustability ... ... ... ... 46
3.6. Enterprise Architecting...46
3.6.1. How the Seven Views Are Represented in the Tool ... 47
3.6.1.1. Strategy ... ... .... .. ... ... ... ... .... .. ... ... 48
3.6.1.2. Policy and External Factors ... 48
3.6.1.3. Process ... ... ... . ... 49
3.6.1.5. Knowledge ... 49
3.6.1.6. Inform ation Technology... 50
3.6.1.7. Products and Services ... 50
4. Results ... 51
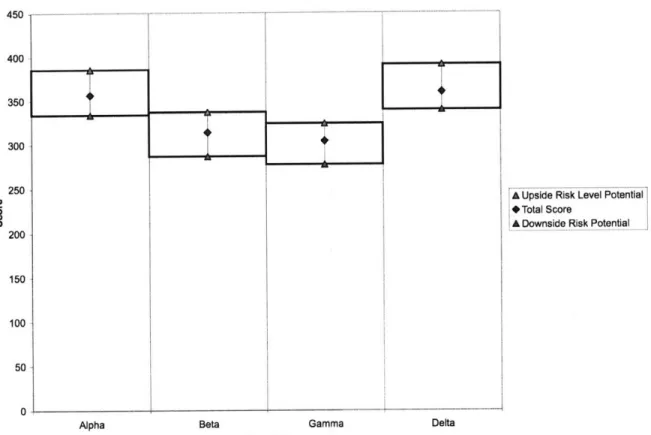
4.1. Overall Results... ... 51
4.2. Location Specific Results ... ... 53
4.2.1. Location Alpha ... ... 54
4.2.2. Location Beta... ... 55
4.2.3. Location Gam m a ... 56
4.2.4. Location Delta ... 57
5. Discussion ... 59
5.1. Major Patterns, Relationships, Trends and Generalizations ... 59
5.2. How the Results Help in Making a More Strategic Location Decision ... 59
5.3. Interpretation of Results in Context of the Problem Statement ... ... 60
6. Recom mendations ... 61
6.1. Directions for Future Investigations on this or Related Topics ... 61
6.2. Tool Refinem ents ... 62
6.2.1. Category and Criteria Validation... ... ... 62
6.2.2. Benchm arking Existing Locations... 62
6.2.3. Risk Profile... 63
Bibliography ... 65
Appendix A - Categories and Criteria ... 67
Appendix B - Analytical Hierarchy Process Exam ple ... ... 69
Table of Figures
Figure 1: Levels of Involvement Requiring Input... 33
Figure 2: D ata Resulting from Inputs ... ... ... 34
Figure 3: Risk Levels and Risk Profile M atrix... ... ... 45
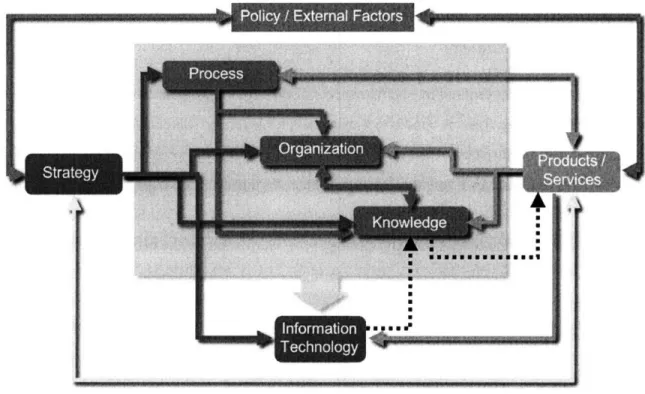
Figure 4: Enterprise Architecture Views Interrelationships... ... 47
Figure 5: Overall Results by Location ... ... 52
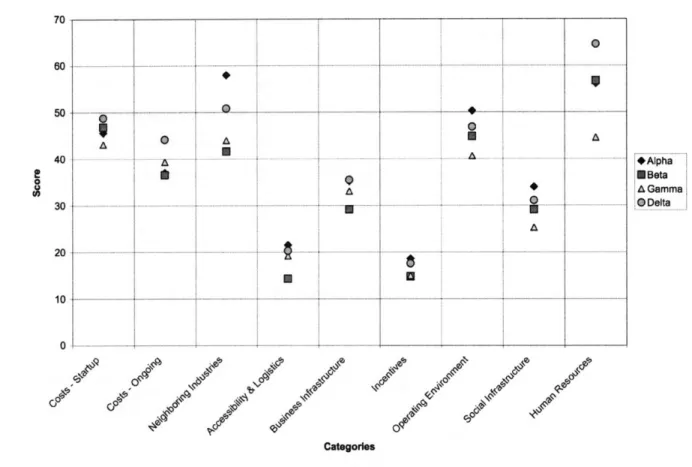
Figure 6: Overall Scores for Each Location by Category ... ... 53
Figure 7: Results for Location Alpha by Category... 54
Figure 8: Results for Location Beta by Category... ... 55
Figure 9: Results for Location Gamma by Category... 56
Table of Tables
Table 1: Summary of Tool Design Goals/ Features... 32
Table 2: Categories Used in the Location Analysis Tool ... ... 36
Table 3: Importance and Attractiveness Scale and Associated Definitions ... 37
1.
Introduction
Several topics will be covered as this thesis progresses. Chapter 1 provides an overview of the problem statement, company background, including discussions on the process previously used
to determine locations for expansion, and the scope of the tool proposed within this thesis. Chapter 2 reviews the current literature covering the problems and methodologies used within this thesis. Chapter 3 discusses the methodology used to develop a tool that satisfactorily solves the problem. Subsections of Chapter 3 are each devoted to the location decision matrix that results from the research conducted in support of this thesis: the incorporation and use of
analytical hierarchy process as a decision tool; the development of a risk profile to attempt to quantify some risk associated with making location decisions; and how the enterprise
architecture frameworks are supported by this model. The results from data gathered during a proof of concept analysis of four representative countries are reviewed in Chapter 4. Chapter 5
discusses the results, including major patterns observed and an interpretation of the results. Finally, Chapter 6 reviews the recommendations for further work on this topic.
1.1.
Problem Statement
There are expansion decisions that affect the ultimate success or failure of companies as they grow. These decisions can be a determining factor between a venture that is merely successful and one that is highly profitable. They can also provide a competitive advantage in both a strategic and an operational perspective. When making the decision to expand operations, a company is building a piece of the future architecture of its enterprise. As a result, the choices can have a large impact on the seven views represented in an enterprise architecture framework': strategy, policy and external factors, products and services, information technology, processes, organization, and knowledge. Expanding without taking into consideration the effect potential locations will have on the future desired architecture can limit future maneuverability of the enterprise. When making decisions about facility expansion not only does the architecture of the enterprise need consideration but also the process and methodology used in making location
decisions. The decisions need to be objective, allow for multiple stakeholder perspectives and enable decision makers to see an accurate portrayal of the risk associated with a particular location. How to integrate these multiple goals into a tool that provides accurate decision information within a process that is repeatable and reliable is the intent of this thesis. It is possible to consider the architecture of the entire enterprise when making specific and possibly isolated facility location decisions using a methodology that gives objective results, targets multiple stakeholders and allows for future improvement.
1.2.
Company Background
Schlumberger Limited is one of the world's leading oilfield services companies, founded in
1926. Schlumberger employs 80,000 employees, representing 140 nationalities in approximately 80 countries around the world. Their focus is on supplying technology, information solutions and
integrated project management with the goal of optimizing well performance for their customers in the oil and gas industry with 2007 revenue in excess of $23 billion. With principle offices
located in Houston, Paris and The Hague and a market capitalization of $102 billion2, the
company comprises two major business segments. The principle activities of the oilfield services segment are products and services that support the entire life cycle of core industry, operational processes including formation evaluation through directional drilling, well cementing and
stimulation, well completions and productivity to consulting, software, information management and information technology infrastructure services. The other major segment is WesternGeco, the world's largest seismic company, which supplies advanced acquisition and data processing services.3
Schlumberger offers an unrivaled technology portfolio, global expertise and exceptional service quality to their customers, ensuring that their customers are able to maximize productivity
2 Google Finance. Schlumberger Limited (ADR) Retrieved March 7, 2008, from
http:/ifinance.roogle.comifinance'?q=slb&hl= en
3 Schlumberger Company Website. Backgrounder, Schlumberger. Retrieved March 7, 2008, from
throughout the life of the reservoir. The differentiating technologies that Schlumberger offers focus on four key activities: 1. finding the reservoir through industry-leading seismic technology, 2. reaching the reservoir more efficiently through the use of technology to enable optimal well placement and maximum recovery, 3. connecting the reservoir by designing and manufacturing customized solutions that can be modified throughout the life of the field to ensure longer and more efficient production, and 4. producing the reservoir using digitally enabled technologies to ensure critical data is captured and acted upon in order to allow improved production
performance.
1.2.1. Needs for Global Expansion
Schlumberger is experiencing growth in several areas of their products and services. The increase in demand for their products and services, especially in manufacturing intensive areas such as completions, has required an increase in the manufacturing capacity for these products. The competitive advantage that Schlumberger offers its clients are: 4
* Deep domain knowledge of exploration and production operations
* The service industry's longest commitment to technology and innovation through their network of 23 research, development and technology centers
* Strong local experience in addition to a large global reach into more than 80 countries and the diversity in thought, background and knowledge that their global nationalities bring
* A commitment to excellence in service delivery anytime, anywhere
This increased growth, the company's stated commitment to its clients, and potential for low cost advantages encourage Schlumberger to look globally for additional manufacturing capacity. While the internship and resulting location analysis tool were conceived for analyzing locations for potential manufacturing facilities it is applicable to any facility to be located globally.
4 Schlumberger Company Website. Backgrounder, Schlumberger. Retrieved March 7, 2008, from
1.3.
Previous Location Decision Processes within the Company
Schlumberger identified the need for a quick, accurate, objective location analysis tool to satisfy its expansion needs. Previously, decisions were under less time pressure and more cumbersome methods could be used. For instance, a complete cost analysis could be done on several locations allowing for a much more detailed, albeit longer, process of analysis to occur. In this event, the results of the analysis are easily imported into instruments and documents required for justifying capital asset requests. However, this still did not ensure that the process was conducted in the same manner from project to project, since the process appeared to involve different individuals who were not always able to share best practices or insights with colleagues who later performed similar analyses. This encourages a duplication of effort that is not desirable from the company's standpoint. The new tool will allow the company to turn the ability to make these decisions quickly into a strategic advantage, allowing them to possibly create first mover advantages or to reap the benefits of a location more quickly.
Anecdotal evidence also suggests that decisions could be made with undue emotional investment on the part of individuals with a bias for a specific location or strategic direction. It is natural human behavior to have difficulty in looking at one's home location in an objective manner, not to say that it is unachievable, but over the course of many decisions the probability that bias does not play a role in decision-making certainly cannot be ruled out. Including multiple opinions can help to alleviate this problematic situation, but that also creates additional problems of reaching a consensus. With no stable process and criteria to use, the ability of people to agree on the
analysis of a location is further hampered by this potential for increasing disagreement on the criteria used to conduct the analysis.
1.4.
Scope of Location Analysis Tool
Main objectives of the location analysis tool to be created were specific to the company's situation. First, the company wanted a methodology created that would allow them to transfer knowledge of the tool and the process by which the tool is intended to be used throughout the individual segments and across the different segments of the company. This tool and its
tool should not be designed to require the author or initial company experts' presence in order to allow for successful execution. By having a standard methodology, tool and work instruction results from many projects can be compared to one another. In this way a feedback mechanism is built into the use of the tool that encourages those who use the tool to modify not only the tool but also the standard work instructions as different users on projects of different magnitude and scope identify improvements.
Another equally important area that required addressing was the objectivity of the methodology and tools used. In the past when tools have been used within the company, they were created ad hoc for each individual situation. Through interviews and anecdotal stories there also appeared to have been instances where no tool was used but instead there was a move toward a certain
location because of a large perceived advantage to that location or a strongly held opinion by influential individuals. For example, low wages, special economic zones, tax incentives, etc. have played a role in the selection of past sites. While these are valid reasons to consider a particular site they often do not paint a clear picture of the entire business environment in which business will be conducted. The resulting tool will need to have mechanisms in place to increase the objectivity of the analysis and results. Input will be required from multiple levels of the organization in order to accurately portray the strategies and objectives of those different levels. The tool will also need to be able to separate those levels from each other so as not to bias one level of decision making from another.
Being able to adjust the parameters on which locations are scored is an important feature for the tool. In order to facilitate discussion, mediate disagreements, and explore alternatives, the parameters and their effect on the resulting output of the tool should be easily adjusted. This will allow users and those who will be making decisions based on the output to explore "what if' scenarios, to explore how deferring to another's opinion affects the results of the analysis. Including a way for the tool to quantify risk is one of the most critical improvements over analysis methods used in the past. The goal is for risk to be included to show the range of potential outcomes for a location in lieu of a one number answer corresponding to "the score" of a particular location. As this is a new application of incorporating risk into an existing tool the exact determination of "how" to calculate the amount of risk associated with certain criteria will
invariably need to be adjustable in order to accommodate increased learning about the affect of applying multiple risk effects on the analysis of locations.
1.4.1. What is included, what is not included and why
Because the focus of the company's goals for the project were more centered on developing a robust methodology that could be used as a platform on which to improve and also incorporate functionality and analysis capabilities, the focus shifted away from researching and developing the most comprehensive list of criteria available. Certainly alternate lists of criteria exist in the literature, but incorporating new criteria into the tool developed as part of this thesis should be relatively easy and straightforward as new criteria are discovered to be pertinent to the location decisions Schlumberger is making. Included in this thesis is a defined methodology, suggestions for improving the tool and areas for further research and development.
Because criteria development was not the main focus, developing a way to incorporate risk into the analysis was the first goal included in the tool. Effort was made to determine a way that risk can be calculated and not treated as another independent variable that is chosen by the person conducting the analysis. Also, developing a risk profile that was reasonably representative of the actual experiences based on previous decisions and their actual outcomes, proved to be a design feature that required detailed consideration. To enhance the lack of objectivity in the current tools, the ability to have multiple viewpoints independently used in the analysis, is included as a design feature.
Creating a tool that has the ability to adjust the different parameters and see the effect on the analysis that was included, allows the tool to be used as a starting point for discussion among the stakeholders. Including this feature enables project stakeholders to change one, or many
parameters and see if the recommendation for location selection change based on the new analysis. Since previous tools did not provide this ability, there was a sense by those seeing the results that they may not accurately represent the situation from their viewpoint. Unfortunately what is not included with the tool is quantitative data to use in rating locations with respect to the criteria. The author found independent information for the variety of locations under
consideration difficult to obtain. Specifically finding generally accepted data to define what represents subjective ideas like "good", "excellent", or "poor" for the wide variety of economic,
human resource, logistical and capital criteria available for use in future decisions was not obtainable. Due to the time constraints of the internship upon which this thesis is based, an actual test case and associated results are not included as part of the thesis. Instead a potential manufacturing facility to produce a representative sample of Schlumberger Completions products in four potential locations was used as a proof of concept for the tool. The
recommendations and results from this proof of concept case were reviewed with management to ensure that the proof of concept results met the goals of the project.
2. Literature Review
As companies become increasingly global enterprises with more complex organizational,
product and process, supply chain and customer issues, there is a need to define new concepts for how to manage these extended enterprises. With the concept of a system of systems5 we see the increasing organic nature of terms used to define enterprises.6 The concept of enterprise
architecting is now a well-established field of academic study. Much of the current work involves defining the aspects of art and science in the definition of these complex systems.7 In looking at how the location decision affects the enterprise, we are essentially looking at ways to transform the enterprise.8 The tool developed within this thesis is one tool that can be applied to the specific problem of locating a facility, which in turn is a piece in the transformation of the enterprise.
Analytical Hierarchy Process (AHP) is an established method with many applications that allows for the consideration of qualitative and quantitative aspects of a decision. For example, AHP has been used as a method to benchmark the performance of facility managementg; as a tool to assess different strategies for an organization based on environmental factors and their probability of occurrencelo; for evaluating supply chain management"; and managing the risks within the
5 Maier, M. W. Architecting Principles for Systems-of-Systems Chantilly, VA: John Wiley & Sons, Inc., 1999. 267-284.
6 Piepenbrock, T. F., Fine, C. H. & Nightingale, D. J. Toward a Theory of Evolution of Business Ecosystems: Enterprise Architectures, Competitive Dynamics. Firm Performance and Industrial Co-Evolution. March 2008. 22 p. 7 Nightingale, D. J. & Rhodes, D. H. (2004, Mar.). Enterprise Systems Architecting: Emerging Art and Science within Engineering Systems. MIT Engineering Systems Symposium. Massachusetts Institute of Technology. 8 Rouse, W. B. (2005). Enterprises as Systems: Essential Challenges and Approaches to Transformation. Systems Engineering, 8(2), 138-150.
9 Gilleard, J. D. & Yat-lung, P. (2004). Benchmarking Facility Management: Applying Analytical Hierarchy Process. Facilities, 22(1/2), 19-25.
10 Tavana, M. & Banerjee, S. (1995). Strategic Assessment Model (SAM): A Multiple Criteria Decision Support
System for Evaluation of Strategic Alternatives. Decision Sciences, 26(1), 119-143.
" Sharma, M. & Bhagwat, R. (2007). An Integrated BSC-AHP Approach for Supply Chain Management Evaluation. Measuring Business Excellence, 11(3), 57-68.
supply chain'2. In the context of this project and thesis, AHP is used as a tool for determining the strategic objectives of the organization as it relates to location expansion.
The facility location decision has used many tools and techniques. The main themes recently seen are the globalization of facilities. This can be attributed in part to the lowering of trade barriers and the emergence of just in time delivery from suppliers and to customers. Location
decisions have been made to minimize transportation costs, gain access to markets and satisfy content requirements. This thesis combines previous efforts into a comprehensive enterprise architecture tool. AHP has been used to compare locations based on many of the factors that are also included in the tool developed in this thesis.'3 AHP represents one level of analysis
conducted in conjunction with this thesis. It was not used as the only analysis method because it becomes time consuming as the number of criteria becomes large. Also having multiple levels of analysis allows for multiple stakeholder inputs while partitioning each stakeholder into a
particular segment.
The research on determining risk presented several options. The AHP method was found to have great potential in quantifying the risk seen in processes in order to determine on which factors you should focus mitigation plans.14 Other methods that have been researched are compliance to a measurement variable such as lead-time. If a certain process or product is not meeting targets, it is labeled as a risk item. However, these methods require an additional determination to be made on the part of the data collector, making them an independent variable. This means that additional criteria are needed to define the appropriate levels and subjective assessments to be made.
12 Gaudenzi, B. & Borghesi, A. (2006). Managing Risks in Supply Chain Using the AHP Method. The International
Journal of Logistics Management, 17(1), 114-136.
13 Jiaqin, Y. & Lee, H. (1997). An AHP Decision Model for Facility Location Selection. Facilities, 15(9/10), 241.
14 Gaudenzi, Barbara and Antonio Borghesi (2006). Managing risks in the supply chain using the AHP method, The International Journal of Logistics Management, Vol. 17, No. 114-136
3. Methodology
3.1.
Approach to Solving the Problem
3.1.1. Understanding Previous Location Decision Tools and Methods
Upon arrival at the company site in Texas and understanding the broad project scope, the author spent time with a group of people who had recently completed a manufacturing facility location analysis using the existing tools and techniques within Schlumberger. Through a meeting with these individuals, the author was exposed to the pace of expansion that would be required to meet projected demand. We also spent considerable time working through the matrix that they used to evaluate the potential sites. They used a list of criteria which they had individually weighted on a scale of 0 to 1 and then evaluated each location by assigning a 1 to 5 score
corresponding to how well the location satisfied the criteria. This matrix produced a single number representing the aggregate score for each location. We discussed several critical criteria categories, although no formal categories existed within the matrix used, including the
importance of utility availability and quality, real estate option and costs, taxes, and human resources. The location recommended from this matrix was then used to develop a detailed Capital Asset Request. The specific financial information for the location was used in
conjunction with projected demand for a representative sample of parts that would be built in the new facility to create a profit and loss projection for the next 10 years. As part of this model, assumptions were made as to the rate of production ramp up, the desired steady state mix of production outsourcing, the development of the supplier base, and the development of the human
capital. 15
3.1.2. The Schlumberger Completion Products Manufacturing Value Chain
In order to gain an understanding of the products encompassed by the completions manufacturing group, the author spent approximately two months in two globally diverse
manufacturing facilities. Both facilities manufactured the same category of products from the completions and artificial lift product lines and had come under the control of Schlumberger as a result of their acquisition of Camco International, Inc. The first location was a Texas
manufacturing facility where the focus of several weeks there would be an understanding of the operations from customer service and order entry through the manufacturing and support operations to the warehouse where the final products are shipped to the customers.
Customer service was the first stop on the exposure agenda. The catalogue that the Schlumberger field organizations see is comprised of the standard configuration items that can be ordered for a set price. However, if the configuration desired is not represented or is slightly different, then the request is reviewed and a quote is presented showing the final cost of the item. The customer
service organization also acts as the bridge between the field organizations and the factory. Changes in status, expedited requests, coordination with production planners and delivery date updates are all communicated through this channel.
Once an order is finalized and sent to the facility, the order entry and review process starts the process of releasing work to the manufacturing facility. Orders are released after all required
engineering design changes have been completed. Once orders are released the customer service representative is responsible for keeping track of the status of that order for the field
organization. They are encouraged to go directly to the manufacturing engineers to obtain accurate up-to-date information on the status of the order. Once the order is complete the customer service representative also manages the shipping process in the sense that they ensure that all appropriate bills of lading and invoices are complete before releasing the order to be shipped. The process of order quoting encompasses the activities of obtaining the accurate price and delivery dates for orders that are not part of the standard catalogue. Most of the
modifications requested are in the form of "same as this part except..." so it is the quoting department's responsibility to classify and determine the cost and lead-time for these changes. Changes are classified into four numbered buckets where the first two buckets include minor changes to material or threads while the last two are for major design changes or a product that is so significantly different that it is considered a new product. Changes are sent to engineering, which then builds a representative bill of materials to reflect the changes and estimates the time
and cost for making those changes. Quotes are good for a specified period of time and the delivery date is re-confirmed once a firm order is placed. Manufacturing engineering and shop floor planning use the incoming orders to feed the manufacturing resource planning (MRP) system and to complete the initial shop scheduling. New orders are scrutinized to make the final decision on whether to make or buy specific components. The supply chain management is conducted at the buyer level.
The organization that oversees the planning, inventory, warehouse, supply chain and purchasing functions is the planning group. The main concerns at this level are to ensure adequate flexibility is maintained at the shop floor and supplier level through prudent make or buy decisions. Efforts are being made to reduce the part mix within each supplier. The scheduling tools used are based on the capacity of the manufacturing facility. Lead times for raw materials have been an area of increasing focus for this organization. With the rising costs of many exotic materials and the increasing lead-times, it has become more imperative to have accurate forecasts that allow the company to act proactively instead of reactively to control costs. This is not limited to the oilfield services sector as many other industries such as aerospace and even some high-end automotive products must also have more accurate forecasts.
Once the products have entered the manufacturing cycle, the liaison between manufacturing and the design engineers is the sustaining engineering group. This group is responsible for keeping the drawings up to date, correcting any errors and determining the manufacturability of the parts. Another directive for this group surrounds documenting the processes that are used, developing standard work instructions and analyzing new tooling and fixtures for installation in the factory. Under the purview of the sustaining group is a smaller group of people that build the precise bill of materials, create the machine routing instructions for the factory flow and write the computer numerical control (CNC) programs that are used to run the machines. An interesting interaction occurs when parts are moved from one machine to another machine with equivalent abilities. The activities in the planning organization effectively end their control of the schedules once the actual work orders are released to the shop floor and work begins on transforming metal into product.
Once past this point the production control group controls the scheduling of machines and the path of the product through the manufacturing process. The inspection group checks the parts for conformance to the engineering drawings during production. This organization has been
transitioning from a separate stand-alone area to one that is more integrated with the machine work areas. This should allow for inspection immediately after machining is complete and before moving onto the next stage of production. As a result, rework can be more effectively traced to
the source and actions can be taken to prevent the same error from reoccurring. The products that the Schlumberger Texas facility manufactures have very tight tolerances and much of the
inspection work that is done is moving from a manual process to one that utilizes coordinate measuring machines (CMM). These machines can more accurately determine if a part meets the drawing specifications. But while they can measure features more accurately than the drawings require, the extra data is useful in helping to improve process capability. The customer may be involved in quality checks for parts that have quality control plans (QCP) attached to them. QCPs identify quality control steps in the processing of the product. They are requirements such as witnessing of operations and documentation that are more detailed than the specifications and requirements that Schlumberger uses in their engineering definition of the parts. During this stage of production the parts are assembled and tested to ensure they meet all of the
requirements. Parts that have QCPs attached to them are held up during the assembly and testing operations to wait for a customer representative to arrive and witness that the assembly operation or test operation does meet the requirements specified in the drawing and assembly/ test
procedures.
Quality assurance differs from the inspection function in that they are responsible for putting together the book of data that serves as the documentation that all specifications and
requirements set forth in the drawing, bill of material and QCP have been met.
Several smaller groups support the rest of the manufacturing operations. The tool crib is
responsible for managing the inventory of consumable tools used on the CNC machines and the hand tools that are used in other operations as well as safety equipment and uniforms. The machine maintenance group has been embarking on a journey to transform to a total preventative
inventory. They have been making strides in writing preventative maintenance guides to help the operators keep their machines in shape.
The final stages of operations within the Texas facility are the warehouse and shipping functions which both reside in the warehouse. The niches that the employees fill characterize the work conducted here. The employees here are generally either very inexperienced or have over 6 years of service. The warehouse is located in a different building from the rest of the operations. The group has been trying to create an understanding for all employees of how the warehouse fits with and helps the other departments. They see their customer as the factory and work at improving how their operations affect the factory in terms of raw material issuing and management of scrap material.
In summary the author learned a great deal about the manufacturing processes that are used to produce these extremely high tolerance parts. The high quality work is completed successfully but not without intervention from many people.
The second location the author visited was a facility in Northern Ireland. The focus of the month on location was to develop a more detailed understanding of completed end item tools that are shipped to customers. This detailed understanding required research into the material, machining, processing, dimension, tolerance and quality requirements for many of the products
manufactured at the location. This was undertaken by producing a detailed listing of the machine types and supporting processes (e.g. heat treating, coating or thread cutting) required to
manufacture these parts.
This part of the author's orientation with the Schlumberger products, facilities and operations began the research that would help shape the definition of the location analysis tool that was the goal of the internship and this thesis. Using the premise that a new facility would be built and that the facility would produce products similar to the ones produced at the Texas and Northern Ireland facility, the author began research into the end item tools. Gathering a representative sample of end item tools that could be manufactured at a new facility was the first step. This was done by requesting product line owners to provide a list of their most popular products and having the internship project supervisor dictate that new products, still under development, would also be considered, resulting in a list of 10 new products that would be analyzed and 22 of
the most commonly ordered parts from another product line as the representative sample of parts to be considered for this new facility.
With a list of representative end item tools the next step was to gather the bill of material
information for those end items and all of the sub-assemblies and components that are contained in the end items. Relevant information from this analysis included the material types and sizes, the finishes, the thread types, the special processing requirements, the other miscellaneous processing requirements, and the machine routings. The machine routings indicate what type and
size of machine is required to perform the specific machining operations. Analysis of these machine requirements and estimates of the future demand for these products leads to an estimate
of the type and size of machines that would be required to be placed in a new factory. Once knowledge of the machines is obtained it is possible to determine approximate costs to outfit a
new facility. In addition the results indicate many of the types of suppliers that will need to be present or developed in the area surrounding any new facility. While this information is useful when conducting a qualitative analysis of several locations, the real benefit comes when it is time to build a capital asset request. Detailed financial information is essential to the validity of this request.
Learning about the existing facility processes, the different organizations they must interact with to successfully operate such a facility, the details of the components that make up the end item deliverable tools, and the areas for improvement, was a beneficial exercise to undertake before embarking on the research for developing a tool that will be used to analyze a potential future facility location. The knowledge gained indicated important areas to emphasize within the existing Schlumberger location analysis tools and areas that would need to be enhanced.
3.2.
Overarching Tool
Methodology
3.2.1. Tool Goals and Features
As outlined in Section 1.4 the scope of the tool to be created was not focused on generating a comprehensive list of criteria to be used in location analysis but instead was looking to create a standard methodology for applying the tool; a robust analysis that provided accurate results and
increased the features available within the tool. A summary of the major design goals and features appears in the table below.
Methodology Used to Tool Design Goal/Feature Reason for Goal/Feature Achieve Goal/Feature
Achieve Goal/Feature
Ensures that multiple 3 levels of involvement,
Ensures that multiple with each level "blind" to
Increase Objectivity stakeholders trust the process the results of the other
the results of the other
and results. levels.
levels.
* 2 levels of input are
adjustable, representing the
stakeholder views.
Enables discussion and
alteration of certain e Highest level of stakeholder
parameters to allow input can be used
independent of lower level
Adjustable Parameters stakeholders to view the results or used to weight
resulting changes to analysis results.
and reach consensus on the
* Risk profile can be adjusted to reflect current
stakeholder view of the effects of risk.
* Risk is associated with each
criteria
Enables decision makers to
see a more accurate picture of Independently determined
from the inputs of 2 levels
the range of possibilities for from the inputs of 2 levels
Quantified Risk locations and eliminates the o1 f stakeholder input (i.e.
risk is not decided upon by number comparison of
locations, any one individual)
* Risk profile is uniformly applied across all criteria. Ensures that location decisions
are made in a consistent
manner across the company * Standard work instructions
and that improvements to the integrated within the tool.
process are captured and used for future decisions.
* Eliminated calculation
Ensures that results are
deficiencies from previous
applicable to the situation deficiencies from previous
under consideration, that they tools.
Robust Calculations/ Analysis
reflect an accurate comparison* Applied calculation
methods that are widelyand that the results are accepted and make logical
accepted and make logical
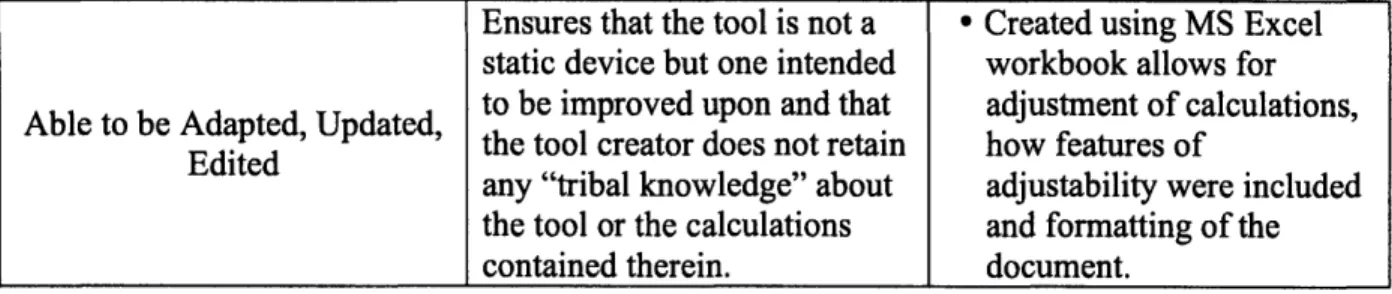
Ensures that the tool is not a * Created using MS Excel
static device but one intended workbook allows for
to be improved upon and that adjustment of calculations,
Able to be Adapted, Updated, the tool creator does not retain how features of Edited
any "tribal knowledge" about adjustability were included
the tool or the calculations and formatting of the
contained therein. document.
Table 1: Summary of Tool Design Goals/l Features
The outcome of achieving these design objectives and enhancing the features of the tool is that this tool becomes the objective basis by which discussions can occur to determine the optimal
location for a facility. By using the tool to eliminate unreasonable locations, a smaller subset of locations can be analyzed using a comprehensive cost analysis, forecasting the profit and loss of locations for final determination of facility location. Using this qualitative tool before conducting a detailed cost analysis eliminates unnecessary time and effort in gathering data on locations that will not prove optimal.
3.2.2. Notional Flow of Information and Involvement
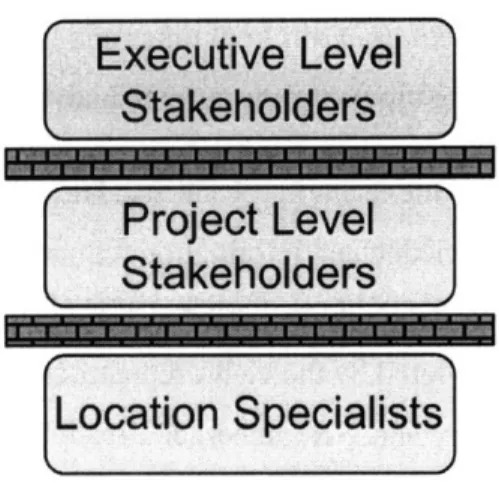
Three levels of involvement are required for use of the location analysis tool (see Figure 1). Each level has separate responsibilities and the results from each of the inputs are separated from each other. The inputs from one level are not visible to those inputting the next level of information. This separation increases the objectivity of the tool because users do not color their judgments or inputs based on what they see inputted by another level. Each level is also intended to have different variability.
Executive Level
Stakeholders
F
Project Level
Stakeholders
I
Location Specialists
Figure 1: Levels of Involvement Requiring Input
The executive level stakeholders are responsible for deciding on the strategic objectives. These executives (or equivalent) have the overarching view of the company strategy. They are aware of the current policies and external factors that are at work in the current environment and the overall product or service strategy. These views are the most static of the inputs. A firm view of the enterprise and the desired future state or architecture will mean that these views do not change dramatically over time. They are the same or similar irrespective of the project and locations under consideration.
While the views of the executive level stakeholders are the most static the project level stakeholders views will be more fluid. Each project will be taken on and viewed as a separate entity. The decision on where to locate a new research and development site compared to a new design center compared to a new manufacturing facility will drive different priorities. These priorities will be reflected in the setting of the importance rating for each criterion. Project level
stakeholders with their view of the process, organization, knowledge and information technology requirements as they relate to this specific endeavor will be the most appropriate people to determine the importance of each criterion to the success or failure of a project. While the inputs of the executive level stakeholders and the project level stakeholders are related through the categories that criterion are grouped within, it is important to keep visibility between the two inputs to a minimum. This allows the objectivity to increase through not allowing the importance ratings from project level stakeholders to be colored by the executive level strategic objectives. If it is not possible to have completely separate groups conduct the two evaluations, it is then
desirable to conduct the two evaluations at different times and especially important to not refer to previous analysis when formulating inputs for the current analysis.
The last level of input comes from the location specialists. These individuals are the ones responsible for gathering the knowledge and information required in order to rate the
attractiveness of each location for the individual criteria. It is even more important that at this level of input the results are not colored by the views represented in the project level stakeholder view. When considering locations where Schlumberger already has a presence, the task of gathering this information may become considerably easier since the locations experts can rely on those already conducting business in the location to provide information on how to rate a location. In locations were there is no company presence, the task becomes more difficult as location experts will need to gather information from similar industries, government or published sources and the level of confidence in the results is lessened.
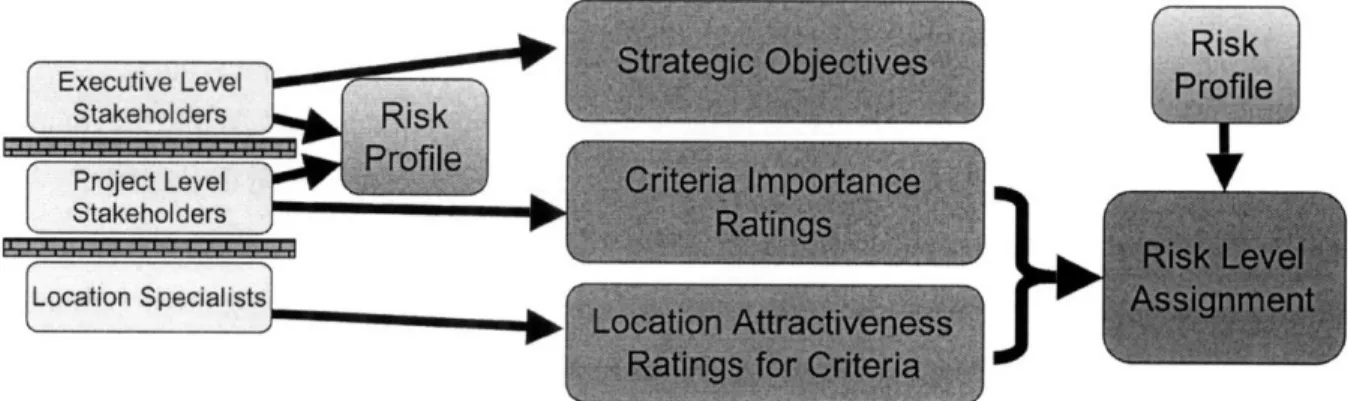
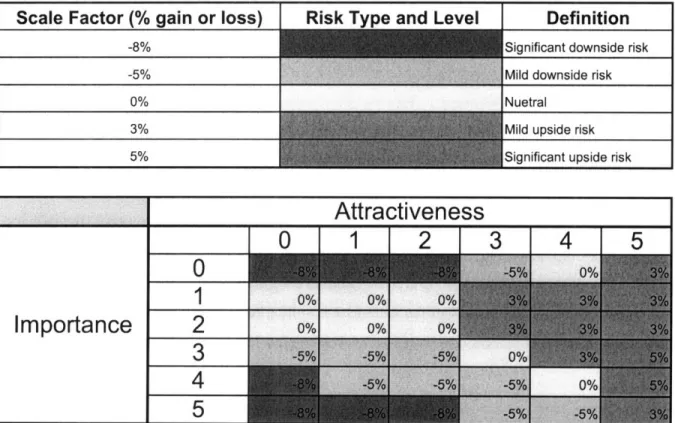
Information gathered from the three levels of involvement results in five data types, four of which are assumed to be independently determined and one set of data that is dependent on two other sets of data. While the risk profile is considered a set of independently entered data, it is not similar to the other three sets of independent data, as it is not newly considered for each project. Adjusting the risk profile is merely asking the stakeholders to verify that the assumptions indicated by the risk profile still hold true. Ideally the risk profile would not change for every project on which this tool is used, much like the strategic objectives section; it is looked at and modified only if the climate in which the tool is used is significantly different from previous occasions. See Figure 2 for a notional chart of the inputs and the resulting data.
Executive Level
Stakeholders Project Level StaKeholders Location Specialistsa
Figure 2: Data Resulting from Inputs -- owns
The executive level stakeholders and/or the project level stakeholders verify the risk profile. This verification is not an input of data as much as it is a verification and adjustment of the risk profile if conditions have changed sufficiently to warrant a change. The strategic objectives are a direct result of the executive level stakeholder inputs. The criteria importance ratings are a direct result of the project level stakeholder inputs. Finally, the location attractiveness ratings are a direct result of the location specialists input. The risk assignment level uses the concatenation of the importance and attractiveness ratings to look up and apply the appropriate risk profile level to each criteria. In this way the risk level associated with each criterion is not independently
assigned by one level of stakeholder but is the result of the combination of those independent assignments of rating. See Section 3.5 for a more in depth discussion of the risk profile.
3.3. Location Decision Matrix
The actual location decision matrix is contained within a MS Excel workbook as part of an integrated instruction, data gathering, analysis, and charting package. The relevant information from the workbook is summarized in the sections that follow.
3.3.1. Categories
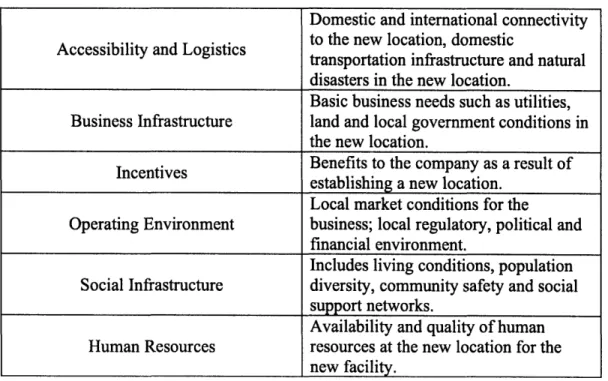
There are nine categories that encompass all of the criteria used as part of this tool, see Table 2 for a complete listing. As previously stated (see Section 1.4.1 for discussion) this is not a complete listing of all possible categories. Categories can and should be added as further research indicates other potentially valuable categories for consideration.
Category Description
One-time costs associated with
Costs - Start Up establishing operations in the new
location.
Costs associated with the location that
Costs - Ongoing will be continuous throughout the life of
the facility or that will depreciate over time.
Proximity, reliability and quality of
Neighboring Industries required suppliers and supporting
Domestic and international connectivity
Accessibility and Logistics to the new location, domestic
transportation infrastructure and natural disasters in the new location.
Basic business needs such as utilities,
Business Infrastructure land and local government conditions in
the new location.
Benefits to the company as a result of establishing a new location.
Local market conditions for the
Operating Environment business; local regulatory, political and
financial environment.
Includes living conditions, population
Social Infrastructure diversity, community safety and social
support networks.
Availability and quality of human
Human Resources resources at the new location for the
new facility.
Table 2: Categories Used in the Location Analysis Tool
Each of the categories represents a grouping of unique costs or characteristics that are important to consider in deciding on where to locate a new facility. Depending on the current situation for the company and the desired future architecture the relative importance of each of these
categories will vary. Even on a project specific level some of the criteria within each category will be more important and others less important.
3.3.2. Criteria
Within each category there are between five and 23 different criteria that pertain to that category. Each of the individual criteria is aimed at understanding a characteristic of the new location as it pertains to the planned facility expansion. Each criterion plays a role in determining the final score for that category and the overall score for the location. In addition, the ratings that each criterion receives for importance (project level decision) and attractiveness (location specialist decision) will be used to determine the level of risk. While it is acceptable for criteria to have unknown importance or attractiveness, the risk grows accordingly. It is important that new criteria are added as new characteristics or qualities for the facility location decision become apparent. Knowledge gained from each successive location decision should be incorporated into
the tool in the form of new criteria. See Appendix A for a listing of all criteria and their associated categories.
3.3.3. Use of
Importance
and Attractiveness Ratings
Each criteria is evaluated on two dimensions, with each evaluation being conducted by a different level of the decision making process. This dual evaluation process is conducted with each level of involvement not being able to see how the other completed the ratings. This is done for two reasons:
1) To ensure that multiple level of stakeholders have input into the decision making process.
2) To increase the objectivity of the tool and associated analysis.
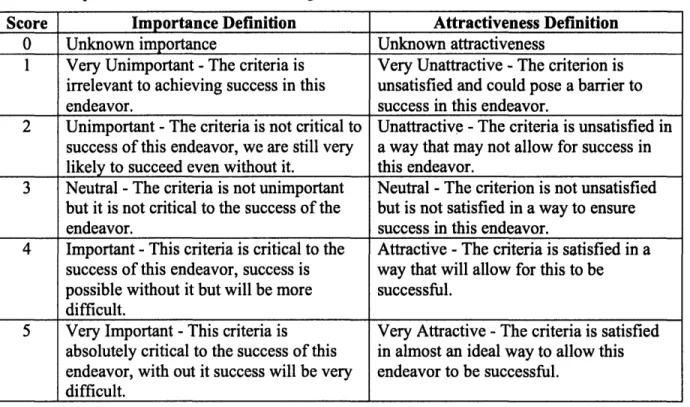
Both the importance and attractiveness ratings are on a 0-5 scale as shown below:
Score Importance Definition Attractiveness Definition
0 Unknown importance Unknown attractiveness
1 Very Unimportant -The criteria is Very Unattractive -The criterion is
irrelevant to achieving success in this unsatisfied and could pose a barrier to
endeavor. success in this endeavor.
2 Unimportant -The criteria is not critical to Unattractive -The criteria is unsatisfied in
success of this endeavor, we are still very a way that may not allow for success in
likely to succeed even without it. this endeavor.
3 Neutral -The criteria is not unimportant Neutral -The criterion is not unsatisfied
but it is not critical to the success of the but is not satisfied in a way to ensure
endeavor. success in this endeavor.
4 Important -This criteria is critical to the Attractive -The criteria is satisfied in a
success of this endeavor, success is way that will allow for this to be
possible without it but will be more successful.
difficult.
5 Very Important -This criteria is Very Attractive -The criteria is satisfied
absolutely critical to the success of this in almost an ideal way to allow this
endeavor, with out it success will be very endeavor to be successful.
difficult.
Table 3: Importance and Attractiveness Scale and Associated Definitions
Importance ratings are designed to give the project level stakeholders input into the facility location decision process by allowing them to rate the importance of each criterion to the success of the project. Project level stakeholders have the view of the project from a much higher level
than location experts. These individuals should understand the details of establishing a new facility and be aware of the areas that have caused problems with past projects. They are intimate with the intended use for the new facility and will make judgments as to how each criterion will affect the outcome. However the input of these project level stakeholders should not influence how each individual potential location is judged to satisfy each criterion. Deciding on the importance rating for each criterion in a group setting allows multiple project level stakeholders to have input into the decision process and also encourages dialogue between stakeholders to reach a consensus on how the criteria will affect the ultimate outcome. This helps to increase the objectivity of the tool by eliminating the perception that one person or group was making
unilateral decisions that will affect multiple groups.
Attractiveness ratings are designed to be completed by a group of people with experience in evaluating potential locations for possible facility expansion. These are people who are well connected throughout the organization. The job of rating each potential location for how
attractively it satisfies each criterion entails being able to pull information from multiple sources and make decisions as to how that information results in an attractiveness score. Ideally this group of people would work with existing groups or organizations within the company who are currently on location in the potential site to develop their attractiveness ratings. If the company has no existing presence in the potential location the task becomes more complicated as the location experts will now have to pull information from government or published sources as well as liaising with companies or organizations that currently do business in the location to gather information that will allow them to successfully complete the attractiveness ratings. The attractiveness ratings are the most subjective part of the analysis and as a result they play a smaller role in deciding the quantitative score that each location receives, however they play an equal role with importance in determining the risk level for each criteria.
3.3.4. How Ratings Determine the Final Score
The importance and attractiveness ratings for each criterion are used to determine the final score for each category and the total score for each location under consideration. After completion of the data collection each criteria has one importance rating and one attractiveness rating
location analysis tools used within the company multiplied the score by the weighting factor, a decimal value between zero and one, for each criterion. The resulting values for each criterion were summed to achieve the final score for that individual location. Weights did not vary across locations but scores did. This process is very similar to the process described within this thesis with importance substituting for weight and attractiveness substituting for score. However, the prior process had one deficiency in that items with high weight and low score contributed the same amount to the overall score as items with low weight and a high score. For example:
* Criteria A receives a weight of 1 (low) which is multiplied by the received score of 5 (high) and results in a contribution of 5
* Criteria B receives a weight of 5 (high) which is multiplied by the received score of 1 (low) and also results in a contribution of 5
The resulting contribution from both criteria to the total score is identical; however these two cases represent very different situations and should be distinguished from each other. Criteria A represents a situation in which the criteria is not very important for success of the project, however the location under consideration satisfies this criteria very well, receiving the highest score. While it is beneficial for the location to have scored well, this criterion is unimportant to the extent that it doesn't matter to the company what the rating is and that it shouldn't contribute very much to the overall score. In the second case criteria B represents a factor that has received the highest weight indicating that it is extremely important for the success of this project while the location does not satisfy this criterion at all, receiving the lowest score. This is a situation where a criterion was found to be of the utmost importance to the project and the location has scored terribly low, indicating that this is a situation that has the potential to cause problems for the ultimate success of the project and should be reflected as such in the overall score.
The goal is to keep the ratings system simple and easy for users to understand but this deficiency must be rectified. The path chosen by the author was to square the importance rating for each criterion before multiplying by the attractiveness score. This squaring of the importance rating now increases the influence of that criterion toward the final score for the category to a greater extent than the attractiveness rating. As the importance of a criterion increases from 1 to 5 it also gives those criterion with greater importance greater influence. If the two cases are examined again using this new algorithm:
* Criteria A receives a weight of 1 (low) which is squared and multiplied by the received score of 5 (high) and results in a contribution of 5
* Criteria B receives a weight of 5 (high) which is squared and multiplied by the received score of 1 (low) and results in a contribution of 25
Using this method for calculating the scores for each individual criterion, the result is 36
different possible combinations of the 0 to 5 importance scale and the 0 to 5 attractiveness scale. The highest possible score is 125 and the lowest possible score is 0.
Results for every criterion within a category are summed and then normalized, divided by the number of questions in the category, to allow for cross category comparison. This allows decision makers and stakeholders to look at the scores for each category and see which
categories represent assets to the project and which represent liabilities across the locations under consideration. The normalization of the categories can be toggled on or off within the tool in order to see the absolute scores for the category and aid in comparing locations on a category by category basis without the effects of normalization.
The final score for each location is the sum of the score for each category. This represents the total contribution of each criterion toward the final representation of the location. At this level the scores can be scaled with the results of the executive level stakeholder analysis. This allows the results of the executive level stakeholder analysis to influence the final results. Once again this is a feature that can be toggled'on or off within the tool. Toggling the feature on or off allows viewing of the raw scores and eliminates the reduction in variation caused through the scaling of the final scores. The executive stakeholder objectives indicate the relative weight or priority of each category, to overarching view of the company strategy, current policies and external factors that are at work in the current environment and the overall product or service strategy. These relative weights of the categories can be used in conjunction with the lower level analysis or as a stand-alone guidepost for informing final decisions.
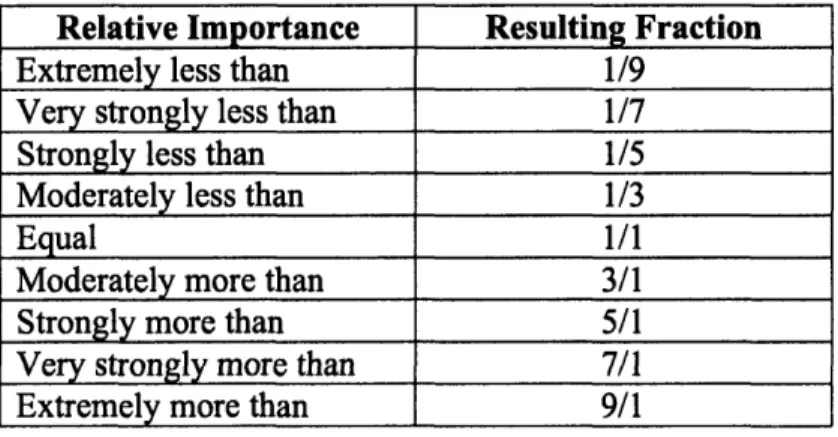
3.4.
Analytical Hierarchy Process
Analytical hierarchy process (AHP) is the process that is used to determine the relative weights of the categories. This weighting leads to a prioritization of the categories representing the