HAL Id: inserm-02473247
https://www.hal.inserm.fr/inserm-02473247
Submitted on 10 Feb 2020
HAL is a multi-disciplinary open access archive for the deposit and dissemination of sci-entific research documents, whether they are pub-lished or not. The documents may come from teaching and research institutions in France or abroad, or from public or private research centers.
L’archive ouverte pluridisciplinaire HAL, est destinée au dépôt et à la diffusion de documents scientifiques de niveau recherche, publiés ou non, émanant des établissements d’enseignement et de recherche français ou étrangers, des laboratoires publics ou privés.
CEA levels as biomarkers for the response of patients
with metastatic breast cancer to trastuzumab-based
therapies
Alexandre Perrier, Pierre-Yves Boëlle, Yves Chrétien, Joseph Gligorov,
Jean-Pierre Lotz, Didier Brault, Eva Comperat, Guillaume Lefèvre, Mathieu
Boissan
To cite this version:
Alexandre Perrier, Pierre-Yves Boëlle, Yves Chrétien, Joseph Gligorov, Jean-Pierre Lotz, et al.. An updated evaluation of serum sHER2, CA15.3, and CEA levels as biomarkers for the response of patients with metastatic breast cancer to trastuzumab-based therapies. PLoS ONE, Public Library of Science, 2020, 15 (1), pp.e0227356. �10.1371/journal.pone.0227356�. �inserm-02473247�
An updated evaluation of serum sHER2,
CA15.3, and CEA levels as biomarkers for the
response of patients with metastatic breast
cancer to trastuzumab-based therapies
Alexandre Perrier1, Pierre-Yves Boelle2, Yves Chre´tien3, Joseph Gligorov4, Jean-Pierre Lotz4, Didier Brault1, Eva Comperat5, Guillaume Lefèvre1, Mathieu Boissan
ID1,3* 1 Laboratoire de Biochimie et Hormonologie, Hoˆpital Tenon, Groupe Hospitalier Est Parisien, Assistance
Publique–Hoˆpitaux de Paris, Paris, France, 2 Sorbonne Universite´, INSERM, Institut Pierre Louis d’Epide´ miologie et de Sante´ Publique (IPLESP), Assistance Publique–Hoˆpitaux de Paris, Hoˆpital Saint-Antoine, Paris, France, 3 Centre de Recherche Saint-Saint-Antoine, INSERM, Sorbonne Universite´, Paris, France,
4 Service d’Oncologie Me´dicale, Institut Universitaire de Cance´ rologie APHP–Sorbonne Universite´, Paris, France, 5 Department of Pathology, Hoˆpital Tenon, Groupe Hospitalier Est Parisien, Assistance Publique Hoˆpitaux de Paris, Paris, France
*mathieu.boissan@inserm.fr
Abstract
Background
The transmembrane receptor tyrosine kinase HER2 is overexpressed in approximately 15% of breast tumors and correlates with poor clinical prognosis. Several treatments that target HER2 are approved for treatment of HER2-positive metastatic breast cancer. The serum biomarkers most widely used to monitor anti-HER2 therapies in patients with HER2-positive metastatic breast cancer currently are CA15.3 and CEA. Nevertheless, their clinical utility in patients with breast cancer remains a subject of discussion and controversy; thus, additional markers may prove useful in monitoring the therapeutic responses of these patients. The extracellular domain of HER2 can be shed by proteolytic cleavage into the circulation and this shed form, sHER2, is reported to be augmented during metastasis of HER2-positive breast tumors. Here, we studied the clinical usefulness of sHER2, CA15.3, and CEA for monitoring treatment for breast cancer.
Methods
We measured prospectively pretreatment and post-treatment serum levels (day 1, 30, 60 and 90) of these three biomarkers in 47 HER2-positive, metastatic breast cancer patients treated with trastuzumab in combination with paclitaxel. Evaluation of the disease was per-formed according to the Response Evaluation Criteria in Solid Tumor (RECIST) at day 90.
Results
Patients with progressive disease at day 90 had smaller relative changes between day 1 and day 30 than those with complete, partial or stable responses at day 90: -9% versus
a1111111111 a1111111111 a1111111111 a1111111111 a1111111111 OPEN ACCESS
Citation: Perrier A, Boelle P-Y, Chre´tien Y, Gligorov J, Lotz J-P, Brault D, et al. (2020) An updated evaluation of serum sHER2, CA15.3, and CEA levels as biomarkers for the response of patients with metastatic breast cancer to trastuzumab-based therapies. PLoS ONE 15(1): e0227356. https://doi.org/10.1371/journal.pone.0227356
Editor: Sandro Pasquali, Fondazione IRCCS Istituto Nazionale dei Tumori, ITALY
Received: May 4, 2019 Accepted: December 17, 2019 Published: January 7, 2020
Copyright:© 2020 Perrier et al. This is an open access article distributed under the terms of the Creative Commons Attribution License, which permits unrestricted use, distribution, and reproduction in any medium, provided the original author and source are credited.
Data Availability Statement: All relevant data are within the manuscript and its Supporting Information files.
Funding: The authors received no specific funding for this work.
Competing interests: The authors have declared that no competing interests exist.
Abbreviations: ASCO, American Society of Clinical Oncology; CA15.3, cancer antigen 15.3; CEA,
-38% for sHER2 (P = 0.02), +23% versus -17% for CA15.3 (P = 0.005) and +29% versus -26% for CEA (P = 0.02). Patients with progressive disease at day 90 were less likely than the other patients to have a relative decrease of>20% in their biomarker levels at day 30: 6% vs 33% for sHER2 (P = 0.03), 0% vs 27% for CA15.3 (P = 0.03), 4% vs 29% for CEA (P = 0.04). No patient with progressive disease at day 90 had>20% reduction of the average combined biomarker levels at day 30 whereas 63% of the other patients had (P = 0.003). Moreover, when we analyzed a>10% reduction of the average biomarker levels no patient with progressive disease at day 90 had a decrease>10% at day 30 whereas 78% of other patients had (P<0.001, Se = 100%, Sp = 78%).
Conclusion
We show that regular measurement of sHER2, CA15.3, and CEA levels is useful for predict-ing the therapeutic response and for monitorpredict-ing HER2-targeted therapy in patients with HER2-positive metastatic breast cancer. The average decrease of the three biomarkers with a threshold of>10% appears to be the best parameter to distinguish patients who go on to have progressive disease from those who will have a complete, partial or stable response.
Introduction
Breast cancer is the most frequent cancer in women; over a million new cases are diagnosed per year worldwide and thus this is an important health issue [1]. The transmembrane receptor tyrosine kinase HER2 (human epidermal growth factor receptor 2) is overexpressed in approx-imately 15% of breast tumors [2], and this overexpression is linked to poor clinical prognosis and disease progression [3]. Determination of HER2 status has become a necessary step in breast cancer diagnosis that is important not only for the prognosis but also for the choice of therapy. HER2 protein expression is most commonly measured in routine practice by immu-nohistochemistry. HER2-positive breast cancers respond to anti-HER2 treatments, particu-larly to monoclonal antibodies such as trastuzumab, which have significantly improved the prognosis for patients with non-metastatic and metastatic disease [4,5].
The serum markers used most widely to predict clinical response to trastuzumab-based anti-HER2 therapy (i.e. trastuzumab alone or associated with adjuvant chemotherapy, such as
paclitaxel) in patients with HER2-positive metastatic breast cancer are cancer antigen 15.3 (CA15.3) and carcinoembryonic antigen (CEA). Among the various tools used to assess the efficacy of a new therapy, the serum tumor markers CEA and CA15.3 are still a subject of dis-cussion and controversy [6,7]. Several studies have suggested that elevated serum levels of CA15.3 and CEA at the time of diagnosis are significantly associated with tumor size, axillary node metastasis and advanced stage in breast cancer patients [6;8–10]. Others have found that, in addition, breast cancer patients with elevated CA15.3 and CEA levels have a poorer prognosis than those with normal levels of these markers [9–12]. Also, some studies suggest that CEA and CA15.3 may be useful as biomarkers to predict the therapeutic response in advanced breast cancer patients [12–15]. Nevertheless, the American Society of Clinical Oncology (ASCO) guidelines do not recommend use of CEA and CA15.3 alone for monitor-ing the response of breast cancer to treatment; they do, however, consider that these biomark-ers may be used as adjunct assessments in the choice of therapy for metastatic breast cancer
carcinoembryonic antigen; ECD, extracellular domain; ER, estrogen receptor; PR, progesterone receptor; sHER2, soluble human epidermal growth factor receptor 2..
[16]. ASCO also notes that CEA and CA15.3 levels should be interpreted with caution during the first 4–6 weeks of administration of a new therapy because spurious increases may occur [16]. This may be due, in part, to conflicting conclusions reached by different researchers, but also to the fact that the serum of breast cancer patients is often not positive for these biomark-ers or that they are not sensitive enough to detect the disease [7,17]. Thus, other markers may prove useful in monitoring the therapeutic response of breast cancer patients [18].
In contrast to CEA and CA15.3, sHER2 is poorly documented as a biomarker for breast cancer although it is promising [18]. During HER2-positive breast cancer progression, tumor cells shed the extracellular domain (ECD) of HER2 by proteolytic cleavage [19], and this shed-ding is reported to be augmented during disease recurrence and metastasis [20–23]. Accord-ingly, the p105 kDa ECD or soluble HER2 (sHER2) can be detected in the circulation. High sHER2 levels pretreatment are reported to be significantly associated with an aggressive clin-ico-pathological phenotype [24]. Patients with decreased levels after receiving trastuzumab (with or without adjuvant chemotherapy) were found to be more likely to have a higher response rate and longer disease-free survival [20,25–31]. In several studies of metastatic breast cancer, no clear relationship was found between baseline sHER2 levels and tumor response to trastuzumab-based treatment [32–34], whereas other studies have found a rela-tionship [20,31]; thus, no definitive conclusions can be drawn. Currently, ASCO does not rec-ommend using sHER2 as a biomarker for the response to trastuzumab-based treatment because the evidence is too weak. There is only limited and controversial information regard-ing the usefulness of sHER2 to predict benefit from trastuzumab-based treatment in metastatic breast cancer patients. The current lack of a clear conclusion or consensus about this may be due to the use of various assays (commercial or home-made tests), different cut-off values, het-erogeneity of the tumors, small numbers of patients investigated, short follow-up periods, and differences in the threshold and/or variation considered clinically significant. Nevertheless, the combination of several tumor markers, such as CA15.3, CEA and sHER2, might enhance the sensitivity for detection of metastatic breast cancer [35–37].
In this study, we set out to investigate whether the use of sHER2, CA15.3, and CEA would allow us to predict and to evaluate the responses of metastatic breast cancer patients to trastu-zumab-based therapy. The innovative aspect of this study is the combined analysis of these three biomarkers to enhance the sensitivity for prediction of progressive disease and to dis-criminate between patients with progressive disease and other patients.
Material and methods
Study design and patients
Forty-seven patients with HER2-positive (level 3+ by immunohistochemistry or 2+ by immu-nohistochemistry associated with positive fluorescencein situ hybridization) first line
meta-static breast cancer were recruited for a prospective evaluation of CEA, CA15-3 and sHER2 on treatment response prediction. In this study, we included patients with metastases who had not previously been treated and patients with metastases who had previously received treat-ment for their primary tumors. All the patients had been treated with a combination of trastu-zumab (4 mg/kg on week 1, followed by 2 mg/kg/week) and paclitaxel (175 mg/m2every 3 weeks or 80 mg/m2/weekly, 6 weeks/8) until progression or unacceptable toxicity. Evaluation of the disease was performed according to the Response Evaluation Criteria in Solid Tumor (RECIST). Inclusion criteria for these patients (IC) were: first line metastatic breast cancer measurable according to RECIST or not measurable (bone metastases, isolated pleural effu-sion) (IC 1), performance index (WHO) � 2 (IC 2), life expectancy � 3 months (IC 3), overex-pression of HER2 (level 3+ by immunohistochemistry or 2+ by immunohistochemistry
associated with positive FISH) (IC4), normal heart function (IC 5), polymorphonuclear neutrophils � 1.5x10⁹/L (IC6), platelets � 100x109/L (IC 7), bilirubin � 1.25N (IC 8), transaminases � 2.5N (5N in case of liver metastases) (IC 9), alkaline phosphatases � 2.5N (5N in case of liver metastases) (IC10), contraception if of childbearing age (IC 11). Exclusion criteria (EC) were: death (EC 1), cardiac pathology with left ventricular ejection < 50% at base-line (EC 2), oxygen-dependent lung disease (EC 3), antecedent of any other cancer exceptin situ carcinoma of the cervix (EC 4), symptomatic brain metastases (EC 5), adjuvant herceptin
treatment (EC 6), toxicity and allergy related to paclitaxel (EC 7), free interval � 12 months since a neoadjuvant treatment involving a taxane (EC 8), possibility of being treated with anthracyclines (EC 9), no relapse or progressive recovery following last treatment with anthra-cyclines (EC 10), positive HIV serology (EC 11), another condition preventing follow-up of the patient (EC 12). Written informed consent was obtained from the participants. The study protocol was approved by the Comite´ Consultatif De Protection des Personnes Dans La Recherche Biome´dicale (CCPPRB PARIS-COCHIN; approval number Am2761-9-1878). All patients were recruited prospectively in Tenon Hospital (Groupe Hospitalier Est Parisien, Assistance Publique–Hoˆpitaux de Paris, Paris, France) between 2001 and 2005.
Measurement of serum CEA and CA15.3
Serum levels of CEA and CA15.3 were measured by a chemiluminescent micro-particle immu-noassay on ARCHITECT ci 8200 (ABBOTT1). The CA 15–3 assay values were defined by using the 115D8 and DF3 monoclonal antibodies supplied by ABBOTT1[38–40]. Monoclo-nal antibody 115D8 raised against human milk-fat globule membranes, and monocloMonoclo-nal anti-body DF3 raised against a membrane enriched fraction of metastatic human breast carcinoma, react with epitopes expressed by a family of high molecular weight glycoproteins designated as polymorphic epithelial mucins (PEMs) [41–44]. The anti-CEA assay used antibodies raised in guinea pig and goat and conjugated to peroxidase supplied by ABBOTT1. Both anti-CEA antibodies were raised against CEA purified from a colon cancer in tissue culture [41]. The approved threshold values were � 30 U/mL for CA15.3, and � 5 ng/mL for CEA. We collected blood samples for these two biomarkers at day 1, 30, 60 and 90.
Measurement of serum extracellular domain of HER2
The ADVIA1Centaur HER2 assay (SIEMENS1) is a fully automated, two-site sandwich immunoassay using direct chemiluminescent technology [45–47]. The Lite Reagent is com-posed of the monoclonal mouse antibody TA-1 labeled with acridinium ester. The Fluorescein Conjugate Reagent is composed of the monoclonal mouse antibody NB-3 labeled with fluores-cein. These two monoclonal antibodies are specific for unique epitopes on the ECD of HER2. The solid phase is composed of purified anti-fluorescein monoclonal mouse capture antibody, which is covalently coupled to paramagnetic particles. The sample is incubated with Fluores-cein Conjugate Reagent and Lite Reagent simultaneously for 5.5 minutes. After this incuba-tion, the solid phase is added, and the mixture is incubated for an additional 2.75 minutes. After this final incubation, the immuno-complex formed is washed with water prior to initia-tion of the chemiluminescent reacinitia-tion. The approved threshold value was � 15 ng/mL. We collected blood samples for this biomarker at day 1, 30, 60 and 90.
Immunohistochemistry
Breast tumor samples were fixed in formalin and embedded in paraffin blocks. Four-microme-ter sections were cut then deparaffinized and rehydrated. Immunohistochemistry was per-formed by using a rabbit monoclonal antibody (clone 4B5; Ventana/Roche1) as the primary
antibody and the modified streptavidin–biotin peroxidase method with diaminobenzidine as a chromogen. HER2 status was assessed only on primary tumors by performing immunohis-tochemistry. The IHC results identify three HER2 scores: 0 and 1+ scores with 10% cells with low and incomplete intensity labeling; score 2+ with at least 10% labeled cells with low or mod-erate but complete intensity labeling; score 3+ with more than 30% labeled cells with a strong and complete intensity labeling. 2+ scores are also referred to as ‘equivocal cases’ and include cases with heterogeneous HER2 overexpression. Only, the carcinomas with a 2+ score were analyzed for HER2 gene status byin situ hybridization. Positive controls with breast tumors
constantly overexpressing HER2 and negative controls without antibody application were sys-tematically performed.
Statistical analyses
The changes in biomarker levels over time were analyzed statistically by applying the Wilcoxon signed rank and McNemar’s test (for changes in biomarker levels in the same individual) or the Mann–Whitney–Wilcoxon test and Fisher’s exact test (to compare changes in biomarker levels of patients with progressive diseaseversus those of patients with a complete, partial, or
stable response). We also performed diagnostic statistics. For all tests, a P value <0.05 was con-sidered as significant. Statistical analyses and figures were performed with the R1software version 3.5.2.
Results
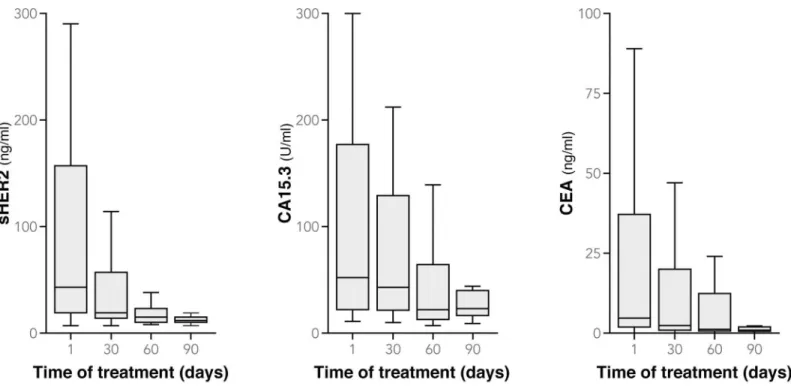
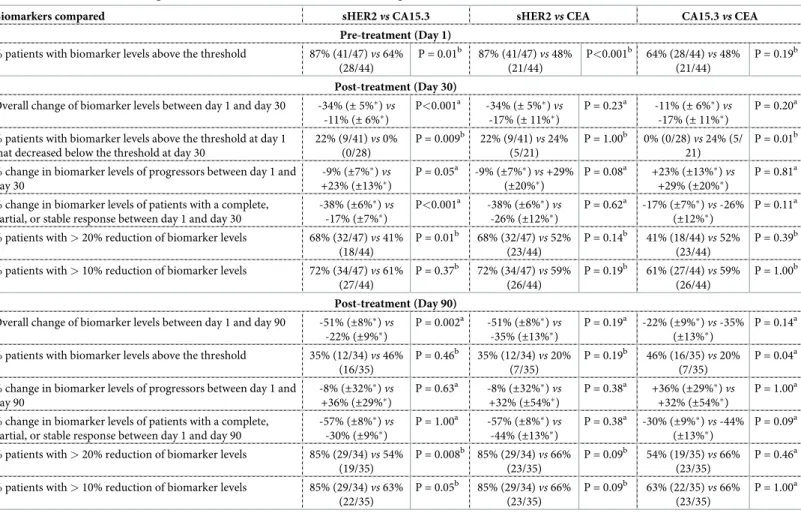
Patient and tumor characteristics at the diagnosis are detailed inTable 1. On day 1, the median value of sHER2 in our patient sample was 34 [range 7–4180] ng/mL, CA15.3 was 52 [range 11–2850] U/mL, and CEA was 4.6 [range 0–910] ng/mL (Fig 1); 87% of patients (41/47) had sHER2 levels � 15 ng/mL, 64% (28/44) had CA15.3 � 30 U/mL and 48% (21/44) had CEA � 5 ng/mL (Table 2). We compared the three biomarker levels (Table 3) and observed that at day 1 patients with HER2-postive metastatic breast cancer were more often above the threshold for sHER2 than they were for CA15.3 (P = 0.01) and CEA (P<0.001), whereas no statistically significant differences were seen between the proportion of patients with CA15.3 and CEA levels above the threshold (P = 0.19). The therapeutic response was evaluated at day 90 according to the Response Evaluation Criteria in Solid Tumors (RECIST). At this time, 27 patients had partially (24 patients) or completely responded to treatment (3 patients), 13 had stable disease and 7 had progressive disease.
We evaluated the kinetics of change in the three biomarker levels (sHER2, CA15.3 and CEA) at day 1, 30, 60 and 90 in the different therapeutic response groups (Fig 2) Between day 1 and day 30 of treatment, we observed an average decrease of 34% in serum levels of sHER2 (P<0.001), 11% in CA15.3 (P = 0.02) and 17% in CEA (P = 0.03) (Fig 1;Table 2). sHER2 levels decreased more than those of CA15.3 (P<0.001), but not more than CEA (P = 0.23), and no differences were found between CA15.3 and CEA (P = 0.20). All patients with an initial serum biomarker level below the threshold remained so on day 30 (except one patient with progres-sive disease whose CEA levels rose above the threshold); those with an initial serum biomarker level above the threshold had decreased below the threshold on day 30 in 22% (9/41) of the cases for sHER2, 0% (0/28) for CA15.3 and 24% (5/21) for CEA. The results were significantly different when sHER2 was compared with CA15.3 (P = 0.009) and when CA15.3 was com-pared with CEA (P = 0.01), but not when sHER2 was comcom-pared with CEA (P = 1.00).
Patients with progressive disease at day 90 had smaller relative changes between day 1 and day 30 than those with complete, partial or stable responses at day 90: -9% versus -38% for sHER2 (P = 0.02), +23% versus -17% for CA15.3 (P = 0.005) and +29% versus -26% for CEA
(P = 0.02) (Fig 3). We observed a decrease of biomarker levels in patients with complete, par-tial or stable responses for sHER2, CA15.3 and CEA (Fig 2). Mean values of patients with com-plete response were below threshold from the first day until day 90 for CA15.3 and CEA (Fig 2). This was also the case for patients with partial response for CEA (Fig 2). The sHER2 levels in patients with a complete, partial or stable response decreased more than CA15.3 levels (P<0.001) but not significantly more than CEA (P = 0.62). In patients with progressive disease, we also observed a tendency of sHER2 to decrease more than CA15.3 (P = 0.05). We saw no significant difference between patients with progressive disease at day 90 and the other patients when we analyzed serum biomarker levels above the threshold at day 30: 86% (6/7) versus 65% (26/40) for HER2 (P = 0.40), 71% (5/7) versus 32% (12/37) for CEA (P = 0.09) and 71% (5/7) versus 62% (23/37) for CA15.3 (P = 1.00). The small number of patients with progressive dis-ease limits the statistical power of these comparisons.
Patients with progressive disease at day 90 were less likely than the other patients to have a relative decrease of > 20% in their biomarker levels at day 30. For sHER2 (n = 47), 68% (32/ 47) of all patients’ serum levels decreased by > 20%, among which only 6% (2/32) had progres-sive disease; among the 15 patients whose serum levels decreased by < 20%, by contrast, 33%
Table 1. Patient and tumor characteristics.
Characteristics of the 47 breast metastatic breast cancer patients
Number of patients 47 Age (years) Average (range) 56 (26–75) Median (SD) 58 (9.96) <45 years (%) 7 (14.9%) � 45 to <55 years (%) 10 (21.3%) � 55 years (%) 30 (63.8%) Menopause status
Number of menopausal patients (%) 40 (85.1%)
Average (range) 51 (42–59) Median (SD) 51 (3.64) Predictive factors Progesterone Receptor + (%) 15 (31.9%) Estrogen Receptor + (%) 19 (40.4%) HER2+ (%) 47 (100%) HER2+ 3+ (%) 42 (89.4%) HER2+ 2+ ISH+ (%) 5 (10.6%)
Hormone replacement therapy (%) 14 (29.8%)
Metastasis
Average number of sites per patients (range) 1.93 (1–4) Number of patients with liver metastasis (%) 22 (46.8%) Number of patients with bone metastasis (%) 17 (36.2%) Number of patients with lung metastasis (%) 11 (23.4%) Number of patients with cutaneous metastasis (%) 6 (12.8%) Number of patients with other(s) location(s) (%) 10 (21.3%) Therapeutic response at day 90 (according to RECIST)
Complete response (%) 3 (6.4%)
Partial response (%) 24 (51.1%)
Stable (%) 13 (27.7%)
Progression (%) 7 (14.9%)
(5/15) had progressive disease (P = 0.03), (Se = 71%, Sp = 75%,Table 4). For CA15.3 (n = 44), 41% (18/44) of all patients’ serum levels decreased by > 20%, among which none (0/18) had progressive disease; among the 26 patients whose serum levels decreased by < 20%, 27% (7/ 26) had progressive disease (P = 0.03), (Se = 100%, Sp = 49%). For CEA (n = 44), 52% (23/44) of all patients’ serum levels decreased by > 20%, among which 4% (1/23) had progressive dis-ease; among the 21 patients whose serum levels decreased by < 20%, 29% (6/21) had progres-sive disease (P = 0.04), (Se = 86%, Sp = 59%). We obtained similar results when we analyzed the patients that had a relative decrease of > 10% in their biomarker levels at day 30. We found that more patients had a reduction of > 20% when sHER2 was used as a biomarker instead of CA15.3 (P = 0.01) and we observed no differences between sHER2 and CEA (P = 0.14) and between CA15.3 and CEA (P = 0.39). When we applied a threshold of > 10% reduction, no differences were noticed. Despite the low number of patients with progressive disease, we observed that they had a significantly smaller decrease in the three biomarker levels than had the other patients at day 30.
We calculated the relative change in biomarker levels between day 1 and day 90 in all patients. The mean serum level of sHER2 in all patients decreased by 51% (P<0.001), that of CA15.3 by 22% (P = 0.01) and of CEA by 35% (P = 0.001) (Fig 1;Table 2). Levels of sHER2 decreased more than CA15.3 (P = 0.002) but not in comparison with CEA (P = 0.19), and no differences were found between CA15.3 and CEA (P = 0.14). At day 90, 35% of patients had levels of sHER2 � 15 ng/mL, 46% had levels of CA15.3 � 30 U/mL and 20% had levels of CEA � 5 ng/mL, compared with 87% (P<0.001), 64% (P = 0.07) and 48% (P = 0.03) respec-tively, at day 1. More patients had CA15.3 levels above the threshold than had CEA levels above the threshold (P = 0.04), whereas no differences were seen between the other biomark-ers. Patients with progressive disease had much smaller changes than the other patients between day 1 and day 90: -8% versus -57% for sHER2 (P = 0.08), +36% versus -30% for
Fig 1. Boxplots of sHER2, CA15.3 and CEA levels at day 1, 30, 60 and day 90 (extreme values of biomarker levels are not represented but are included in the statistical analysis).
CA15.3 (P = 0.04) and +32% versus -44% for CEA (P = 0.04) (Fig 3). Similar biomarker level changes were seen in patients with progressive disease when we compared sHER2 to CA15.3 (P = 0.63), sHER2 to CEA (P = 0.38), and CA15.3 to CEA (P = 1.00) between day 1 and day 90. That was also the case for patients with a complete, partial or stable response: comparing sHER2 to CA15.3 (P = 1.00), sHER2 to CEA (P = 0.38), and CA15.3 to CEA (P = 0.09). Mean values of patients with no progressive disease have decreased below threshold at day 90 for sHER2 and CEA, not for CA15.3 (Fig 3). Considering all the patients, however, more had a > 20% reduction in sHER2 levels with between day 1 and day 90 than had a > 20% reduction in CA15.3 levels (P = 0.008); this held true also when a > 10% reduction in sHER2 and CA15.3 levels was analyzed (P = 0.05). In light of these data from day 30 and day 90 of treatment, we suggest that sHER2, and to a lesser degree CEA, levels are a little more sensitive to clinical changes than are CA15.3 levels.
Table 2. Statistical analysis of changes in individual biomarker levels (sHER2, CA15.3 and CEA) over time (Day 1, 30 and 90) and according to the therapeutic response to treatment of HER2-positive metastatic breast cancer patients with a combination of trastuzumab and paclitaxel.
Biomarker sHER2 CA15.3 CEA
Threshold � 15 ng/mL � 30 U/mL � 5 ng/mL
Pre-treatment (Day 1)
Median value [Range] 34 ng/mL [7–4180] 52 U/mL [11–
2850]
4.6 ng/mL [0– 910] % patients with biomarker levels above the threshold 87% (41/47) 64% (28/44) 48% (21/44)
Post-treatment (Day 30) Overall change of biomarker levels between day 1 and day 30 -34% (± 5%�) P<0.001a
-11% (± 6%�) P = 0.02a
-17% (± 11%�) P = 0.03a
% patients with biomarker levels above the threshold at day 1 decreasing below the threshold at day 30
22% (9/41) 0% (0/28) 24% (5/21)
% change in biomarker levels of progressorsvs those of patients
with a complete, partial, or stable response between day 1 and day 30 -9% (±7%�)vs -38% (±6%�) P = 0.02b +23% (±13%�)vs -17% (±7%�) P = 0.005b +29% (±20%�)vs -26% (±12%�) P = 0.02b
% progressors with biomarker levels above the threshold at day 30
vs patients with a complete, partial or stable response
86% (6/ 7)vs 65% (26/40) P = 0.40c 71% (5/7)vs 62% (23/37) P = 1.00c 71% (5/7)vs 32% (12/37) P = 0.09c
% patients with > 20% reduction of biomarker levels 68% (32/47) 41% (18/44) 52% (23/44) % progressors among patients with > 20% reduction of biomarker
levelsvs % progressors among patients with < 20% reduction of
biomarker levels 6% (2/32)vs 33% (5/15) P = 0.03c 0% (0/18) vs 27% (7/26) P = 0.03c 4% (1/23) vs 29% (6/21) P = 0.04c
% patients with > 10% reduction of biomarker levels 72% (34/47) 61% (27/44) 59% (26/44) % progressors in patients with > 10% reduction of biomarker levels
vs % progressors in patients with < 10% reduction of biomarker
levels 6% (2/34)vs 38% (5/13) P = 0.01c 4% (1/27) vs 35% (6/17) P = 0.01c 8% (2/26) vs 28% (5/18) P = 0.10c Post-treatment (Day 90) Overall change of biomarker levels between day 1 and day 90 -51% (±8%�) P<0.001a
-22% (±9%�) P = 0.01a
-35% (±13%�) P = 0.001a
% patients with biomarker levels above the threshold (P-value for comparison to day 1)
35% (12/34) P<0.001d 46% (16/35) P = 0.07d 20% (7/35) P = 0.03d
% change in biomarker levels of progressorsvs those of patients
with a complete, partial, or stable response between day 1 and day 90 -8% (±32%�)vs -57% (±8%�) P = 0.08b +36% (±29%�) vs -30% (±9%�) P = 0.04b +32% (±54%�)vs -44% (±13%�) P = 0.04b
a: Wilcoxon signed rank test b: Mann–Whitney–Wilcoxon test c: Fisher’s exact test
d: McNemar’s test
�: Standard error of the mean
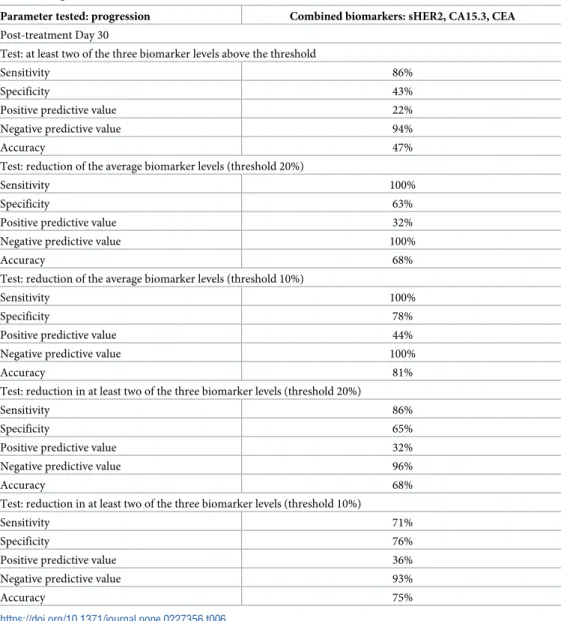
Finally, we investigated whether a combination of the three tumor biomarkers together (CA15.3, CEA and sHER2) might enhance the sensitivity of detection of progressive disease (Table 5andTable 6). Seventy-five percent (33/44) of all patients were above the threshold for at least two of the three biomarkers at day 1. The average change in the three biomarker levels in all patients between day 1 and day 30 was -22% (P<0.001). Patients with progressive disease at day 90 had a smaller relative average change in the three biomarkers between day 1 and day 30 than had the other patients: +14% versus -27% (P<0.001). Eighty-six percent (6/7) of patients with progressive disease had at least two of the three biomarker levels above the threshold at day 30 compared to 57% (21/37) of the other patients (P = 0.22). Fifty-three per-cent (25/47) of all patients had a > 20% reduction of the average biomarker levels at day 30 and 66% (31/47) had a reduction of > 10%. Combination of the three biomarkers appears to permit better discrimination between patients with progressive disease and other patients. For instance, no patient (0/7) with progressive disease at day 90 had > 20% reduction of the aver-age biomarker levels at day 30 whereas 63% (25/40) of the other patients had (P = 0.003), (Se = 100%, Sp = 63%, PPV = 32%, NPV = 100%, Accuracy = 68%) (Fig 4andTable 6). More-over, when we analyzed a > 10% reduction of the average biomarker levels: no patient (0/7)
Table 3. Comparison of biomarker levels (sHER2, CA15.3 and CEA) over time (Day 1, 30 and 90) and according to the therapeutic response to treatment of HER2--positive metastatic breast cancer patients with a combination of trastuzumab and paclitaxel.
Biomarkers compared sHER2vs CA15.3 sHER2vs CEA CA15.3vs CEA
Pre-treatment (Day 1) % patients with biomarker levels above the threshold 87% (41/47)vs 64%
(28/44) P = 0.01b 87% (41/47)vs 48% (21/44) P<0.001b 64% (28/44)vs 48% (21/44) P = 0.19b Post-treatment (Day 30) Overall change of biomarker levels between day 1 and day 30 -34% (± 5%�)vs
-11% (± 6%�) P<0.001a -34% (± 5%�)vs -17% (± 11%�) P = 0.23a -11% (± 6%�)vs -17% (± 11%�) P = 0.20a
% patients with biomarker levels above the threshold at day 1 that decreased below the threshold at day 30
22% (9/41)vs 0% (0/28) P = 0.009b 22% (9/41)vs 24% (5/21) P = 1.00b 0% (0/28)vs 24% (5/ 21) P = 0.01b
% change in biomarker levels of progressors between day 1 and day 30 -9% (±7%�)vs +23% (±13%�) P = 0.05a -9% (±7%�)vs +29% (±20%�) P = 0.08a +23% (±13%�)vs +29% (±20%�) P = 0.81a
% change in biomarker levels of patients with a complete, partial, or stable response between day 1 and day 30
-38% (±6%�)vs -17% (±7%�) P<0.001a -38% (±6%�)vs -26% (±12%�) P = 0.62a -17% (±7%�)vs -26% (±12%�) P = 0.11a
% patients with > 20% reduction of biomarker levels 68% (32/47)vs 41%
(18/44) P = 0.01b 68% (32/47)vs 52% (23/44) P = 0.14b 41% (18/44)vs 52% (23/44) P = 0.39b
% patients with > 10% reduction of biomarker levels 72% (34/47)vs 61%
(27/44) P = 0.37b 72% (34/47)vs 59% (26/44) P = 0.19b 61% (27/44)vs 59% (26/44) P = 1.00b Post-treatment (Day 90) Overall change of biomarker levels between day 1 and day 90 -51% (±8%�)vs
-22% (±9%�) P = 0.002a -51% (±8%�)vs -35% (±13%�) P = 0.19a -22% (±9%�)vs -35% (±13%�) P = 0.14a
% patients with biomarker levels above the threshold 35% (12/34)vs 46%
(16/35) P = 0.46b 35% (12/34) vs 20% (7/35) P = 0.19b 46% (16/35) vs 20% (7/35) P = 0.04a
% change in biomarker levels of progressors between day 1 and day 90 -8% (±32%�)vs +36% (±29%�) P = 0.63a -8% (±32%�)vs +32% (±54%�) P = 0.38a +36% (±29%�)vs +32% (±54%�) P = 1.00a
% change in biomarker levels of patients with a complete, partial, or stable response between day 1 and day 90
-57% (±8%�)vs -30% (±9%�) P = 1.00a -57% (±8%�)vs -44% (±13%�) P = 0.38a -30% (±9%�)vs -44% (±13%�) P = 0.09a
% patients with > 20% reduction of biomarker levels 85% (29/34)vs 54%
(19/35) P = 0.008b 85% (29/34) vs 66% (23/35) P = 0.09b 54% (19/35) vs 66% (23/35) P = 0.46a
% patients with > 10% reduction of biomarker levels 85% (29/34)vs 63%
(22/35) P = 0.05b 85% (29/34) vs 66% (23/35) P = 0.09b 63% (22/35) vs 66% (23/35) P = 1.00a
a: Wilcoxon signed rank test b: Fisher’s exact test
�: Standard error of the mean
Fig 2. Kinetics of biomarker levels (sHER2, CA 15.3, CEA) over time (at day 1, 30, 60 and 90) in the different therapeutic response groups (patients with a complete, partial or stable response and patients with progressive disease), based on RECIST criteria at day 90.
Fig 3. Kinetics of biomarker levels (sHER2, CA 15.3, CEA) over time (at day 1, 30, 60 and 90) in patients with progressive disease versus patients with no progressive disease (patients with a complete, partial or stable response), based on RECIST criteria at day 90.
with progressive disease at day 90 had a decrease > 10% at day 30 whereas 78% (31/40) of other patients had (P<0.001) (Fig 4). We observed with this threshold an increase of specificity and positive predictive value without sensitivity and negative predictive value decreasing (Se = 100%, Sp = 78%, PPV = 44%, NPV = 100%, Accuracy = 81%) (Table 6). When we ana-lyzed a reduction of > 20% in levels of at least two of the three biomarkers, we also found a sig-nificant difference between patients with progressive disease and others: 14% (1/7) versus 65% (25/40) (P = 0.03). Similar results were found by analyzing a reduction of > 10% in levels of at least two of the three biomarkers: 29% (2/7) of patients with progressive disease versus 76% (28/37) of other patients (P = 0.03).
Considering all the data above, the best parameter for use in clinical practice seems to be the average decrease of the three biomarkers. At day 90, the average change of the three bio-marker levels was -36% (P<0.001). At day 90, 32% (11/34) of patients had at least two of the three biomarker levels above the threshold compared with 75% (33/44) at day 1 (P = 0.001). Between day 1 and day 90, patients with progressive disease had smaller relative changes in the average biomarker levels than had the other patients: +20% versus -44% (P = 0.04).
Discussion
In this prospective study, we aimed to find a combination of biomarkers that would identify patients who are likely to respond to trastuzumab-based therapies. In terms of individual markers, we find that a large decrease (either of >10% or of >20%) in any of the three bio-markers we evaluated–sHER2, CEA and CA15.3 –in the first month of treatment is a strong indicator against disease progression in metastatic breast cancer patients treated with a combi-nation of trastuzumab and paclitaxel. Moreover, levels of sHER2 and CEA seem to be generally more sensitive indicators of clinical change than are levels of CA15.3. One of the strengths of this study, however, is its unusual use of a combined analysis of three biomarkers. We find that this combination can enhance the ability to discriminate between patients with progressive
Table 4. Diagnostic statistics of the three biomarker levels (sHER2, CA15.3 and CEA) for detecting progression. Parameter tested: progressive disease sHER2 CA15-3 ACE Post-treatment Day 30
Test: Biomarker levels above the threshold
Sensitivity 86% 71% 71%
Specificity 35% 38% 68%
Positive predictive value 19% 18% 29%
Negative predictive value 93% 88% 88%
Accuracy 43% 40% 64%
Test: reduction of biomarker levels (threshold 20%)
Sensitivity 71% 100% 86%
Specificity 75% 49% 59%
Positive predictive value 33% 27% 29%
Negative predictive value 94% 100% 96%
Accuracy 74% 57% 64%
Test: reduction of biomarker levels (threshold 10%)
Sensitivity 71% 86% 71%
Specificity 80% 74% 65%
Positive predictive value 38% 35% 28%
Negative predictive value 94% 96% 92%
Accuracy 79% 73% 66%
disease and patients with a complete, partial or stable response. The best parameter seems to be the average decrease of the three biomarkers. Analyzing the kinetics of change in the levels of the three biomarkers appears to be more useful than analyzing actual biomarker levels with respect to a fixed threshold level when distinguishing between patients with progressive disease and other patients. By applying a threshold of >10% or >20% reduction of average biomarker levels, we can very robustly identify patients who are likely to respond to treatment.
When we performed diagnostic statistics based on detection of progressive disease, we obtained a sensitivity of 100% and a negative predictive value of 100% with a threshold of > 10% or > 20% reduction of the average biomarker levels. There were no false negatives (i.e. patients with progressive disease but a decrease greater than the threshold of > 10% or > 20%). The very high negative predictive value is particularly useful in clinical practice: patients with a decrease of > 10% or > 20% are probably not going to have progressive disease. The specificity and especially the positive predictive value were low, however. Thus, a patient
Table 5. Statistical analysis of changes in combined biomarker levels (sHER2, CA15.3 and CEA) over time (Day 1, 30 and 90) and according to the therapeutic response to treatment of HER2-positive metastatic breast cancer patients with a combination of trastuzumab and paclitaxel.
Pre-treatment (Day 1)
% patients with at least two of the three biomarker levels above the threshold 75% (33/44) Post-treatment (Day 30)
Mean change in the three biomarker levels between day 1 and day 30 -22% (± 5%�) P<0.001a
Mean change in the three biomarker levels in progressors between day 1 and day 30vs that in patients with a complete, partial, or stable response
+14% (±12%�)vs -27%
(±4%�)
P<0.001b
% progressors with at least two of the three biomarker levels above the threshold at day 30vs the % of patients with a complete, partial, or stable
response with at least two of the three biomarker levels above the threshold at day 30
86% (6/7)vs 57% (21/
37)
P = 0.22c
% patients with > 20% reduction of the average biomarker levels 53% (25/47) % progressors with > 20% reduction of the average biomarker levelsvs % of
patients with a complete, partial, or stable response with > 20% reduction of the average biomarker levels
0% (0/7)vs 63% (25/40) P = 0.003c
% progressors with > 20% reduction in at least two of the three biomarker levelsvs % of patients with a complete, partial, or stable response with > 20%
reduction in at least two of the three biomarker levels
14% (1/7)vs 65% (24/
37)
P = 0.03c
% patients with > 10% reduction of the average biomarker levels 66% (31/47) % progressors with > 10% reduction in the average biomarker levelsvs % of
patients with a complete, partial, or stable response with > 10% reduction in the average biomarker levels
0% (0/7)vs 78% (31/40) P<0.001c
% progressors with > 10% reduction in at least two of the three biomarker levelsvs % of patients with a complete, partial, or stable response with > 10%
reduction in at least two of the three biomarker levels
29% (2/7)vs 76% (28/
37)
P = 0.03c
Post-treatment (Day 90)
Mean change in the three biomarker levels between day 1 and day 90 -36% (±6%�) P<0.001a
% patients with at least two of the three biomarker levels above the threshold (P-value for comparison to day 1)
32% (11/34) P = 0.001d
Mean change in the three biomarker levels in progressors between day 1 and day 90vs patients with a complete, partial, or stable response
+20% (±22%�)vs -44%
(±6%�)
P = 0.04b
a: Wilcoxon signed rank test b: Mann–Whitney–Wilcoxon test c: Fisher’s exact test
d: McNemar’s test
�: Standard error of the mean
with < 10% or < 20% decrease of the three combined biomarker levels is not necessarily a patient with progressive disease. The threshold of > 10% average decrease of biomarker levels seems to be more useful than the threshold of > 20% to distinguish patients with progressive disease from other patients because the specificity and the positive predictive value are higher at the > 10% threshold than at the > 20% threshold and the sensitivity and the negative pre-dictive value are also high; thus, there is a reduction of the number of false positives (i.e. patients with no progressive disease but a decrease of average biomarker levels < 10%).
The main limitation of our study is the small number of patients with progressive disease (7 patients in the cohort of 47), which limits the statistical significance of the observed average decrease of sHER2 levels in patients with progressive disease. Thus, we cannot draw strong conclusions from this study, but we can develop hypotheses for future validation. The difficul-ties involved in calculating changes in combined biomarker levels in clinical practice may prove an impediment to the application of the method. To overcome this problem, we plan to develop a free, online tool to facilitate the calculation. Another potential limitation of the study is that the therapeutic response was evaluated only at day 90. Thus, we cannot be certain that
Table 6. Diagnostic statistics of combined biomarker levels (sHER2, CA15.3 and CEA).
Parameter tested: progression Combined biomarkers: sHER2, CA15.3, CEA Post-treatment Day 30
Test: at least two of the three biomarker levels above the threshold
Sensitivity 86%
Specificity 43%
Positive predictive value 22%
Negative predictive value 94%
Accuracy 47%
Test: reduction of the average biomarker levels (threshold 20%)
Sensitivity 100%
Specificity 63%
Positive predictive value 32%
Negative predictive value 100%
Accuracy 68%
Test: reduction of the average biomarker levels (threshold 10%)
Sensitivity 100%
Specificity 78%
Positive predictive value 44%
Negative predictive value 100%
Accuracy 81%
Test: reduction in at least two of the three biomarker levels (threshold 20%)
Sensitivity 86%
Specificity 65%
Positive predictive value 32%
Negative predictive value 96%
Accuracy 68%
Test: reduction in at least two of the three biomarker levels (threshold 10%)
Sensitivity 71%
Specificity 76%
Positive predictive value 36%
Negative predictive value 93%
Accuracy 75%
some patients who were classified as stable or as responders at day 90 did not have progressive disease at day 60 or day 30 or, vice versa, that some patients progressed tardily, so were stable or responders at day 30 or day 60 but were classified as having progressive disease at day 90. Despite these limitations, this study indicates that sHER2, CA15.3 and CEA may together be useful as an adjunct tool for predicting progressive disease in the first-line treatment of HER2--positive metastatic breast cancer patients. We need a validation group to determine whether the findings obtained are generally applicable. So, we plan to conduct a multi-center prospec-tive study with a large cohort to confirm these results.
Conclusion
We conclude that early measurement of sHER2, CA15.3, and CEA levels in serum can be informative about the eventual outcome for metastatic breast cancer patients treated with a combination of trastuzumab and paclitaxel: among those with a large decrease (> 10%) in bio-marker levels in the first month of treatment, few patients go on to have progressive disease. Hence, serial measurements of sHER2, CA15.3, and CEA over the course of treatment may prove useful for monitoring HER2-targeted therapies and predicting disease progression. Combined analysis of the three biomarker levels allows a more accurate interpretation of bio-marker kinetics and permits better discrimination between patients with progressive disease and patients with a complete, partial or stable response than does a simple analysis of any one of the biomarkers. Levels of sHER2 and CEA seem to be more sensitive indicators of clinical changes than are levels of CA15.3 in some situations. The average decrease of the three bio-markers with a threshold of > 10% appears to be the best parameter to distinguish patients with progressive disease from other patients. Although the sample size was small, this pilot study provides useful and encouraging information to design multi-center prospective studies that would evaluate further the prognostic value of measuring serum concentrations of sHER2, CA15.3, and CEA as markers of responses to trastuzumab-based treatments.
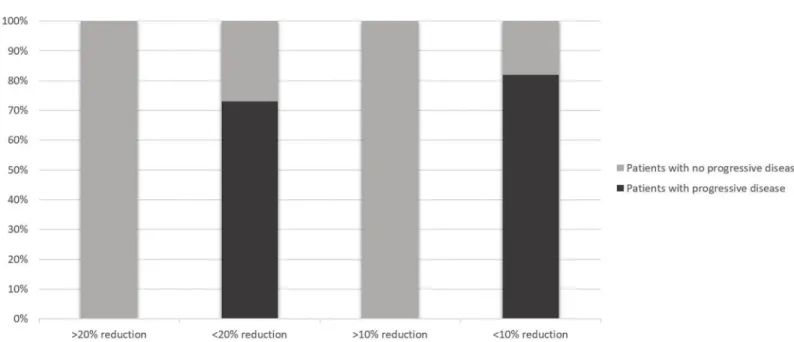
Fig 4. The proportion of patients who at day 30 have a > or < 20% reduction in their average biomarker level, or a > or < 10% reduction in their average biomarker level and who go on to have progressive disease (according to RECIST criteria) at day 90 (black shading) or to have no progressive disease (i.e. a complete, partial or stable response; grey shading).
Supporting information
S1 Dataset.
(XLSX)
Acknowledgments
The authors acknowledge Dr. Carol Featherstone at Plume Scientific Communication Services SAS for professional editing of the manuscript.
Author Contributions
Conceptualization: Alexandre Perrier, Didier Brault.
Data curation: Alexandre Perrier, Pierre-Yves Boelle, Yves Chre´tien, Mathieu Boissan. Formal analysis: Alexandre Perrier, Pierre-Yves Boelle, Yves Chre´tien.
Investigation: Joseph Gligorov, Jean-Pierre Lotz, Didier Brault, Guillaume Lefèvre, Mathieu Boissan.
Methodology: Alexandre Perrier, Pierre-Yves Boelle, Eva Comperat, Mathieu Boissan. Software: Yves Chre´tien.
Supervision: Joseph Gligorov, Jean-Pierre Lotz, Guillaume Lefèvre, Mathieu Boissan.
Validation: Alexandre Perrier.
Visualization: Alexandre Perrier, Eva Comperat.
Writing – original draft: Alexandre Perrier, Mathieu Boissan.
Writing – review & editing: Alexandre Perrier, Joseph Gligorov, Jean-Pierre Lotz, Didier
Brault, Eva Comperat, Guillaume Lefèvre, Mathieu Boissan.
References
1. Siegel RL, Miller KD, Jemal A. Cancer statistics, 2016. CA Cancer J Clin. 2016 Feb; 66(1):7–30.https:// doi.org/10.3322/caac.21332PMID:26742998
2. Shah MV, Wiktor AE, Meyer RG, Tenner KS, Ballman KV, Green SJ, et al. Change in Pattern of HER2 Fluorescent in Situ Hybridization (FISH) Results in Breast Cancers Submitted for FISH Testing: Experi-ence of a ReferExperi-ence Laboratory Using US Food and Drug Administration Criteria and American Society of Clinical Oncology and College of American Pathologists Guidelines. J Clin Oncol. 2016 Oct 10; 34 (29):3502–10.https://doi.org/10.1200/JCO.2015.61.8983PMID:27458302
3. Slamon DJ, Clark GM, Wong SG et al. Human breast cancer: Correlation of relapse and survival with amplification of the HER-2/neu oncogene. Science 1987; 235:177–182.https://doi.org/10.1126/ science.3798106PMID:3798106
4. Romond EH, Perez EA, Bryant J et al. Trastuzumab plus adjuvant chemotherapy for operable HER2-positive breast cancer. N Engl J Med 2005; 353:1673–1684.https://doi.org/10.1056/NEJMoa052122
PMID:16236738
5. Swain SM, Baselga J, Kim S-B, Ro J, Semiglazov V, Campone M, et al. Pertuzumab, trastuzumab, and docetaxel in HER2-positive metastatic breast cancer. N Engl J Med. 2015 Feb 19; 372(8):724–34.
https://doi.org/10.1056/NEJMoa1413513PMID:25693012
6. Molina R, Auge JM, Farrus B, Zano´n G, Pahisa J, Muñoz M, et al. Prospective evaluation of carcinoem-bryonic antigen (CEA) and carbohydrate antigen 15.3 (CA 15.3) in patients with primary locoregional breast cancer. Clin Chem. 2010 Jul; 56(7):1148–57.https://doi.org/10.1373/clinchem.2009.135566
PMID:20472825
7. Duffy MJ. Serum tumor markers in breast cancer: are they of clinical value? Clin Chem. 2006 Mar; 52 (3):345–51.https://doi.org/10.1373/clinchem.2005.059832PMID:16410341
8. Wu S-G, He Z-Y, Ren H-Y, Yang L-C, Sun J-Y, Li F-Y, et al. Use of CEA and CA15-3 to Predict Axillary Lymph Node Metastasis in Patients with Breast Cancer. J Cancer. 2016 Jan 1; 7(1):37–41.https://doi. org/10.7150/jca.13090PMID:26722358
9. Park B-W, Oh J-W, Kim J-H, Park SH, Kim K-S, Kim JH, et al. Preoperative CA 15–3 and CEA serum levels as predictor for breast cancer outcomes. Ann Oncol. 2008 Apr; 19(4):675–81.https://doi.org/10. 1093/annonc/mdm538PMID:18037623
10. Lee J. S., Park S., Park J. M., Cho J. H., Kim S. I., and Park B.-W. “Elevated Levels of Preoperative CA 15–3 and CEA Serum Levels Have Independently Poor Prognostic Significance in Breast Cancer.” Annals of Oncology: Official Journal of the European Society for Medical Oncology 24, no. 5 (May 2013): 1225–31.
11. Di Gioia D, Dresse M, Mayr D, Nagel D, Heinemann V, Stieber P. Serum HER2 in combination with CA 15–3 as a parameter for prognosis in patients with early breast cancer. Clin Chim Acta. 2015 Feb 2; 440:16–22.https://doi.org/10.1016/j.cca.2014.11.001PMID:25444743
12. Yang Y, Zhang H, Zhang M, Meng Q, Cai L, Zhang Q. Elevation of serum CEA and CA15-3 levels dur-ing antitumor therapy predicts poor therapeutic response in advanced breast cancer patients. Oncol Lett. 2017 Dec; 14(6):7549–56.https://doi.org/10.3892/ol.2017.7164PMID:29344201
13. Robertson JF, Jaeger W, Syzmendera JJ, Selby C, Coleman R, Howell A, et al. The objective measure-ment of remission and progression in metastatic breast cancer by use of serum tumour markers. Euro-pean Group for Serum Tumour Markers in Breast Cancer. Eur J Cancer. 1999 Jan; 35(1):47–53.
https://doi.org/10.1016/s0959-8049(98)00297-4PMID:10211087
14. Kurebayashi J, Nishimura R, Tanaka K, Kohno N, Kurosumi M, Moriya T, et al. Significance of serum tumor markers in monitoring advanced breast cancer patients treated with systemic therapy: a prospec-tive study. Breast Cancer. 2004; 11(4):389–95.https://doi.org/10.1007/bf02968047PMID:15604995
15. Dixon AR, Jackson L, Chan SY, Badley RA, Blamey RW. Continuous chemotherapy in responsive met-astatic breast cancer: a role for tumour markers? Br J Cancer. 1993 Jul; 68(1):181–5.https://doi.org/10. 1038/bjc.1993.310PMID:8318411
16. Van Poznak C, Somerfield MR, Bast RC, Cristofanilli M, Goetz MP, Gonzalez-Angulo AM, et al. Use of Biomarkers to Guide Decisions on Systemic Therapy for Women With Metastatic Breast Cancer: Amer-ican Society of Clinical Oncology Clinical Practice Guideline. J Clin Oncol. 2015 Aug 20; 33(24):2695– 704.https://doi.org/10.1200/JCO.2015.61.1459PMID:26195705
17. Di Gioia D, Heinemann V, Nagel D, Untch M, Kahlert S, Bauerfeind I, et al. Kinetics of CEA and CA15-3 correlate with treatment response in patients undergoing chemotherapy for metastatic breast cancer (MBC). Tumour Biol. 2011 Aug; 32(4):777–85.https://doi.org/10.1007/s13277-011-0180-7PMID:
21553235
18. Perrier A, Gligorov J, Lefèvre G, Boissan M. The extracellular domain of Her2 in serum as a biomarker of breast cancer. Lab Invest. 2018 Jun; 98(6):696–707.https://doi.org/10.1038/s41374-018-0033-8
PMID:29491426
19. Christianson TA, Doherty JK, Lin YJ, Ramsey EE, Holmes R, Keenan EJ, et al. NH2-terminally trun-cated HER-2/neu protein: relationship with shedding of the extracellular domain and with prognostic fac-tors in breast cancer. Cancer Res. 1998 Nov 15; 58(22):5123–9. PMID:9823322
20. Reix N, Malina C, Chenard M-P, Bellocq J-P, Delpous S, Molière S, et al. A prospective study to assess the clinical utility of serum HER2 extracellular domain in breast cancer with HER2 overexpression. Breast Cancer Res Treat. 2016; 160(2):249–59.https://doi.org/10.1007/s10549-016-4000-zPMID:
27709352
21. Lam L, McAndrew N, Yee M, Fu T, Tchou JC, Zhang H. Challenges in the clinical utility of the serum test for HER2 ECD. Biochim Biophys Acta. 2012 Aug; 1826(1):199–208.https://doi.org/10.1016/j. bbcan.2012.03.012PMID:22521738
22. Tse´ C, Gauchez A-S, Jacot W, Lamy P-J. HER2 shedding and serum HER2 extracellular domain: biol-ogy and clinical utility in breast cancer. Cancer Treat Rev. 2012 Apr; 38(2):133–42.https://doi.org/10. 1016/j.ctrv.2011.03.008PMID:21549508
23. Carney WP, Bernhardt D, Jasani B. Circulating HER2 Extracellular Domain: A Specific and Quantitative Biomarker of Prognostic Value in all Breast Cancer Patients? Biomark Cancer. 2013 Aug 12; 5:31–9.
https://doi.org/10.4137/BIC.S12389PMID:24179396
24. Sandri MT, Johansson H, Colleoni M, Zorzino L, Passerini R, Orlando L, et al. Serum levels of HER2 ECD can determine the response rate to low dose oral cyclophosphamide and methotrexate in patients with advanced stage breast carcinoma. Anticancer Res. 2004 Apr; 24(2C):1261–6. PMID:15154657
25. Moreno-Aspitia A, Hillman DW, Dyar SH, Tenner KS, Gralow J, Kaufman PA, et al. Soluble HER2 (sHER2) levels in HER2-positive breast cancer patients receiving chemotherapy±trastuzumab: Results from the NCCTG adjuvant trial N9831. Cancer. 2013 Aug 1; 119(15):2675–82.https://doi.org/ 10.1002/cncr.28130PMID:23744760
26. Lee HJ, Seo AN, Kim EJ, Jang MH, Suh KJ, Ryu HS, et al. HER2 heterogeneity affects trastuzumab responses and survival in patients with HER2-positive metastatic breast cancer. Am J Clin Pathol. 2014 Dec; 142(6):755–66.https://doi.org/10.1309/AJCPIRL4GUVGK3YXPMID:25389328
27. Tchou J, Lam L, Li YR, Edwards C, Ky B, Zhang H. Monitoring serum HER2 levels in breast cancer patients. Springerplus. 2015; 4:237.https://doi.org/10.1186/s40064-015-1015-6PMID:26069876
28. Wang T, Zhou J, Zhang S, Bian L, Hu H, Xu C, et al. Meaningful interpretation of serum HER2 ECD lev-els requires clear patient clinical background, and serves several functions in the efficient management of breast cancer patients. Clin Chim Acta. 2016 Jul 1; 458:23–9.https://doi.org/10.1016/j.cca.2016.04. 025PMID:27109901
29. Ali SM, Leitzel K, Lipton A, Carney WP, Ko¨stler WJ. Value of serum human epidermal growth factor receptor 2 (HER2)/neu testing for early prediction of response to HER2/neu-directed therapies is still an open one and deserves further study in large prospective trials. J Clin Oncol. 2009 Dec 20; 27(36): e273; author reply e274-275.https://doi.org/10.1200/JCO.2009.23.4674PMID:19917836
30. Fornier MN, Seidman AD, Schwartz MK, Ghani F, Thiel R, Norton L, et al. Serum HER2 extracellular domain in metastatic breast cancer patients treated with weekly trastuzumab and paclitaxel: association with HER2 status by immunohistochemistry and fluorescence in situ hybridization and with response rate. Ann Oncol. 2005 Feb; 16(2):234–9.https://doi.org/10.1093/annonc/mdi059PMID:15668276
31. Lee CK, Davies L, Gebski VJ, Lord SJ, Di Leo A, Johnston S, et al. Serum Human Epidermal Growth Factor 2 Extracellular Domain as a Predictive Biomarker for Lapatinib Treatment Efficacy in Patients With Advanced Breast Cancer. J Clin Oncol. 2016 Mar 20; 34(9):936–44.https://doi.org/10.1200/JCO. 2015.62.4767PMID:26811533
32. Leary AF, Hanna WM, van de Vijver MJ, Penault-Llorca F, Ru¨schoff J, Osamura RY, et al. Value and limitations of measuring HER-2 extracellular domain in the serum of breast cancer patients. J Clin Oncol. 2009 Apr 1; 27(10):1694–705.https://doi.org/10.1200/JCO.2008.17.3989PMID:19255333
33. Lennon S, Barton C, Banken L, Gianni L, Marty M, Baselga J, et al. Utility of serum HER2 extracellular domain assessment in clinical decision making: pooled analysis of four trials of trastuzumab in meta-static breast cancer. J Clin Oncol. 2009 Apr 1; 27(10):1685–93.https://doi.org/10.1200/JCO.2008.16. 8351PMID:19255335
34. Leyland-Jones B, Smith BR. Serum HER2 testing in patients with HER2-positive breast cancer: the death knell tolls. Lancet Oncol. 2011 Mar; 12(3):286–95.https://doi.org/10.1016/S1470-2045(10) 70297-7PMID:21376291
35. Pedersen AC, Sørensen PD, Jacobsen EH, Madsen JS, Brandslund I. Sensitivity of CA 15–3, CEA and serum HER2 in the early detection of recurrence of breast cancer. Clin Chem Lab Med. 2013 Jul; 51 (7):1511–9.https://doi.org/10.1515/cclm-2012-0488PMID:23403727
36. Mariani L, Miceli R, Michilin S, Gion M. Serial determination of CEA and CA 15.3 in breast cancer fol-low-up: an assessment of their diagnostic accuracy for the detection of tumour recurrences. Biomark-ers. 2009 Mar; 14(2):130–6.https://doi.org/10.1080/13547500902770090PMID:19330591
37. Stieber P, Nagel D, Blankenburg I, Heinemann V, Untch M, Bauerfeind I, et al. Diagnostic efficacy of CA 15–3 and CEA in the early detection of metastatic breast cancer-A retrospective analysis of kinetics on 743 breast cancer patients. Clin Chim Acta. 2015 Aug 25; 448:228–31.https://doi.org/10.1016/j.cca. 2015.06.022PMID:26160053
38. Hayes DF, Zurawski VR, Kufe DW. Comparison of circulating CA15-3 and carcinoembryonic antigen levels in patients with breast cancer. J Clin Oncol. 1986 Oct; 4(10):1542–50.https://doi.org/10.1200/ JCO.1986.4.10.1542PMID:2428949
39. Tobias R, Rothwell C, Wagner J, et al. Development and Evaluation of a Radioimmunoassay for the Detection of a Monoclonal Antibody Defined Breast Tumor Associated Antigen 115D8/DF3. Clin Chem 1985; 31:986.
40. Hilkens J, Buijs F, Hilgers J, Hageman P, Calafat J, Sonnenberg A, et al. Monoclonal antibodies against human milk-fat globule membranes detecting differentiation antigens of the mammary gland and its tumors. Int J Cancer. 1984 Aug 15; 34(2):197–206.https://doi.org/10.1002/ijc.2910340210PMID:
6206003
41. Hilkens J, Hilgers J, Buijs F, et al. Monoclonal Antibodies Against Human Milk-Fat Globule Membranes Useful in Carcinoma Research. Prot Biol Fluids 1984; 31:1013–1016.
42. Kufe D, Inghirami G, Abe M, Hayes D, Justi-Wheeler H, Schlom J. Differential reactivity of a novel monoclonal antibody (DF3) with human malignant versus benign breast tumors. Hybridoma. 1984; 3 (3):223–32.https://doi.org/10.1089/hyb.1984.3.223PMID:6094338
43. Taylor-Papadimitriou J, Gendler S. Molecular Aspects of Mucins. Cancer Rev 1988; 11–12:11–24.
44. Fleisher M., Nisselbaum J. S., Loftin L., Smith C., and Schwartz M. K. “Roche RIA and Abbott EIA Carci-noembryonic Antigen Assays Compared.” Clinical Chemistry 30, no. 2 (February 1984): 200–205. PMID:6362912
45. Payne RC, Allard JW, Anderson-Mauser L, et al. Automated assay for HER-2/neu in serum. Clin Chem. 2000; 46:175–182. PMID:10657373
46. Luftner D, Cheli C, Mickelson K, Sampson E, Possinger K. ADVIA Centaur HER-2/neu shows value in monitoring patients with metastatic breast cancer. Int J Biol Markers. 2004; 19:175–182. PMID:
15503818
47. Esteva FJ, Cheli CD, Fritsche H, Fornier M, Slamon D, Thiel RP, et al. Clinical utility of serum HER2/ neu in monitoring and prediction of progression-free survival in metastatic breast cancer patients treated with trastuzumab-based therapies. Breast Cancer Res. 2005; 7(4):R436–43.https://doi.org/10.1186/ bcr1020PMID:15987448