APPROACHES FOR THE METABOLIC ENGINEERING OF
MICROORGANISMS
by Hal Alper
B.S., Chemical Engineering
University of Maryland, College Park, 2002 Submitted to the Department of Chemical Engineering in Partial Fulfillment of the Requirements for the Degree of
Doctor of Philosophy in Chemical Engineering at the
Massachusetts Institute of Technology June 2006
© 2006 Massachusetts Institute of Technology All rights reserved
ARCHIVES
Signature of Author ... ...
Hal Alper Department of Chemical Engineering April 3, 2006
Certified by
Certified
...by
...
XY~.
~~~...
Cetiie
/
Gregory StephanopoulosProfessor of Chemical Engineering Thesis Supervisor
Accepted
by ...
...
William Deen Professor of Chemical Engineering Chairman, Committee for Graduate StudentsMASSACHUSETTS INSTTE OF TECHNOLOGY
JUN 16 2006
LIBRARIES
-DEVELOPMENT OF SYSTEMATIC AND COMBINATORIAL
APPROACHES FOR THE METABOLIC ENGINEERING OF
MICROORGANISMS
byHal Alper
Submitted to the Department of Chemical Engineering on April 3, 2006 in Partial Fulfillment of the Requirements for the Degree of
Doctor of Philosophy in Chemical Engineering
Abstract
Explorations and optimizations through the genomic space are a daunting
undertaking given the complexity and size of the possible search space. To approach this problem, systematic and combinatorial approaches were employed for the engineering of cellular phenotype in Escherichia coli. Initially, a computational method based on global cellular stoichiometry was employed to identify single and multiple gene knockout targets for lycopene production in E. coli. These targets led to substantial increases in lycopene production, but were limited in scope due to the nature of these models.
Therefore, these approaches and targets were complemented with combinatorial searches to identify unknown and regulatory targets. When combined, these searches led to further increases of lycopene production and allowed for the visualization of the resulting metabolic landscape. A more exhaustive search was conducted in the background of eight genotypes which resulted in the formulation of the gene knockout search network. This network enables the investigation into how phenotype optimization is biased by search strategy. Collectively, these results demonstrated that despite the complexity and nonlinearity of genotype-phenotype spaces, most of the significant phenotypes were controlled and regulated by a small subset of key "gateway" nodes. Often, the mutations and genotypes incurred in altering global cellular phenotypes are not necessarily additive and can be quite non-linear.
Effective probing of a metabolic landscape requires not only gene deletions, but also the varying (or tuning) of expression level for a gene of interest. Through promoter engineering, a library of promoters of varying strength were obtained through
mutagenesis of a constitutive promoter. A multi-faceted characterization of the library, especially at the single-cell level to ensure homogeneity, permitted quantitative
assessment correlating the effect of gene expression levels to improved growth and product formation phenotypes in E. coli. Integration of these promoters into the chromosome can allow for a quantitative, accurate assessment and tuning of genetic control. Collectively, quantitative phenotype-genotype analysis illustrated that optimal gene expression levels are variable and dependent on the genetic background of the strain.
expression levels, constitutes an integral platform for functional genomics, synthetic biology, and metabolic engineering endeavors.
Finally, multiple genetic modifications are necessary to unlock latent cellular potential. However, the capacity to make these meaningful modifications has remained an elusive task for cellular and metabolic engineering. The tool of global Transcription Machinery Engineering (gTME) allows one to explore a vastly unexplored, expanded search space in a high throughput manner by evaluating multiple, simultaneous gene alterations in order to improve complex cellular phenotypes. Through the alteration of key proteins involved in global transcription, cells may be reprogrammed for phenotypes of interest. Results in phenotype optimization using gTME outperformed traditional approaches to these problems, exceeding, in a matter of weekV, benchmarks achieved through decades of research. Through gTME, it is now possible to unlock complex phenotypes regulated by multiple genes which would be very unlikely to reach by the relatively inefficient, iterative gene-by-gene search strategies. The concept of gTME is generic and provides access points for diverse transciptome modifications broadly impacting phenotypes of higher organisms too, as further studies with yeast amply demonstrate.
On the basis of these studies, combinatorial methods are generally more powerful in obtaining a given cellular objective than systematic methods due to their ability to make broader perturbations. However, properly designed search strategies which make use of both systematic and combinatorial approaches may be the best route for optimizing phenotypes.
Thesis Supervisor: Gregory Stephanopoulos Title: Bayer Professor of Chemical Engineering
Acknowledgments
First, I would like to thank my thesis advisor, Greg Stephanopoulos for his support and guidance throughout my PhD research. I would also like to express my appreciation for the members of my thesis committee: Boris Magasanik, Kristala Jones Prather, Pierre Rouviere, Daniel I.C. Wang, and K. Dane Wittrup. Through thesis meetings and informal discussions, these people have helped to provide me with invaluable advice and guidance.
Research is not cheap, and I am grateful to the DuPont-MIT alliance for providing financial support for the work as well as for providing numerous occasions to interact with scientists at DuPont.
Research is not something that one does for fun in solitude (at least most people), and I owe thanks to several people who have helped me throughout my thesis. First on this list is, appropriately, the first person I met while visiting MIT: Joel Moxley. Many thanks go to Joel for providing invaluable collaborations and discussions throughout our entire time at MIT. Thanks is also due to: Curt Fischer for our time working together especially with the promoter work; Keith Tyo for always being around to listen to ideas and for providing input; Kohei Miyaoku for helping out with the bioreactors and making the overnight experiments more enjoyable; and the remainder of the members of the Stephanopoulos lab for help throughout my thesis.
Finally, none of this work would have been possible without the love and support of my parents and sisters, and for that I am forever indebted.
Contents
Abstract...3 Acknowledgments...5 List of Figures ...12 List of Tables ...16 1. Introduction ... 17 1.1 Motivation ... 17 1.2 Objectives ... 19 1.3 Approach ... 20 1.4 Thesis Organization ... 212. Metabolic Engineering Overview ... 23
2.1 Evolution of the Metabolic Engineering Approach ... 24
2.2 Systematic Approaches ... 25
2.2.1 Data-driven approaches ...26
2.2.2 Model-based approaches ... 27
2.3 Com binatorial Approaches ... 30
2.3.1 Inverse Metabolic Engineering Paradigm ... 30
2.3.2 Tools for introducing genetic perturbations ... 31...3
3. Lycopene Bioproduction ... 33
3.1.1 Non-mevalonate pathway ...36
3.1.2 Mevalonate pathway ... 39
3.2 Carotenoid pathway ... 40
3.3 Summary ... 41
4. Systematic target identification...42
4.1 Stoichiometric M odel ... 43
4.2 Identification of putative parameters ... 47
4.2.1 Growth rate and glucose uptake ... 47
4.2.2 Formate production ... 47
4.2.3 Oxygen uptake rate ... 1...5
4.2.4 Carbon source optimization ... 52
4.2.5 Sumrnmary ... 52
4.3 Single gene knockout targets...54
4.3.1 Single knockout genome scan ... 54
4.3.2 Linking of gdhA and NADPH ... 58
4.4 M ultiple gene knockout targets ... 62
4.4.1 Multiple knockout identification ... 62
4.4.2 Sequential vs. simultaneous searches ... 65
4.5 Experimental validation of targets ... 68
4.5.1 Conclusions from results ... 70
4.5.2 Comparison to random perturbations ...71
4.6 Summary ... 74
5. Mapping the metabolic landscape...77
5.2.1 Creating a systematic-combinatorial metabolic landscape ... 80
5.2.2 Visualizing the metabolic landscape ... 83
5.3 Uncovering genetic interactions...87
5.3.1 Impact of combinatorial targets ... 87
5.3.2 Hierarchical clustering analysis ... 90
5.3.2.1 Stoichiometric targets have similar modes-of-action ...90
5.3.2.2 Combinatorial targets decouple modes of action of stoichiometric targets ...92
5.3.2.3 Clustering analysis highlights varied modes-of-action ...95
5.3.3 Covariance analysis ...97
5.3.4 Summary ... 100
5.4 Optimizing fermentation profiles ... 100
5.5 High cell density fermentations ... 103
5.5.1 Determination of optimal fermentation parameters... 103
5.5.1.1 Agitation ... 103
5.5.1.2 pH control ... 105
5.5.2 High cell density fermentations ... 108
5.5.3 Carbon balances ... 113
5.5.4 Bioreactor summary ... 116
5.6 Summary ... 117
6. The lycopene gene knockout search network...121
6.1 Probing the metabolic landscape...122
6.2 Creating a search network diagram...129
6.3 Understanding network complexity ... 132
6.3.2 Model accessible nodes... 134
6.3.3 Mostly model inaccessible nodes ... 135
6.3.4 Model inaccessible nodes... 136
6.4 Further characterization of strains ... 136
6.4. yiE investigation... 139 6.5 Summary ... 142 7. Promoter Engineering ...144 7.1 M otivation ... 144 7.2 Background ... 145 7.3 Implementation ... 147 7.3.1 Multi-faceted characterization ... 151
7.3.2 Promoter strength metric... 154
7.4 Applications ... 155
7.4.1 Growth yield and ppc activity... 155
7.4.2 Lycopene yield and dxs activity ... 157
7.4.3 Lycopene yield andppc activity ... 161
7.5 Summary ... 163
8. global Transcription Machinery Engineering (gTME) ... 166
8.1 M otivation ... 166
8.2 Background ... 167
8.3 Implementation ... 169
8.4 E. coli Applications ... 171
8.4.2 Lycopene Production ... 186
8.4.3 M ultiple tolerances ... .. 191
8.4.4 Acetate tolerance ... 195
8.4.5 pHBA tolerance ... 199
8.4.6 Hexane tolerance ... 201
8.4.7 E. coli sum m ary ... 203
8.5 Yeast applications ... 203
8.5.1 LiCi tolerance ... 205
8.5.2 High glucose tolerance ... 207
8.5.3 Ethanol and glucose m ultiple tolerance ...209
8.6 Summary ... 211
9. Conclusions and recommendations...214
9.1 Summary ... 214
9.2 Conclusions ... 217
9.3 Recommendations for future work ... 220
10. Materials and methods...223
10.1 Commonly used techniques ... 223
10.1.1 Flux balance analysis calculations ... 223
10.1.1 Lycopene Assay ... 224
10.1.1 Transposon library generation and screening ... 224
10.1.1 Gene knockout construction and verification ... 225
10.2 Systematic gene knockouts ... 225
10.2.1 Strains and m edia ... 226
10.3 Metabolic landscape ... 228
10.3.1 Strains and m edia ... 228
10.3.2 Hierarchical Clustering Routines ... 229
10.4 High cell density fermentations...229
10.4.1 Ferm entation conditions ... 229
10.4.2 Organic and amino acid measurements ...230
10.5 Probing the metabolic landscape ... 231
10.5.1 Strains and m edia ... 231
10.6 Promoter Engineering ... 232
10.6.1 Strains and m edia ... 232
10.6.2 Library construction ... 233
10.6.3 Library characterization ...233
10.6.3.1 Initial characterization ... 233
10.6.3.2 Prom oter strength m etric ... 234
10.6.3.3 Transcriptional analysis ... 235
10.6.3.4 Chloram phenicol resistance ... 235
10.6.4 Prom oter delivery ... 235
10.6.5 List of prim ers ... 236
10.7 global Transcription Machinery Engineering ... 237
10.7.1 Strains and m edia ... 237
10.7.2 Library construction ... 238
10.7.3 Sequence analysis ... 239
10.7.4 Transcriptional analysis ... 239
10.7.5 Phenotype selection ... 240
10.7.6 Yeast Exam ples ... 241
List of Figures
3.1 Structure of lycopene ... 33
3.2 Lycopene production pathway ... 35
4.1 Impact of growth rate and glucose uptake rate on lycopene stoichiometric yield ... 49
4.2 Impact of formate production on lycopene stoichiometric yield ... 50
4.3 Impact of oxygen on lycopene stoichiometric yield ... 51
4.4 Carbon source optimization ... 53
4.5 E. coli genome scan for single gene knockout targets ... 56
4.6 in silico NADPH utilization in a wild-type strain ... 59
4.7 in silico NADPH utilization in a gdhA knockout strain ... 60
4.8 NADPH production rates ... 61
4.9 Identification of sequential, multiple gene knockout targets ... 64
4.10 Simultaneous approach to multiple target identification . ...67
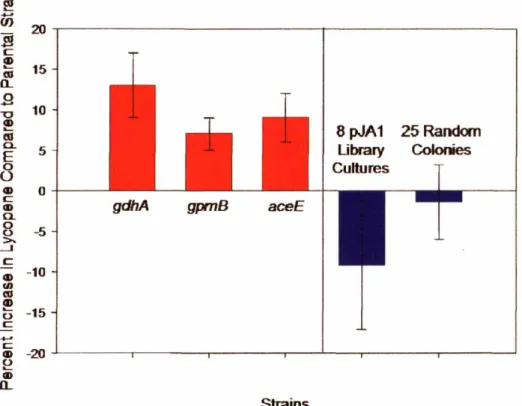
4.11 Comparison of selected mutants to random libraries of knockouts . ...73
5.1 Comparison of combinatorial targets to parental strain ... 79
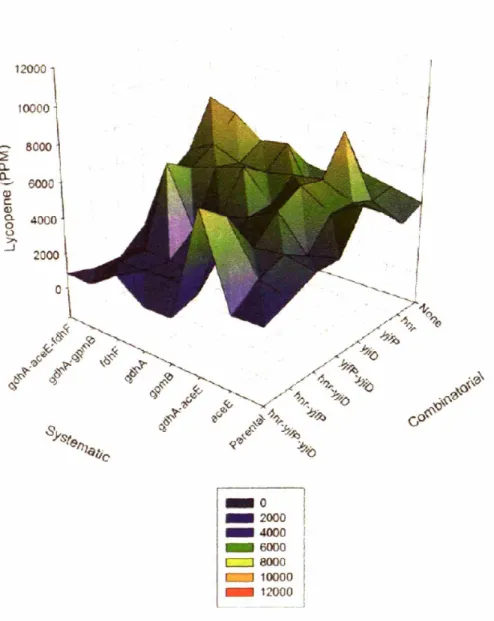
5.2 Systematic and combinatorial gene knockout target identification ... 82
5.3 Visualization of the metabolic landscape at 15 hours ... 84
5.4 Visualization of the metabolic landscape at 24 hours ... 85
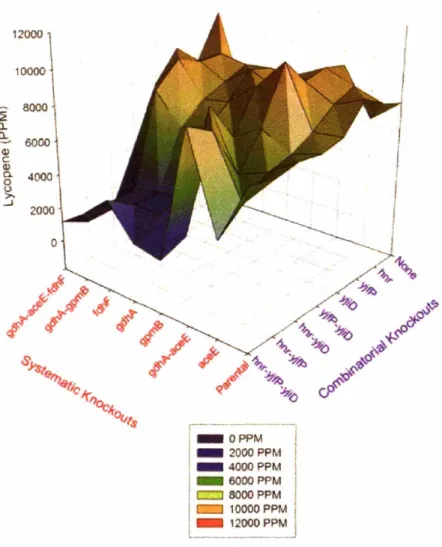
5.5 Visualization of the metabolic landscape-maximum production ... 86
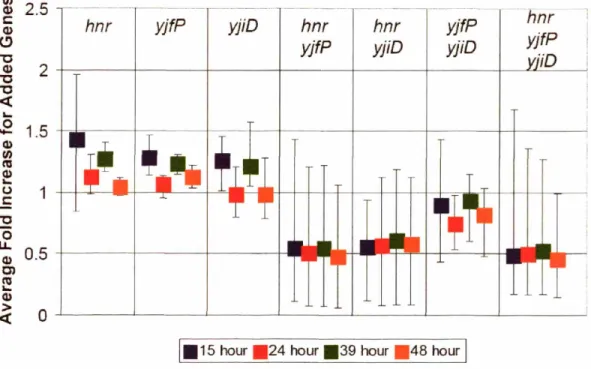
5.6 Impact of combinatorial genotypes on systematic backgrounds ... 89
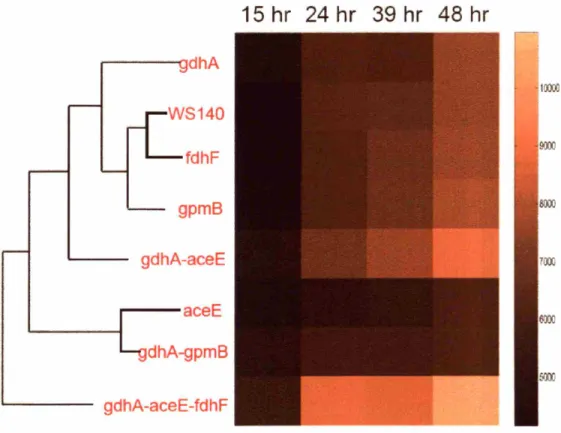
5.8 Clustering analysis of time course data for combinatorial targets ... 93
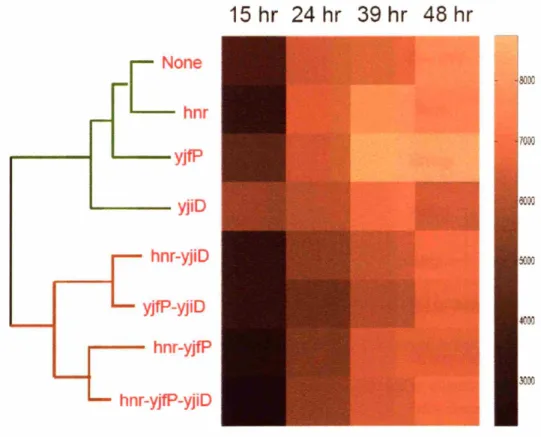
5.9 Clustering analysis of time course data for systematic targets with hnr knockouts .. 94
5.10 Clustering analysis and bubble plots ... 96
5.11 Covariance analysis of systematic targets ... 98
5.12 Covariance analysis of combinatorial targets ... 99
5.13 Behavior of selected strains in optimized culturing conditions . ...102
5.14 Fermentation-based investigation of oxygen level on lycopene . ...104
5.15 Impact of double-sided pH control on lycopene production . ...106
5.16 Impact of single-sided pH control on lycopene production . ...107
5.17 Volumetric lycopene production in the reactors ...110
5.18 Specific lycopene production (ppm) in the reactors . ... 111
5.19 Overall carbon yield balances for the fermentors . ... 114
5.20 Marginal carbon yield balances for fermentors ... 115
6.1 Original search network diagram for the metabolic landscape ... 130
6.2 Complete search network diagram for the metabolic landscape ... 131
6.3 Lycopene production of selected strains at 15 and 24 hours in lxM9 ... 138
6.4 Comparison of Ahnr AyliE to previous maxima at 15 and 24 hours in 2xM9 ... 140
6.5 Impact of AyliE in other genotypes ... 141
7.1 Generation of the functional promoter library ... 149
7.2 Flow cytometry analysis of the functional promoter library ... 150
7.3 Comprehensive characterization of the promoter library ... 153
7.4 Growth yield and ppc activity ... 156
7.7 Lycopene yield and ppc activity ... 162
8.1 Basic methodology of global transcription machinery engineering ... 170
8.2 Overall improvement of ethanol tolerance using gTME ... 172
8.3 Sequence analysis of ethanol sigma factor mutants ... 174
8.4 Growth curves for ethanol-tolerant sigma factor mutants ... 176
8.5 Transcriptional analysis of general ethanol stress ... 179
8.6 Transcriptional analysis of an ethanol sigma factor mutant ... 180
8.7 Transcriptional analysis of an ethanol sigma factor mutant in response to ethanol. 181 8.8 Patterns in the transcriptional profiles in response to ethanol ... 185
8.9 Sequences for lycopene sigma factor mutants ... 187
8.10 Application of gTME to a metabolite production phenotype ... 188
8.11 Genotype specificity of identified sigma factor mutants ... 190
8.12 Eliciting multiple, simultaneous phenotypes using gTME ... 193
8.13 Sequence analysis of multiple, simultaneous phenotypes using gTME ... 194
8.14 Growth analysis of acetate mutants ... 197
8.15 Sequence analysis of acetate sigma factor mutants ... 198
8.16 Growth analysis of pHBA sigma factor mutants ... 200
8.17 Sequence analysis of pHBA sigma factor mutants ... 200
8.18 Growth analysis of hexane sigma factor mutants ... 202
8.19 Sequence analysis of hexane sigma factor mutants ... 202
8.20 Growth analysis of LiCl gTME mutants in yeast ... 206
8.22 Growth analysis of glucose gTME mutants in yeast ... 208
8.23 Sequence analysis of glucose gTME mutants in yeast ... 209
8.24 Growth analysis of ethanol-glucose gTME mutants in yeast ... 210
List of Tables
3.1 Non-mevalonate pathway for isoprenoid biosynthesis ... 38
3.2 Mevalonate pathway for isoprenoid biosynthesis ... 39
3.3 Carotenoid pathway ... 41
4.1 Modifications of the iJE660a model ... 45
4.2 Metabolite abbreviations for the modified iJE660a model ... 46
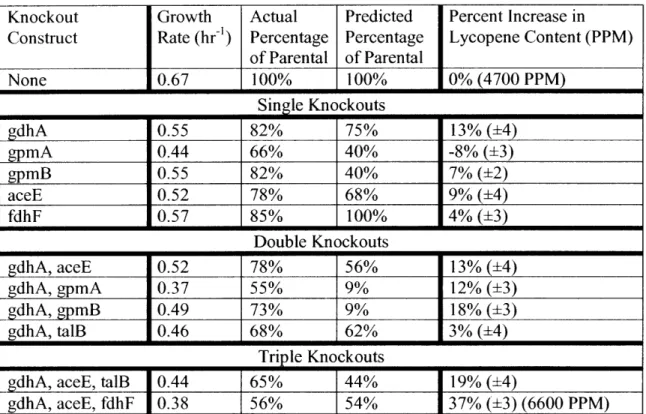
4.3 Experimental results of single and multiple gene knockouts ... 69
5.1 Growth and lycopene phenotypes of strains in fed-batch reactor ... 112
Identified gene Identified gene Identified gene Identified gene Identified gene Identified gene Identified gene Identified gene knockouts in the parental strain background ... 123
knockouts in the AgdhA AaceE background ... 123
knockouts in the AgdhA AaceE AfdhF background ... 124
knockouts in the AgdhA background ... 124
knockouts in the AyjfP background ... 125
knockouts in the Ahnr background ... 125
knockouts in the ApyjiD background ... 126
knockouts in the AgdhA AaceE ApyjiD background ... 126
6.9 Fold improvement in lycopene production by identified gene knockouts ... 127
8.1 Improvement of ethanol tolerance through engineered sigma factors ... 175
8.2 Change in expression of ethanol response genes ... 182
8.3 Change in expression of sigma factor mutant-induced genes ... 182
8.4 Change in expression of new ethanol response ... 183
10.1 Primer Designs for Gene Knockout Constructs . ...227 6.1 6.2 6.3 6.4 6.5 6.6 6.7 6.8
Chapter
1
Introduction
1.1 Motivation
The improvement of cellular properties using modem genetic tools is a central goal of metabolic engineering (Stephanopoulos, 2002). Advances in molecular biology and genetic engineering empower metabolic engineers with the increasing ability to create any desired cellular modification. These new tools complement the global focus to target identification which has always been a strength of the metabolic engineering paradigm. Embedded in these concepts is the understanding that cellular phenotype reflects global intracellular conditions, not individual gene states. Beyond individual metabolite pathways, cellular phenotype is a manifestation of global gene expression levels, metabolic demand, resource availability, and cellular stresses. Above all, metabolic function is constrained by the stoichiometry and individual reaction kinetics of the
reaction network. This fundamental understanding has been at the heart of metabolic engineering since its conception over a decade and a half ago. However, since its conception, a particularly useful, additional tool has become available for metabolic
the process of conducting such system-wide analyses.
The advent of genome sequencing has greatly expedited the discovery process. However, genome sequences and catalogues of bioreaction networks only provide a list of parts to be used in this endeavor. Beyond these, complexities and nonlinearities in the interactions of metabolic pathways and regulatory networks confound the process of cellular and metabolic engineering. To accomplish these tasks in an efficient and
comprehensive manner, a diverse set of molecular biology tools must accompany, and at times supplement, systematic analysis of pathways. These tools and methodologies must be both broad in effect (since different genes require different levels of modification) and
in scope (since each pathway has a unique set of regulatory bounds). When collectively used, these advances in molecular biology and genetic engineering enable the realization of whole-cell engineering. Consequently, the development of methods to identify key genetic targets and subsequently, the ability to make broad modifications are required to accomplish the broad goals of whole-cell engineering.
Once created, these tools can be linked with high-throughput screening to help
unlock latent cellular phenotypes and ultimately, lead to the understanding of genotype-phenotype relationships. However, a set of tools will only be as effective as the context in which they are used. As such, efficient phenotype optimization necessitates a robust, defined search strategy to identify genetic targets requiring modification. By exploring and probing the metabolic landscapes created by the underlying structure of genotype-phenotype interaction, lessons may be gained which can help guide future cellular and metabolic engineering programs. Furthermore, it is not clear how one should approach a
given problem in metabolic and cellular engineering. A complement of tools, both systematic and combinatorial, is available, yet it is unclear how these tools should be used to bring about the most substantive changes to a cellular system. In this light, this thesis addresses the issue of the development of both strategies and tools for the
identification of genetic targets for the engineering of microorganisms.
1.2 Objectives
To accomplish the goals set out for this thesis, two major objectives were proposed: * Evaluate the applicability of systematic approaches to the case study of increasing
lycopene yield
o Evaluation of stoichiometric models as a means of navigating the metabolic landscape
o Evaluation of combinatorial tools for the further optimization of metabolic phenotypes
o Evaluation of search strategies to elucidate the topology of the gene knockout search network
* Develop and evaluate combinatorial tools which modulate gene expression and regulatory networks
o Development of a tool for the optimization of gene expression level, applicable for chromosomal-level modifications
o Development of a tool for the combinatorial alteration of regulatory networks and simultaneous alterations of multiple genes
1.3 Approach
To address the problem of understanding and improving methods for the identification of gene targets, we have focused on the study of recombinant lycopene production pathway in Escherichia coli. In particular, this study focused on the
identification of gene knockout targets, however, it is emphasized early that the analysis and results obtained are not limited to this mode of perturbation. As such, the strategies and lessons may be easily applied to other systems such as gene overexpression or other modes of perturbations as described later. The approach consists of using a global, stoichiometric model to identify single and multiple gene knockout targets. This target selection is then complemented through the use of transposon mutagenesis to identify a disparate set of gene knockout targets. These two sets are then combined to gain an understanding of the metabolic landscape. Finally, this landscape is analyzed at various
important nodes through additional transposon mutagenesis searches. The resulting analysis will present a picture and understanding of the resulting gene knockout search network. It will be demonstrated that despite the high degree of complexity in these systems, certain key nodes are universal and thus serve as platforms for strain improvement.
Two novel tools for metabolic engineering will also be discussed and demonstrated through a number of examples. The first, a tool for optimizing gene expression, termed Promoter Engineering will be addressed. After demonstrating the development of a fully-characterized, wide dynamic range of constitutive promoter strengths, a library will be constructed. The utility of this library will be demonstrated
through the optimization of two gene expression levels, dxs and ppc for the increase of lycopene yield and both cell yield and lycopene yield respectively. The applicability of this tool to other host systems will be discussed.
Finally, the tool of global Transcription Machinery Engineering (gTME) will be demonstrated as a novel tool for the introduction of multiple, simultaneous modifications to gene expression. The methodology for this approach will be presented followed by a series of examples of improvement of phenotypes in E. coli. Furthermore, the
applicability of this tool to other host systems will be demonstrated through examples of phenotype improvement in Saccharomyces cerevisiae.
In general, the approach to accomplishing the broad goals outlined in Section 1.3
is two-pronged: (1) Investigation of systematic approaches to metabolic engineering problems and (2) Development of tools which can aid in metabolic engineering efforts. As such, the research presented in this thesis will reflect these two broad areas.
1.4 Thesis Organization
The metabolic engineering paradigms of systematic and combinatorial approaches are presented in Chapter 2 as an overview of the current portfolio of successful attempts at engineering cellular systems. A major model system utilized for this study was the recombinant bioproduction of lycopene in Escherichia coli. An overview of the lycopene production pathway and prior attempts of engineering this model system is presented in Chapter 3. Chapters 4 through 6 address the application of various techniques and search strategies for the identification of gene targets and subsequent engineering of E. coli for
Engineering, a tool for the optimization of gene expression. Chapter 8 will present a tool termed global Transcription Machinery Engineering (gTME) which provides for the simultaneous, multiple modification of the transcriptome. Finally, this thesis concludes with a discussion of the impact of these results (Chapter 9) with respect to the metabolic engineering paradigms presented in Chapter 2 as well as recommendations for further studies. A comprehensive Materials and Methods section will be included in Chapter 10 to cover all experiments in this thesis.
Chapter 2
Metabolic Engineering Overview
Metabolic engineering is a young field, nearly fifteen years old. During this period, it has developed a well-defined methodology and a focused research portfolio of rich intellectual content and particular relevance to biotechnology and biologicalengineering. New and diverse opportunities for metabolic engineering emerge quickly in this post-genomics era. These opportunities provide a challenge to the metabolic
engineering paradigm. In particular, the scope of problems posed to the field is rapidly increasing in complexity. Although the focus (e.g. improving cells) and a central component (e.g. assessing cell physiology) of metabolic engineering remain the same, new tools are required to take advantage of the opportunities arising from the availability of whole-genome sequence information. This chapter will review the evolution of the metabolic engineering approach, and in particular, will highlight various systematic and combinatorial approaches previously used to optimize strains and identify genetic targets for a given phenotype. The purpose of this section is to briefly provide a context for the results presented in chapters 4-9.
2.1 Evolution of the Metabolic Engineering Approach
The current portfolio of advances in metabolic engineering is large for such a young field of study. Concepts and methodologies have been applied to extending cellular substrate ranges (Becker & Boles, 2003; Ostergaard et al., 2000; Prieto, Diaz, & Garcia, 1996), increasing product yields (Koffas, Jung, & Stephanopoulos, 2003), and diversifying product ranges (Cameron et al., 1998; Farmer & Liao, 2000; Watanabe et al., 2003). In addition to solely dealing with substrate and product diversification, advances have been made in balancing reduction potentials within a cell (Berrios-Rivera, Bennett, & San, 2002) and improving the ability of cells to thrive in non-traditional environments
such as hypoxic (Khosla & Bailey, 1988) and toxic (J-Y Lee, Roh, & Kim, 1994)
conditions. Furthermore, although frequently focused on bioprocessing applications, the broad applicability of metabolic engineering concepts has impacted research in the fields of biocatalysis (Stafford et al., 2002b) and medicine. Studying the metabolism of organs and cells has aided in the identification of genetic targets for disease therapy and the understanding of metabolic function for some disease states (Kyongbum Lee et al., 2003; Yarmush & Banta, 2003).
These examples illustrate the central focus of metabolic engineering. More specifically, these studies attempt to (1) identify genetic targets, (2) rigorously quantify metabolic phenotype, and (3) understand kinetic control in metabolic networks. Genetic targets may be identified systematically through determining the rate controlling step in a reaction or combinatorially through high-throughput screening. Once the identified genetic perturbations have been performed, high-throughput metabolic profiling tools aid in fully quantifying the resulting metabolic phenotype.
2.2 Systematic Approaches
Genomic sequences have facilitated the construction of cellular metabolism models enabling systematic approaches to gene target identification. Given the absence of extensive knowledge about the kinetics of molecular interactions, the dissection and optimization of metabolic pathways is an outstanding issue of central importance to metabolic engineering. These models are most often not of kinetic nature due to limited rate and regulatory data. As a result, stoichiometric models have been formulated where the pathways fluxes (reaction rates) are determined such as to optimize a pre-selected objective function (Kauffmtan, Prakash, & Edwards, 2003). Models and results based on bioreaction network stoichiometry provide a direction for modulating metabolism. To this end, putative parameters and interacting pathways may be extracted.
However, models based solely on reaction stoichiometry neglect entire portions of the genome responsible for regulation and control. Current models hold the promise of predicting the metabolic function of whole cells, especially when used in conjunction with other protein and small metabolite data. The integration and understanding of the
cellular components gives rise to information about system behavior. Genomic sequencing information provides a catalogue of an organism's capacity and metabolic capability. Physiology and phenotype rely on the interactions and concentrations of all of these components which highlight the importance of integrating multiple dimensions of molecular interactions in order to predict global, system response. Nevertheless, these models have proved invaluable in probing cellular systems for putative parameters and
being either data-driven or purely model-based.
2.2.1 Data-driven approaches
Comprehensive metabolic profiling requires measuring metabolite levels and reaction fluxes, typically through the use of a gas chromatography-mass spectrometry (GC-MS) unit to detect metabolite levels. Used in conjunction with isotopic labeled substrates, GC-MS spectra provide insight into the distribution of the labeled substrate through the various pathways of the bioreaction network. Further advances in high-throughput metabolite and isotopic measurements (Soga et al., 2003) will continue to advance our ability to probe the underlying factors influencing cellular phenotype, in particular, abilities to measure metabolite pools and pathway fluxes. Once these variables are adequately assessed, kinetic control may be elucidated through further genetic perturbations and measurement of the metabolic response. These concepts
collectively embodied in Metabolic Control Analysis (MCA) (Stephanopoulos, Aristidou, & Nielsen, 1998) can help elucidate the link between genotype and phenotype, while at the same time, identify future gene targets. The major principle behind MCA resides in creating fluctuations within the cell for various enzyme levels and measuring the impact
on a certain factor, like a production rate (Stafford et al., 2002a; Stephanopoulos, 1999).
As an example, flux data can be used to identify various nodes and distributions of carbon flux in a cellular system to identify required gene knockouts or overexpressions
Other forms of high-throughput data have been used to extract putative genetic targets. In one such application, association discovery was employed for the evaluation of a library of unsequenced fungal strains of Aspergillus terreus for their ability to over-produce the antibiotic lovastatin (Askenazi et al., 2003). Through the use of gene
overexpressions, a large diversity of strains was generated with respect to the production profiles of lovastatin and (+)-Geodin and the strains were characterized by metabolite and transcriptional profiling. These measurements generated a wealth of biological data, from which Askenazi et al. were able to extract key putative parameters and genes by performing a statistical association analysis. Ultimately, this data-based approach can
make use of high-throughput data collection to predict the next perturbation necessary for a given cellular state. However, these techniques often require a significant amount of experimental work and the results are not ordinarily extensible to other genotypes.
2.2.2 Model-based approaches
As a complementary approach to traditional laboratory experiments, metabolic simulations are becoming a useful tool for probing cellular function. Current
computational methods simulating metabolism (in silico predictions) attempt to probe cellular function by simulating the bioreaction network. Ultimately, a comprehensive kinetic model of metabolism could aid in the identification of genetic targets and putative parameters influencing phenotype. Models can range from strictly reflecting
stoichiometry (Edwards & Palsson, 2000) to detailed enzymatic kinetics of an entire pathway (Wiechert, 2002). In these efforts, metabolic engineering has borrowed heavily
chemical reaction engineering require a model reflective of the system dynamics (such as
a rate expression). While these tools could be easily applied to cellular systems, the
limitations of current cellular models severely limit the amount of information we can extract from the models. Despite limited data about the intracellular conditions and kinetic parameters, many dynamic models have been assembled for gene expression modeling and for several, well-characterized systems (Chen, 1997; Fell, 1998; Niederberger et al., 1992; Stafford et al., 2002a). Borrowing from the simplifying assumptions of chemical reaction engineering, our lack of understanding is often masked by concepts such as "rate-limiting steps" and "functions of genes" (J. Bailey, 1999). However, these reduced models do not always accurately model all in vivo cellular response and require improvement by further experiments.
A great deal of emphasis has been recently placed on using stoichiometric models
for the determination of putative parameters and gene knockout targets for many cellular systems including Escherichia coli, Saccharomyces cerevisiae, Synechocystis sp.
(Edwards, Ibarra, & Palsson, 2001; Edwards & Palsson, 2000; Famili et al., 2003; Forster et al., 2003; Shastri & Morgan, 2005). These methods of flux balance analysis revolve around the basic principle of applying the steady state solution to the dynamic metabolite balance. When the steady state assumption is invoked, the transient metabolite balance (a differential equation) assumes the form of a linear matrix expression:
S * v = b (Equation 2.1)
where S is the stoichiometry matrix, v is a vector of fluxes, and b is a vector of transport
number of fluxes on the order of a thousand and number of metabolites in the S matrix on the order of hundreds. To solve this underdetermined system, it is necessary to create an objective function and a typical approach is to use linear programming to determine the fluxes given a series of flux constraints. Often times, maximization of biomass
production serves as the exclusive objective function used to solve the matrix equation (Edwards, Ibarra, & Palsson, 2001; Kauffman, Prakash, & Edwards, 2003).
However, for systems in which genetic perturbations (knockouts or
over-expressions) are introduced, the resulting phenotype is often suboptimal. To calculate the flux profile in suboptimal systems, a minimization of metabolic adjustment (MOMA) calculation serves as an additional constraint in which the resulting flux profile is
intermediate between the wild-type optimal and mutant optimal and requires a quadratic programming to solve (Segre, Vitkup, & Church, 2002). However, these sets of
constraints and objective functions is not exhaustive as several attempts have been made to include a bi-level optimization to provide for dual optimization of cellular and
bioengineering objectives (Burgard, Pharkya, & Maranas, 2003). Furthermore, several attempts have been made in attempts to further restrict the resulting fluxes including the addition of thermodynamic constraints to impose restrictions on this underdetermined system (Beard, Liang, & Qian, 2002). Newer versions of stoichiometric models have made attempts to include regulation and further refinement of stoichiometric reactions including specificity of redox pairs (Reed et al., 2003). Finally, recent advances have attempted to improve the methods for calculating the suboptimal fluxes resulting in a gene knockout by limiting the number of fluxes changing after genetic perturbations (Shlomi, Berkman, & Ruppin, 2005). Each of these methods aim to solve the same
knowledge of genome sequences and biochemical reactions available in a cell. The application and demonstration of these models, however, has received little attention experimentally.
2.3 Combinatorial Approaches
Typically, gene deletions and amplifications serve as effective tools for genetic modification. The intrinsic link between cellular genotype and phenotype may be
extracted by studying the response of cells to these systematic changes. In recognition of the importance of these changes in probing the genotype-phenotype relationship, a diverse set of tools have emerged to create these specified genetic modifications. Molecular biology advances have provided the ability to perform these modifications at will. In addition to gene-specific tools, a number of combinatorial tools have also been created which, when combined with high throughput screening, allow for randomized gene expression levels (including deletions) and genomic library complementation.
2.3.1 Inverse Metabolic Engineering Paradigm
The identification of genetic targets through a systematic approach is often a very difficult problem due to the lack of metabolic models apt at capturing both reaction kinetics and genetic regulation. An alternative method for introducing cellular
perturbations to identify targets, termed inverse metabolic engineering (J. E. Bailey et al., 2002), uses introduced perturbations linked together with high throughput screening to
ultimately identify genetic targets. This methodology uses the approach of screening for a desirable phenotype using a perturbation library and tracing genetic modifications responsible for the cellular response. The main objective of the inverse approach is to identify targets which, following modification, will elicit a desired phenotype rather than randomly evolving a high product titer strain. Moreover, recent advances in genomics technologies allow for this process to proceed via high throughput screening methods (Badarinarayana et al., 2001; Gill et al., 2002). One good example is parallel gene trait mapping (PGTM), which exploits DNA microarray as a tool for the high-throughput identification of genes conferring a particular phenotype (Gill, 2003). Furthermore, tools such as flow cytometry and microfluidic devices allow for high-throughput screening and selection of mutants with improved cellular properties. Beyond these tools, perhaps one of the greatest experimental advances has been genome sequencing. The ready
availability of sequence data extends the impact of metabolic engineering. The development of tools for diverse genetic perturbations is necessary to uncover critical gene targets.
2.3.2 Tools for introducing genetic perturbations
The introduction of tools for genetic perturbations includes the introduction of randomized gene knockouts (Badarinarayana et al., 2001) and overexpressions through shotgun genomic libraries (Kang et al., 2005). Most tools for genetic perturbations have benefited from genome sequencing efforts. The ability to obtain sequence information influences the experimental tools used to understand and modify cells. As an example, transposons, which allow for randomized genomic knockouts, have become a tool for
microorganisms, but also in higher eukaryotes such as mice (Hayes, 2003). Screening libraries of transposon knockout strains and subsequent DNA sequencing can identify unknown genes influencing a particular phenotype (Hemmi et al., 1998). The direct ability to perform these randomized knockouts and identify their location by sequencing has undoubtedly increased the throughput of such experiments and has lead to an
incentive to search for the minimal genome (Hutchison et al., 1999), which may be of use for bioprocessing applications. Furthermore, bioinformatics tools can search sequence data to identify particular elements within the non-coding regions which are important for cellular function. As an example, elements such as microRNAs and interfering RNA (RNAi) may be predicted from bulk sequence data (Lewis et al., 2003). Once identified, these elements have the potential to be powerful molecular biology tools for gene
silencing. Finally, DNA sequencing facilitates efforts in directed evolution and
mutagenesis. The generation of beneficial mutants and subsequent sequencing can help
in reducing the search space in future studies and lead to a further understanding of
sequence-function relationships and patterns. Ultimately, these tools may be used to create perturbations which can elicit phenotypes of interest. However, it is unclear how to efficiently and effectively utilize these tools. Furthermore, very few tools allow for the fine-tuning of genetic control and fewer tools address the important consideration of modifying multiple genetic targets simultaneously.
Chapter 3
Lycopene Bioproduction
Lycopene is a hydrocarbon molecule that may be classified as a carotenoid. Carotenoids are molecular members of the isoprenoid family of compounds found within all cells. Isoprenoids larger than 5 carbon units are formed through the head-to-tail condensation of multiple isoprene units to create the desired length. Lycopene (C4 0H56)
is a red pigment carotenoid possessing a characteristic conjugated, aliphatic hydrocarbon chain shown in Figure 3.1.
Figure 3.1: Structure of lycopene. Lycopene is a 40 carbon conjugated hydrocarbon
which serves as a gateway molecule into other cyclic carotenoids.
In addition to optical properties, the conjugated structure of lycopene and similar carotenoids has been implicated in mechanisms related to photodynamic action protection and singlet oxygen quenching (Sandmann, 2002). These molecules have received a
protecting, and, natural food colorant properties (P. C. Lee & Schmidt-Dannert, 2002). Furthermore, large families of carotenoids containing cyclical structures (including [3-carotene) require lycopene as a precursor.
Naturally, carotenoids are produced in plants and fungal systems (Cunningham & Gantt, 1998). The recent elucidation of the various metabolic routes and required enzymes for carotenoid production has allowed for the possibility of high-level
production of diversified carotenoid molecules (both naturally occurring and synthetic) in recombinant hosts such as Escherichia coli. Roughly, the metabolism of these molecules in a host cell may be divided into three areas: (1) the isoprenoid pathway, (2) the
carotenoid pathway, and (3) remainder of cellular metabolism, which supplies precursors and cofactors required for the production of this expensive, secondary metabolite.
Figure 3.2 summarizes the lycopene production pathway for the non-mevalonate route
including (in various detail) all three contributing pathways. Furthermore, the overall stoichiometry is included which indicates that for every molecule of lycopene produced, 16 NADPH reducing equivalents are required in addition to 8 CTPs and 8 ATPs. This stoichiometry illustrates the high energetic and redox requirement required to produce
Net Reaction:
8 G3P + 8 Pyr + 16 NADPH + 8 CTP + 8 ATP
J
1 lycopene + 8 CO2+ 16NADP +8CMP +8ADP + 12PP;
~PmmAB IG ~: IPPP ~ Lycopene
I
:tP 2-PlG dxs Dxpispgen
1
idi~1~;:I~'For
~F '-C-O-2-+-Q~PPN~A:~:E
NH~
?
ICT..., NAlwH NADPOAA ~G.\. / ~ Glu
t
l
gdhA MAL succ ''-... FUM / Glucose P, To PPPFigure 3.2: Lycopene production pathway. Lycopene synthesis begins with the condensation of the key glycolytic intermediates, glyceraldehyde 3-P (G3P) and pyruvate (PYR) and continues in a nearly linear pathway. The genes encoding for idi and dxs are typical targets for lycopene over-expression along this pathway. The overall
stoichiometry of this reaction is included, which highlights the high energetic and redox requirements for biosynthesis.
3.1
Isoprenoid pathway
Engineering strains for the overproduction of isoprenoid-based molecules is of significant interest due to the diversified base of products accessible through this molecular gateway. Branching from the five-carbon precursor unit of isopentenyl-pyrophosphate (IPPP), it is possible to create carotenoids, quinones, and even precursors
for desirable pharmaceuticals such as Taxol and Artemesinin (Huang et al., 2001; Martin
et al., 2003). Lycopene is a major precursor to downstream, modified carotenoids (Sandmann, 2002). Lycopene production in E. coli requires the heterologous expression of the crtEBI genes to encode the polymerization of IPPP to the 40 carbon molecule of lycopene. However, two possible routes exist for the synthesis of IPPP in nature, termed the mevalonate and the non-mevalonate pathway. For the studies presented in this thesis, we investigated the issues of gene target identification in the context of heterologous lycopene production in E. coli using the non-mevalonate pathway (Adam et al., 2002).
3.1.1 Non-mevalonate pathway
Isoprenoid production using the non-mevalonate pathway in E. coli utilizes glycolytic intermediates to form precursor monomers which subsequently undergo polymerization to form the 40 carbon biopolymer. Through the use of this pathway, two precursor molecules, glyceraldehyde-3-phosphate and pyruvate are used to form the predominant isoprenoid unit, isopentenyl pyrophosphate (IPPP). Table 3.1 summarizes
the various reaction steps required to convert the precursors into IPPP. In general, a seven reaction series is required for the conversion of glyceraldehyde-3-phosphate and pyruvate to IPPP (Adam et al., 2002; Hecht et al., 2001). Initial attempts for improving carotenoid production in E. coli targeted the expression of genes coding for enzymes for this non-mevalonate pathway (Farmer & Liao, 2000, 2001; P. C. Lee & Schmidt-Dannert, 2002). Even with the over-expression of dxs and idi genes (Kajiwara et al., 1997; Seon-Won Kim & Keasling, 2001; Mathews & Wurtzel, 2000), cellular production and accumulation of carotenoids were limited by regulatory networks and precursor supply (Farmer & Liao, 2000, 2001; Jones, Kim, & Keasling, 2000; P. C. Lee & Schmidt-Dannert, 2002; Wang, Oh, & Liao, 1999).
Molecule Abbreviation Molecule Name CDPME 4-diphophocytidyl-2-C-methyl-d-erythritol 4-diphosphocytidyl-2-C-methyl-2-phosphate-d-CDPMEPP erythritol DMPP Dimethylallyl pyrophosphate DXP I-deoxy-d-xylulose-5-phosphate G3P Glyceraldehyde 3-phosphate
GPP trans Geranyl pyrophosphate
HMBPP 1 -hydroxy-2-methyl-2(E)-butenyl-4-diphsophate
IPPP Isopentyl pyrophosphate
MECPP 2-methyl-d-erythritol-2,4-cyclodiphosphate
MEP Polyol 2-C-methyl-d-erythritol-4-phosphate
PPI Pyrophosphate
Table 3.1: Non-mevalonate pathway for isoprenoid biosynthesis. The
non-mevalonate pathway includes a seven step reaction pathway from the precursors of glyceraldehyde-3-phosphate and pyruvate to the formation of IPPP. Further IPPP may be generated from DMPP through the isomerization reaction catalyzed by idi.
Pathway Gene Reaction
Isoprenyl-pyrophosphate dxs G3P + Pyruvate - DXP + CO2
synthesis pathway ispC DXP + NADPH < MEP + NADP
ispD MEP + CTP -> CDPME + PPI
ispE CDPME + ATP - CDPMEPP + ADP
ispF CDPMEPP MECPP + CMP
ispG MECPP * HMBPP
ispH HMBPP -> 0.5 IPPP + 0.5 DMPP
Isoprenyl pyrophosphate idi IPPP < DMPP
isomerase
3.1.2 Mevalonate pathway
An alternative pathway for the production of isoprenoids found predominately in many eukaryotic systems is the mevalonate pathway, named for its metabolite
intermediate. However, several laboratories have engineered the heterologous
mevalonate pathway in E. coli (Campos et al., 2001; Martin et al., 2003). In this pathway, acetyl-coA serves as the sole precursor for the production of IPPP. A summary of the reactions for this pathway are provided in Table 3.2.
Pathway Gene Reaction
Mevalonate atoB 2 A-CoA --> AA-CoA + CoA
pathway to IPPP hmgS AA-CoA + A-CoA + H20 ---> 3-HMG-CoA + CoA
hmgR 3-HMG-CoA + 2 NADPH ---> Mev + 2 NADP + CoA
Erg12 Mev + ATP ---> Mev-5P + ADP
Erg8 Mev-5P + ATP - Mev-5PP + ADP
Mvdl Mev-5PP + ATP -- IPPP + ADP + CO2+ Pi
Isoprenyl idi IPPP -> DMPP
pyrophosphate isomerase
"'
....: :.: - . '. ' .: ' ....:...: .. .::' :. : -....:'.i:... " .' :I"'.'..:.:.:. - :'r.: :.'.' .... '. '.. . - ' . .' " - i -:: " .-'...-':."'' ').'..':.'.':'';i':".
: :' ,,,:.'..'. ,, :" ., ... ::,..."... ~ : .: -. : -. ,"::: .' : - .'.-',; :.' ... ""...'. '..',,-.",.... : .... ' .... :'.' '.' "'"'.-',." ... ... . '.. .. , . ,,. ..- ',',,-,.,:'' ,-''-:.
Molecule Abbreviation Molecule Name
A-CoA Acetyl-CoA AA-CoA Acetoacetyl-CoA 3-HMG-CoA 3-hydroxy-3-methyl-glutaryl-coA Mev Mevalonate Mev-5 P Mevalonate-5-phosphate Mev-5 PP Mevalonate-5-diphosphate
IPPP Isopentyl pyrophosphate
Table 3.2: Mevalonate pathway for isoprenoid biosynthesis. The mevalonate
3.2 Carotenoid pathway
Regardless of the upstream pathway used, the precursor isoprene units of IPPP and the isomer version DMAP serve as the monomeric units for the production of carotenoids (as well as endogenously for quinones). The heterologous expression of a three enzyme complex results in the expression of the enzymes required for the polymerization to the C40 carotenoid molecule (Cunningham FX Jr, 1994; Umeno,
Tobias, & Arnold, 2002). These three reactions are described in Table 3.3.
This portion of the isoprenoid pathway and downstream reactions have received great attention recently in an effort to create a diverse library of carotenoids (Sandmann, 2002; Sandmann et al., 1999; Schmidt-Dannert, Umeno, & Arnold, 2000; Umeno, Tobias, & Arnold, 2005). Through the discovery of novel enzymes with altered substrate
specificity and through directed evolution and selection, novel carotenoids have been synthesized. These new molecules however, still require engineered cellular systems to create the necessary precursor molecules of IPPP and to provide the energy and redox cofactors which are required.
Pathway Gene Reaction
Lycopene Pathway crtE IPPP + FPP -> GGPP + PPI
crtB 2 GGPP --> PHYTO + PPI
crtl PHYTO + 8 NADP ---> LYCO + 8 NADPH
Molecule Abbreviation Molecule Name
FPP trans, trans Farnesyl pyrophosphate
GGPP Geranylgeranyl PP
IPPP Isopentyl pyrophosphate
LYCO Lycopene
PHYTO Phytoene
PPI Pyrophosphate
Table 3.3: Carotenoid pathway. The carotenoid pathway
3.3 Summary
Two pathways are available for the synthesis of precursors for the production of isoprenoid-based molecules in E. coli. These isoprenoid-based molecules are as diverse
as cancer drugs, high valued coenzymes (such as coenzyme Q) and carotenoids. The
remainder of this thesis will deal with the non-mevalonate pathway for the production of
Chapter 4
Systematic target identification
It was discussed earlier that a central goal of metabolic engineering is the improvement of cellular phenotype, such as metabolite overproduction, by the introduction of genetic controls. To this end, metabolic engineering efforts haveconsidered the properties of the overall metabolic network, in sharp contrast to the single-gene focus that characterizes typical applications of single-genetic engineering. Due to the lack of extensive knowledge about molecular interactions and their kinetics, the dissection and optimization of metabolic pathways is an outstanding issue of central importance to metabolic engineering (Stephanopoulos, Alper, & Moxley, 2004). The focus in this chapter is on the improvement of lycopene production in E. coli through the identification of putative parameters and gene knockout targets through the use of stoichiometric
models. While these stoichiometric models do not address the issues of kinetics or regulation, they can still be useful in elucidating putative parameters and identifying key gene targets and metabolic nodes of interest.
4.1 Stoichiometric Model
We address these issues here computationally and experimentally in the context of lycopene synthesis in Escherichia coli. Our computational search makes use of a stoichiometrically balanced, genome-wide bioreaction network of E. coli metabolism whose fluxes are computed such as to maximize cell growth yield in the framework of Flux Balance Analysis (FBA) (Edwards & Palsson, 2000; Segre, Vitkup, & Church, 2002). Although this model is genome-wide and global for most metabolic reactions, it is important to note that it is a strictly stoichiometric model, totally devoid of any kinetic or regulatory information. Consequently, targets identified by this model improve product synthesis solely on the basis of increased availability of metabolic precursors and
cofactor balancing. This beneficial effect may be negatively impacted by non-predictive, adverse kinetic and/or regulatory effects.
We employed this formalism to investigate the effect of gene deletions, the most common means of introducing genetic perturbations, on lycopene production. The E.
coli iJE660a GSM model (Reed et al., 2003) served as the basis for this stoichiometric
network. Furthermore, the crtEBI operon was added to the model along with updated isoprenoid synthesis reaction details discovered after the formulation of this model (Adam et al., 2002; Hecht et al., 2001), as indicated in Table 4.1. Using this updated model, a total of 965 metabolic fluxes (included exchange fluxes) were calculated such as
to: (a) balance the rates of synthesis and depletion of 546 metabolites, (b) maximize cell
growth yield subject to a Minimization of Metabolic Adjustment (MOMA) alteration for suboptimal systems, and (c) utilize glucose as the sole carbon source (Edwards & Palsson, 2000; Segre, Vitkup, & Church, 2002). When multiple enzymes encode the same
from the stoichiometric matrix. To avoid selecting mutants with extremely low growth, a minimum growth requirement of 5 - 10 % of the maximum was enforced. Knockout candidates were compared on the basis of predicted production level after invoking the growth requirement.
Pathway Gene Reaction
Isoprenyl-pyrophosphate dxs T3PI + PYR -> DXP + CO2
synthesis pathway ispC DXP + NADPH <--> MEP + NADP
ispD MEP + CTP -> CDPME + PPI
ispE CDPME + ATP - CDPMEPP + ADP
ispF CDPMEPP --> MECPP + CMP
ispG MECPP <-- HMBPP
ispH HMBPP -> 0.5 IPPP + 0.5 DMPP
Isoprenyl pyrophosphate idi IPPP <- DMPP
isomerase
Farnesyl pyrophosphate ispA 2IPPP -> GPP + PPI
synthetase
Geranyltranstransferase ispA GPP + IPPP --> FPP + PPI Octoprenyl pyrophosphate ispB 5 IPPP + FPP -> OPP + 5 PPI
synthase (5 reactions)
Undecaprenyl pyrophosphate 8 IPPP + FPP -- UDPP + 8 PPI synthase (8 reactions)
Lycopene Pathway crtE IPPP + FPP -* GGPP + PPI
crtB 2 GGPP --> PHYTO + PPI
crtI PHYTO + 8 NADP - LYCO + 8 NADPH
Table 4.1: Modifications of the iJE660a model. The following reactions were added
to the stoichiometric model to account for lycopene production. Metabolite abbreviations are included in Table 4.2.
Abbreviation Metabolite
CDPME 4-diphophocytidyl-2-C-methyl-d-erythritol
CDPMEPP 4-diphosphocytidyl-2-C-methyl-2-phosphate-d-erythritol DMPP Dimethylallyl pyrophosphate
DXP 1 -deoxy-d-xylulose-5 -phosphate FPP trans, trans Farnesyl pyrophosphate GGPP Geranylgeranyl PP
GPP trans Geranyl pyrophosphate
HMBPP 1 -hydroxy-2-methyl-2(E)-butenyl-4-diphsophate IPPP Isopentyl pyrophosphate
LYCO Lycopene
MECPP 2-methyl-d-erythritol-2,4-cyclodiphosphate MEP Polyol 2-C-methyl-d-erythritol-4-phosphate OPP trans Octaprenyl pyrophosphate
PHYTO Phytoene
PPI Pyrophosphate
PYR Pyruvate
T3P 1 Glyceraldehyde 3-phosphate UDPP Undecaprenyl pyrophosphate
Table 4.2: Metabolite abbreviations for the modified iJE660a model. The reactions
listed in Table 4.1 utilize the following metabolite abbreviations which were either created or used from the original model.
4.2
Identification of putative parameters
Utilizing the tools of FBA with the combination of the MOMA addition for suboptimal systems, characteristic phenotype behavior can be extracted for the carotenoid system. Before investigating the impact of gene knockouts, the formalism of FBA may be used to help elucidate key putative parameters influencing lycopene titers.
4.2.1
Growth rate and glucose uptake
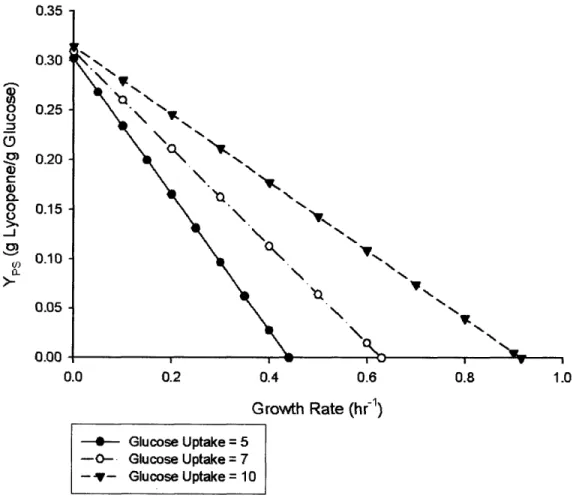
Initial simulations using FBA resulted in determining the relationship between growth and glucose uptake rates and the molar yield of lycopene. Figure 4.1 illustrates typical simulation data indicating that maximal lycopene yield is achieved at a decreased growth rate with a high glucose uptake rate. In this case, two parameters were imposed: glucose uptake rate was set as a fixed constraint for the model, whereas the desired growth rate was set through imposing a ceiling for the value of growth rate in the constraints. While solving this problem subject to the maximization of growth, it is possible to deduce the influence these variables have on lycopene yield. Furthermore, these results indicate that the maximum, theoretical biocatalyst yield of glucose to lycopene by E. coli is approximately 0.31 g lycopene / g glucose, in the absence of growth.
4.2.2 Formate production
Beyond growth rate analysis, the formalization of FBA may be used to determine the impact of byproduct formation on lycopene yield. This impact may be assessed by
impact on lycopene production. Such an analysis was conducted for several byproducts including acetate and ethanol and most resulted in an inverse linear relationship
illustrating that as carbon was diverted to the byproduct, less ycopene can be formed. However, the analysis of lycopene production as a function of formate production showed a two-phase behavior, especially at reduced growth rates. Figure 4.2 illustrates that formate production is indeed inversely proportional to lycopene yield. However, at lower growth rates, formate production is reasonably tolerable up to a critical threshold between 5 and 10 mmol formate/hr. After this level, formate production is strictly competitive with lycopene production. These results highlight the fact that formate should be reduced, and raise the possibility of a unique metabolic function revolving around the formate node of metabolism.
Maximum Lycopene Yield vs. Growth Rate and Glucose uptake ' \ VL N N N 'V, " N% 0.2 0.4 0.6 0.8 Growth Rate (hr-1) - Glucose Uptake = 5 -0- Glucose Uptake = 7 -v- GlucoseUptake = 10
Figure 4.1: Impact of growth rate and glucose uptake rate on ycopene stoichiometric yield. A stoichiometric analysis of lycopene yield highlights that
lycopene is produced at higher yields when cell growth is reduced and glucose uptake rates are maintained high.
0.35 0.30 0.25 0.20 0.15 0.10 U) 0 0 0. 0m 0 0~ 0.05 0.00 0.0 1.0
Maximum Lycopene Yield vs. Formate Production 0.35 0.30 v) U) 8 c-0) Q).a) C 0. 0 >., -J0, Li) 0. 0.25 0.20 0.15 0.10 0.05 0.00 0 5 10 15 20 25 mMoles Formatethr
Figure 4.2: Impact of formate production on ycopene stoichiometric yield. Formate is a competitive byproduct to lycopene yield by diverting carbon away from the desired
molecule. However, it is interesting to note two phases in this relationship between formate and lycopene yield. Formate production is relatively tolerable at production levels lower than 5-10 mmoles per hour. Above this level, formate is strictly competitive,
especially at reduced growth rates. - Growth = 0
- -0- - .Growth = 0.1 --- Growth = 0.2 ... v... Growth = 0.3
4.2.3 Oxygen
uptake rate
A stoichiometric analysis suggests that the lycopene yield in E. coli from glucose increases with oxygen uptake rate, presumably due to the large energetic requirement of lycopene production (8 CTPs and 8 ATPs per mole). Figure 4.3 illustrates the
relationship between oxygen level and the stoichiometric ycopene yield.
Stoichiometric yield of lycopene as a function of oxygen
U) 0 0 (D 0) >) a) 0L
-j
0) U) 0. 0.35 0.30 0.25 0.20 0.15 0.10 0.05 0.00 0 1 2 3 4 5 6 7in sifico 02 uptake rate (mmol/h)
Figure 4.3: Impact of oxygen on lycopene stoichiometric yield. An in silico analysis
using global stoichiometric models indicates that the maximum stoichiometric yield (g lycopene / g glucose) increases as a function of the oxygen uptake rate. In this
calculation, the glucose uptake rate was set at 5 and the maximum yield of lycopene was calculated (thus at a growth rate of zero).
4.2.4 Carbon source optimization
Carbon source optimization is often an elaborate, trial-and-error based experiment for most bioprocess applications. However, the infrastructure of FBA allows for the quick evaluation of single and complex carbon sources. While glucose is often a carbon source of choice due to economic constraints, it may not be the best for a given
bioprocess. A number of carbon sources were used as feed sources in the FBA simulation for lycopene production, which may be easily compared to experimental results. While glucose was a good carbon source, the simulation suggested that trehalose would give a higher yield, while glutamate was a worse carbon source. These
comparisons are shown in Figure 4.4 which illustrates how FBA may be used to
preliminarily evaluate the potential for varied carbon sources. Furthermore, this figure is juxtaposed with experimental validation of these carbon sources which relatively support
the findings of the stoichiometric analysis.
4.2.5
Summary
In general, these simulations revealed important general trends and relationships between lycopene yield and controllable factors. Therefore, these relationships suggest the need to reduce the growth yield, maintain a relatively high glucose uptake rate, maintain aerobic conditions, and minimize byproducts, especially formate to support enhanced lycopene production. Many of these parameters can be controlled through the
optimization ofbioreactor design parameters and control strategies. Furthermore, these fundamental relationships serve as underlying principles behind selected gene knockout targets described in the next section.
FBA 0.016 ~ 0.014 E ~ 0.012
-.s
0.01 ~ .~ 0.008 > ~ 0.006 4> g.0.004 o ~ 0.002 oGlucose Trehalose Fructose Glutamate Xylose
Carbon Source Experimental 7 .---.-.----.---.---- .. ---1 6 i ::J 0,5 E ";4 c: ~3 o ~ 2 ---J o
Glucose Trehalose Fructose Glutamate Xylose Carbon Source
Figure 4.4: Carbon source optimization. Lycopene yield was analyzed as a function of carbon source. These results juxtapose in silico results (left, blue bars) with experimental results (right, red bars), which highlights a general consensus between experimental and computational approaches.
4.3 Single gene knockout targets
Beyond defining putative relationships between growth rates or byproducts and product formation, global stoichiometric models may be used to identify gene knockout targets (Burgard, Pharkya, & Maranas, 2003; Segre, Vitkup, & Church, 2002). As such, it is possible to simulate a knockout phenotype of every possible gene in the genome in very short computational times compared with the arduous task of creating each of these mutants experimentally. Using the standard stoichiometric constraints and objective function of growth rate maximization subject to the MOMA constraint (Segre, Vitkup, & Church, 2002), it is possible to identify gene knockouts which will naturally result in an increase in lycopene yield due to a rearrangement of the bioreaction network to favor different modes of cofactor regeneration or precursor balancing. Assessing the
performance of all possible gnee knockout targets in the stoichiometric model yields a genome-scan, from which targets may be identified. It is possible to place a constraint of minimum growth to allow for the selection of experimentally feasible gene knockout
targets.
4.3.1 Single knockout genome scan
Using the stoichiometric model along with a maximum growth objective function subject to a MOMA alteration, in silico genome-wide gene knockout simulations were conducted. The phenotype of specific gene knockouts was simulated by deleting the corresponding enzyme (i.e., reaction) from the stoichiometry matrix and calculating the resulting flux profile. When multiple enzymes encode the same reaction (as is the case
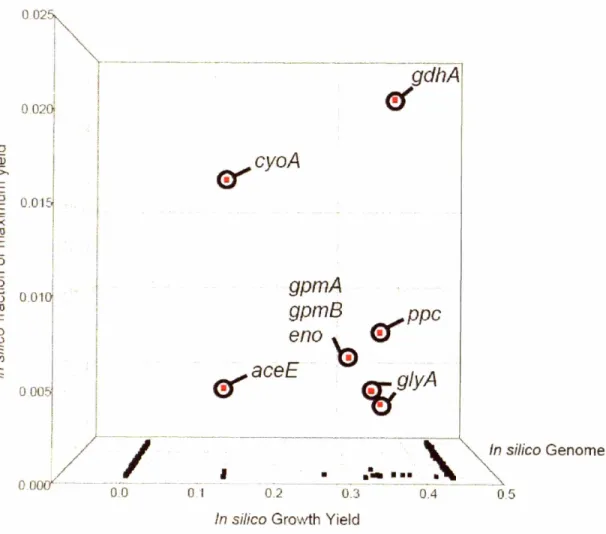
with isoenzymes), all instances of that reaction were removed from the stoichiometric matrix. To avoid selecting mutants with extremely low growth, a minimum growth requirement was enforced. Knockout candidates were compared on the basis of predicted production level after invoking the growth requirement. Figure 4.5 summarizes the results of this genome scan for single gene knockout mutants. This genome scan
identifies eight single gene knockouts which would produce a higher yield of lycopene by direct enhancement of the lycopene pathway and, indirectly, by lowering growth yield.
Figure 4.5 illustrates that most knockouts are not predicted to increase lycopene yield. Furthermore, all of the candidate knockouts show a reduction in the predicted growth