Detecting and Analyzing Bursty Events on Twitter
by
Pau Perng-Hwa Kung
Submitted to the Program in Media Arts and Sciences, School of
Architecture and Planning
in partial fulfillment of the requirements for the degree of
Master of Science in Media Arts and Sciences
at the
MASSACHUSETTS INSTITUTE OF TECHNOLOGY
September 2016
@
Massachusetts Institute of Technology 2016. All rights reserved.
A uthor ...
Certified by...
Signature redacted
Aufst 15, 2016
Signature redacted
4f
Deb Roy
Associate Professor of Media Arts and Sciences
Thesis Supervisor
Accepted by
...
Signature redacted
e Maes
Academic Head, Program in Media Arts and Sciences
MASSACHUSES INSTITUTE
DEC 12 2016
LIBRARIES
Detecting and Analyzing Bursty Events on Twitter
by
Pau Perng-Hwa Kung
Submitted to the Program in Media Arts and Sciences, School of Architecture and
Planning
on August 15, 2016, in partial fulfillment of the requirements for the degree of
Master of Science in Media Arts and Sciences
Abstract
This thesis presents BurstMapper, a system for detecting and characterizing bursts of tweets generated by multiple sources in order to understand interactions between Twitter users and the role of exogenous events (not directly observable on Twitter) in driving tweets. The first stage of the system finds temporal clusters, or bursts of tweets. The second stage characterizes bursts along two dimensions, semantic
coher-ence and causal influcoher-ence. Semantic cohercoher-ence measures the semantic relatedness of
the tweets in a burst to each other based on a deep neural network derived embedding of tweet contents. Causal influence measures the potential causal interaction between Twitter users using the Hawkes process model.
We introduce an annotated corpus of 7,220 tweets produced by five leading candi-dates in the 2016 U.S. presidential election. Evaluating the system on the annotated corpus shows that with a precision of 75%, tweets caused clearly by specific exogenous events (or responsive tweets hereafter) are detected by the burst detector components of our system. Furthermore, experiments show that the linear combination of seman-tic coherence and causal influence are predictive of the presence of responsive tweets in a burst, with the Fl-score of 0.76. Examining bursts along the two dimensions reveals that (i) the measures are positively correlated with each other (corr=0.33, p<0.001), (ii) the measures allow us to understand how candidates tend to respond differently to exogenous events, e.g., by attacking opponents or making plan announcements, and (iii) the measures can be used to describe the influence dynamics between can-didates over time. Plotting the bursts from a corpus of 1,470 Twitter accounts (the five leading candidates and the users followed by them) shows visual evidence that some user groups (e.g., campaign staffs, journalists, etc.) have a higher levels of se-mantic coherence and causal interactions. These experiments suggest that the bursts detected by our system provide a useful level of abstraction that summarizes tweet content, providing a solution for coping with massive amount of data on Twitter. Thesis Supervisor: Deb Roy
Title: Associate Professor, Program in Media Arts and Sciences
Acknowledgments
A huge thanks to the following people for making this thesis possible:
I would like to thank my advisor, Professor Deb Roy, for providing the research support for making this thesis happening in the first place. I am truly grateful for Deb's patience and the willingness to give guidance where needed. The process has not just been producing a good research, but also learning the key factors to be innovative and inspiring.
I would also like to thank Doctor Allen Gorin, who has been actively involved in
the research process and kindly shared many of his valuable research experience. I am also grateful of my thesis readers, Professor Csar Hidalgo, and Professor Ryan P. Adams for providing valuable comments and feedbacks that bring substance into this thesis. I would like to thank everyone in MASCOM: Chris and Sep for research and presentation feedbacks; Linda and Keira for patience and kindness to make sure the thesis progress goes accordingly to the institute rules.
It was fortunate to be around the truly great and inspiring LSM folks. I am truly thankful. In particular, I would like to thank Soroush who gave really valuable research feedbacks and pointers, Prashanth for kindly providing data and the awesome Tweet2Vec model, Mina and Neo for kind support and consultation, and Amber and Heather for providing every resource necessary to expedite the research process.
I would like to thank my dear friends for being a great source of emotional support,
especially Benjamin and Ken, whom I can truly trust and rely to share visions, and know there are still amazing folks back in my home country who inspire me to also be a more intelligent, kind, empathetic person.
Also, many thanks to my family, Mom and Dad, for their support in pursuing a long-time goal/dream of coming to the MIT.
Lastly, and most importantly, I would like to thank my girlfriend, Ying-Ju (Ruthy), for continual support and love. If there is anyone to dedicate this thesis to, it would be her. I am in gratitude beyond words.
Detecting and Analyzing Bursty Events on Twitter
by Pau Perng-Hwa Kung
This masters thesis has been examined by the following:
Professor Ryan P. Adams .
If
Signature redacted
Thesis Reader Associate Professor and Head of Advanced Technologies Group Harvard University and Twitter
7
Detecting and Analyzing Bursty Events on Twitter
by Pau Perng-Hwa Kung
This masters thesis has been examined by the following:
Signature redacted
Doctor Allen Gorin ....Thesis Reader Research Affiliate and Visiting Scholar Johns Hopkins University and Massachusetts Institute of Technology
Detecting and Analyzing Bursty Events on Twitter
by Pau Perng-Hwa Kung This masters thesis has been examined by the following:
Signature redacted
Professor C esar A. Hidalgo ...
Thesis Re Associate Professor of Media Arts and Sciences
Massachusetts Institute of Technology
Contents
1 Introduction
1.1 M otivation . . . .
1.1.1 Bursts in tweets . . . .
1.1.2 Properties of tweet bursts . . . .
1.2 Approach and Contributions . . . .
1.3 Thesis Overview . . . .
2 Related Works
2.1 Communication Influence . . . .
2.2 Detecting Bursts on Twitter . . . . 2.3 Modeling Semantic Representation on Twitter 2.4 Modeling Influence and Propagation on Twitter
2.5 Modeling Behaviors on Twitter . . . .
3 Methodology 3.1 Definitions . . . . 3.2 Overall Objective . . . . 3.3 Overview of BurstMapper . . . . 3.4 Topic Categorization . . . . 3.5 Burst Detection . . . ...
3.6 Attribute Mapping of Tweets
3.6.1 Semantic Mapping . . . . 3.6.2 Temporal-Causal Mapping 13 19 19 21 21 23 24 25 25 26 26 27 28 29 . . . . 2 9 . . . . 30 . . . . 3 0 . . . . 3 1 . . . . 3 3 . . . . 34 . . . . 34 . . . . 34
3.7 Burst Characterization and Data Exploration . . . . 36
3.7.1 Burst Characterization . . . . 36
3.7.2 Querying from the Bursts . . . . 37
4 Evaluations 41 4.1 Datasets Description . . . . 41
4.1.1 Detailed Description of Datasets . . . . 42
4.1.2 Label Annotation . . . . 42
4.2 Evaluating Burst Detector . . . . 43
4.3 Evaluating Measures for Burst Characterization . . . . 44
5 Data Explorations 47 5.1 Deeper Dive in FiveCandidates . . . . 47
5.2 Exploring the FiveCandidatesExpanded Dataset . . . . 52
5.3 BurstMapper v.s. Traditional Approaches . . . . 54
6 Conclusion 57
A Algorithms 59
B Election Topic Descriptions 61
C Data Annotation Details 63
List of Figures
1-1 Time series of daily tweet volume by three 2016 U.S. presidential
can-didates from July 2015 to April 2016. . . . . 20
1-2 Tweet time series by three 2016 U.S. presidential candidates on two election topics, with fitted constant-rate Poisson Process. . . . . 20
1-3 Two tweet burst examples . . . . 22
3-1 An example showing how tweet series S is divided into sub-user and sub-topic streams S"; SI. A=1 day. . . . . 30 3-2 The overall pipeline for the proposed framework BurstMapper . . . . 32 3-3 Architectural schematic of the tweet topic classifier. . . . . 32
3-4 The schematic burst detection algorithm. The enlarged figure shows how using the residual signal can filter many tweets that are not due to exogenous events. . . . . 33 3-5 Architectural schematic of the deep learning-based tweet semantic
em-bedding model, Tweet2Vec. . . . . 35 3-6 Graphical illustration of how to compute the two characteristic burst
m easures. . . . . 38 3-7 Schematic of the burst query procedure, with sample query results on
two election topics. . . . . 39
4-1 Tweet counts per topic and the proportion of examples per each label-ing category. . . . . 43 4-2 Precision and recall of correctly identified timestamps containing
re-sponsive tweets. . . . . 44
4-3 The receiver-operating characteristics (ROC) curve of the classifier on
responsive burst classification task. . . . . 46
5-1 Mapping the bursts onto semantic coherence-causal influence plane with respect to each presidential candidate . . . . 49
5-2 Heatmap of Sanders' tweeting activity in terms of the burst measures. 50 5-3 Mapping information influence networks over time for election topic terrorism . . . . . 51
5-4 Burst mapping with regard to semantic/causal measures for each type of voice group over all candidates. . . . . 53
5-5 Mapping of measure variability within burst per voice group for each candidate. ... ... .. ... ... ... . 54
5-6 Mapping of bursts relevant to topic Guns, highlighting the incident of Sandy Hook controversy due to Sanders remarks. . . . . 55
C-1 A sample question that each worker is asked to label. . . . . 64
C-2 Question template. . . . . 64
List of Tables
4.1 List of Topics . . . . 41
4.2 A list of features used in regression analysis. . . . . 45
4.3 Overall performance burst classification over 22 election topics . . . . 45
5.1 Detailed description of events in each region specified in Figure 5-3. . 52 5.2 List of Popular Hashtags in the topic Guns for voices Clinton follow. . 55 B.1 Explanation for each of the 22 election topics. . . . . 61
B.2 Explanation for each of the 22 election topics (cont'd). . . . . 62
D. 1 Feature coding for the features used in regression analysis. . . . . 65
D.2 Feature significance over 22 election topics. . . . . 66
D.3 Feature significance over 22 election topics (cont'). . . . . 67
Chapter 1
Introduction
1.1
Motivation
In recent years, the micro-blogging site Twitter' has become a major social media platform for hundreds of millions of users. These users tweet about their lives, share opinions, and discuss issues across a variety of different topics. The open-access and mutually visible nature 1111 of the platform makes it an ideal place for interested people to explore how different individuals and organizations interact and respond to social signals.
Developing an understanding for how tweets are generated is non-trivial. Take the tweets posted by the 2016 U.S. leading presidential candidates as an example. A naYve way to explain the tweeting events is by fitting a Poisson Process, in which a candidate tweets without being influenced by other candidates or exogenous events. Figure 1-1 shows the daily tweet volumes for the candidates, with the fitted constant-rate Poisson Process. Chi-square test reveals that the fitted Poisson Process variance significantly underestimates the sample variance of the tweet series. This is also true when we consider tweets filtered by election topics2
(see Figure 1-2). As an another challenge, explicit interactions between voices do not occur frequently. In our example, candidate mentions account only 12% of all topic-filtered tweets. Therefore,
1
http://www.twitter.coni
2
Here we apply the trained election topic classification model a.s proposed in [511 19
John KasIch Donald Trump Ilillary Clinton
L
~L I ~Figure 1-1: Mapping of July 2015 to April 2016.
three presidential candidates' X-axis is discretized with day
daily tweeting volunie from as the time unit. The fitted Poisson Process mean is plotted as the dashed line, with green band being the t2o-range. Right panel shows the data, histogram and fitted Poisson Process' distribution.
Topio TP'To.u -... .. . .. Top.. G.-A 12 10 CN. -7 3 2 I ... ...
i 1
.6o
m--Figure 1-2: Tweet series with thu same candidates and time span as in m--Figure 1-1, filtered by election topics terrorism and guns. The panels with colored vertical lines show tweets with explicit mentions of other candidates.
there may be influences not directly observable on Twitter that drive a candidate to decide when to tweet, and what to tweet about.
What if there was a tool to help us understiand the interactions between Twitter users and the roles of exogenous events (not directly observable on Twitter) in driving tweets? This was the motivation for developing BurstMapper, a tool for detecting and characterizing tweet bursts to provide a useful level of abstractioH for summarizing tweet events.
Donald Trump Hillary Clinton
John Kasich
1.1.1
Bursts in tweets
Before describing our approach, we first explain what a tweet burst is. A burst of tweets is a temporal cluster with high density of tweeting activities. In the study of human dynamics, burst is a commonly observed phenomenon in everyday activities (e.g., E-mailing, web-browsing) [3][48][26]. For a bursty series of events, the distribu-tion for inter-event arrival time often follows a heavy-tail distribudistribu-tion. We confirm this characteristic with our candidates tweeting example (a=1.13, reflective of the observed a ~ 1 for human activities 148])3.
The occurrence of burst is often understood as a result due to the presence of some exogenous events. Therefore, we have reasons to believe bursts on Twitter capture significant information on user activities.
1.1.2
Properties of tweet bursts
Understanding the characteristics of a tweet burst can help us describe the roles user interactions and exogenous events play in driving tweets. To develop intuitions for characterizing bursts, let us zoom-in Figure 1-2 to examine a week-long series of tweets, as shown in Figure 1-3. For the tweets on topic terrorism, there is a burst of tweets right after the Paris shooting incident [171 in November 2015, in which the candidates expressed similar semantic contents by emphasizing their anti-ISIS stance. It is noteworthy that Hillary Clinton announced her anti-ISIS policy plan a few days after the shooting, in contrast to her usual disengagement on the subject. For the tweets on gun control, whenever Hillary Clinton tweets, notice how Ted Cruz quickly responds by supporting Second Amendment rights. By observing the coordination in relative tweet timing, one can speculate potential influence from Clinton to Cruz.
3a is the parameter for fitting P(T) = r- on inter tweet arrival v.s. probability log-log plot,
with log-binning.
21
Terror Ism 15 ch 4 I - Tum 2 0 11-13 11:14 11-15 11-16 11-17 11-18 11-19
'Our goal is .t tOdler or ctain
ISIS. but to deleat and destroy ISIS. -Atary
DO youmatssitlatys bot opeadh on
combating (efrorisrnm ee r
th*ngs you should know: The dsatl tl otof Iraq
which I C4pposed has urvldtm
- egul ondf ICed t the Use ofabed
and ISIS PDehattWithBemit
We need a Pvesitden who "oys Ie'
deftCO radicA tilamic troOStt but
oary o topak t m
#DstmDebate
iWeCtotwa-otttattolotr ItISMUt
tW iped out. #Pans
U , hould ImmrdIotety Work o-t,
Ates to Destroy ISIS AParts
Preiden, Oettttjad 'ISL cuntwoe, to shtnki anmin-ewC
just ho-rs before the horrible attark
in Pants ta ,Just W bad ' C
ttAN,-Guso
Leotarnmoetabout il@JohrtKtashs
NatI Secuay Plan that I oAke
America sale, &ap. defeat ISIS
Roegu-ao tom Sjns are ;oo posg
'JO r, oUrgemotrt0 Oty Wo knows
hotheyare ,omeoutdbetSS
is our presen insa e
C.C - ods
0
10-25 10-26 10-27 10-28 10.29 10-30 10-31 More lie lost W, need sensble
tttn itolence prevenvon measureel,
and we eed tthm now.
W , H dto y fight to p gvent q I
a-oance- 'ei sho tte safew
you go to sdhoo. heit vo go to toe ego>s. teen tiutgo tyo ttch s o
I eooy deting ot Seottd Amhondmrent u xringi alo
r4 fun toot #2A
Join is %A-p efend our 2nd
Amendmnx t riqhtto keep &3'tp.
ber n br2A
We oan't wait at longjo to leep ao
Comnttittleh safe We ned to atl on
to- otence pevento
PGOPdebate
.RT @AMCrlohtic, Horw d,,i
@- dCu end ts tt, week? By
ptoacat htitig I
Figure 1-3: Two particular instances: (Top) Terrorism tweets after the Paris shooting in Nov, 2015. (Bottom) Gun control tweets debate in Oct., 2015.
1.2
Approach and Contributions
The main objective in this thesis is to develop a system that detects tweet bursts and analyzes them by their characteristics. We are particularly interested in bursts in which tweets due to exogenous events occur (hereafter responsive bursts)4. A
successful system should be able to identify many responsive bursts, and the analysis of burst characteristics should reveal interesting ways a user responds to exogenous events.
In this thesis, we propose BurstMapper, a system to detect and analyze the potential drivers to a tweet time series by multiple user sources in terms of tweet bursts. BurstMapper first applies a topic classifier to generate topic-filtered tweet series. Next, a burst detection algorithm is used to extract temporal clusters with high density of tweets. We then characterize bursts along two dimensions of analysis:
semantic coherence that measures the semantic relatedness of tweets in bursts using
a deep neural network derived embedding of tweet contents, Tweet2Vec [54]; causal
influence that measures the potential causal interactions between users by applying
Hawkes Process
125],
which infers an influence network based on relative event timing.BurstMapper provides a new tool to examine how exogenous events play a role
in how a, user responds on Twitter. This approach differs from previous works that use only partial semantic information (e.g., hashtags, URLs) to analyze information influence on Twitter. Additionally, BurstMapper aims to cope with information over-load by providing a useful abstraction that summarizes tweet content and potential user interactions. The framework therefore offers the capability for efficient data ex-ploration. Lastly, our framework is modular, so we can substitute with better models of Twitter semantics and temporal causality if needed.
In a nutshell, BurstMapper makes the following contributions:
* We design a burst detection algorithm to extract temporal clusters of high density tweets. Also, to characterize bursts, two measures are designed along
4
Tweets due to exogenous events do not occur very often. Based on our annotated corpus, only 8% of the tweets are influenced by other voices, with another 30% of tweets triggered by news events. It is therefore important to distinguish responsive bursts in order to examine exogenous event-caused tweets in more detail.
the dimensions of semantics and potential causal interactions. The two mea-sures can be linearly combined as features for classifying responsive bursts. To our knowledge, this is the first work that applies state-of-the-art semantic and temporal-causal models to characterize tweet bursts.
9 We create a manually annotated corpus of 7,220 election related tweets by five leading U.S. presidential candidates from 2015 to 2016, where each tweet is labeled as whether it is caused by exogenous events or not.
e Each component in our system is evaluated on the annotated corpus. Experi-mental results show improvements over benchmark methods in evaluating burst quality and responsive burst classification.
o Exploratory data analysis is performed on the annotated corpus, and a larger dataset that includes the candidates and the users followed by them on Twitter. Analysis reveals how the two measures can help us observe different ways a can-didate responds to exogenous events. Testing on the larger dataset reveals how certain groups of users may have a higher level of potentially causal interactions and semantic coherence. Lastly, a small case study discusses how
BurstMap-per provides a more information-rich level of abstraction for summarizing tweet
content, in comparison to alternatives using only partial semantic information like hashtags.
1.3
Thesis Overview
Chapter 2 discusses the related research works and explains how this thesis differs from them. Chapter 3 introduces the BurstMapper system. Chapter 4 describes data collection, and evaluation results of the system. Chapter 5 demonstrates exploratory data analyses on two datasets using BurstMapper. Lastly, we conclude by discussing the implications of our findings, limitations, and future directions.
Chapter 2
Related Works
This thesis shares connections with research works concerning communication influ-ence and behavior modeling on Twitter. This chapter briefly explains these works and discusses their relations to the thesis.
2.1
Communication Influence
Influence is an important notion in communication theory that explains how people interact. Specifically, several theories of influence include: (i) cognitive dissonance
1181-
one may act to correct the perception of surroundings that become inconsistentwith her prior beliefs, (ii) social judgement theory [271- a change in attitude is con-trolled by one's judgement of social context and the effects the change brings, (iii) elaboration likelihood model [431- one's change of attitude is determined by how she thinks about the persuasive content communicated by others, and (iv) the theory of reasoned action [11- one's reaction is the dual process of her own attitude and
learn-ing from attitudes of others. Influence is also a major concept in many other social
science domains. In political theory for example, rhetoric, lexical expression, and interactions can dictate the progTession of political discourse [71 or election
1291.
In computational linguistics, there has been active interest in underdstanding what affects one's word choice in a conversation. Recent works have applied probabilistic topic modeling to map thematic change in language use; scholarly impact can then
25
be measured by observing coordinating shifts in topic distributions between authors
1191.
Another approach analyzes variations in word usage due to the powerdiffer-ence between individuals
191.
Additionally, a recent work1241
proposes probabilisticlanguage model that directly considers person-to-person influence.
Notice that the mentioned concepts share a mental model in which influence is due to both implicit bias and observing others. In our thesis, BurstMapper is inspired by this mental model. Therefore, we hope the proposed framework can serve as an alternative tool for data exploration in these fields. Also, this work differentiates from works in computational linguistics in that this thesis focuses on how content could stimulate communication events to occur.
2.2
Detecting Bursts on Twitter
Detecting a temporally coherent, or high density region of tweets has close connections to event detection in data streams, where bursts of tweets correspondingly imply
changes in data's global latent state
1301.
In the context of Twitter platform, eventdetection is a well-researched topic. One popular way to detect events is to track use
patterns of popular and informative words
136][8].
Another way is to segment timewhere text-based measure for newsworthiness is used to rank potential event segments
[34]. Other works have proposed generative models of text to directly model varying semantic distribution given time [131.
In this thesis, burst detection is used to extract time regions with unusual in-tensities of tweeting activity. In particular, BurstMapper deploys a frequency filter
1561,
rather than incorporating semantic information. This design choice allows us toexplore a greater variability in the semantic characterization of bursts.
2.3
Modeling Semantic Representation on Twitter
There has been a wealth of research on developing computational methods for mod-cling tweet contents. Many of these works have been task-driven, where specific
methods are designed for sentiment classification [401112][51, syntactic annotation
1391,
speech acts classification
153],
stance detection [501, among many other use cases. Typically, these works construct machine learning models12811551,
or novel features110113111441
tailor-made for the given research tasks. These works provide a sampleview of the vibrant, and fast changing research landscape in modeling tweet contents. Very recently, a line of research emerges for modeling Euclidean embedding for tweet contents. Inspired by the widely popular Word2Vec model proposed by Mikolov et al. [371, researchers have started to apply different shallow to deep neural network architectures to learn the tweet semantic embedding [5411501. This thesis focuses on
applying the established models that provide an expressive representation of tweet
semantics.
2.4
Modeling Influence and Propagation on Twitter
Since Twitter is an online social platform, an important research question is to under-stand influence. Many research works focus on the network structure of the following relations and interactions among users
12][58].
Other works have taken the idea fur-ther to summarize social context16],
rank users157],
detect rumors152],
etc. Our work differs by using both content and timing-based influence to provide an understanding of potential drivers for tweets, which provides a different perspective to influence on Twitter.A particular case of influence that involves relative timing of events is information
propagation. Propagation of information consists of a user exposing to information, and adopting the information based on her social neighbors. The seminal work of Gomez-Rogriguez et al. [22] models the observed cascades (e.g., retweets, photo reshares) with an underlying influence network. Subsequent works have extended [22] by providing more scalable parameter optimizations [15][20][211, using out-of-network information [381, as well as exploring other factors of influence like burst in product item popularity 147][601.
Amidst the research progress, Hawkes Process [251 is a recently popularized
alter-27
native model. This thesis focuses on Hawkes Process because it models multivariate discrete time series (and not just series of cascades), which is more general. Re-searchers have applied the model to explain dependencies among a set of social
inter-action
14][42][611,
topic cascades [16], and tweet streams
11411591.
This thesis focuses
on a purely application perspective, where in particular we adopt the discrete-time
Hawkes Process proposed by Linderman et al. [351.
2.5
Modeling Behaviors on Twitter
The news-like [32] and openly accessible nature of Twitter has inspired works to
understand Twitter users on a population level, such as predicting election
1461,
studypolitics [451, inferring health outcomes [411, etc. These works often concerns with profiling users in terms of their demographic attributes and use of words. This thesis focuses on tweet bursts and mapping them along the dimensions of semantic and temporal-causal properties. BurstMapper aims to serve as a general tool for providing useful levels of abstraction for summarizing tweet content, where the other works aim to solve case-specific data science problems.
Chapter 3
Methodology
3.1
Definitions
To start, we first describe the data setting used in the thesis. Assuming the data is given in the form of a discrete series of tweet events S = {ei, ... , e1sI}. Each tweet event
is generated by a source user account u E U = {1, ... ,
IUJ}.
A tweet e,, is denoted as ae, = (eC, e , e?,, e,, e,, el) tuple, with tweet raw data: time e', user identity ec, when
the user previously tweeted eP, and content C,; as well as content-derived meta-data: topic classification e-, and categorization of stimulus e2.
Additionally, note we can subdivide or filter the original series S of tweet events. First, the tweet time series generated by user u is denoted by the superscript S".
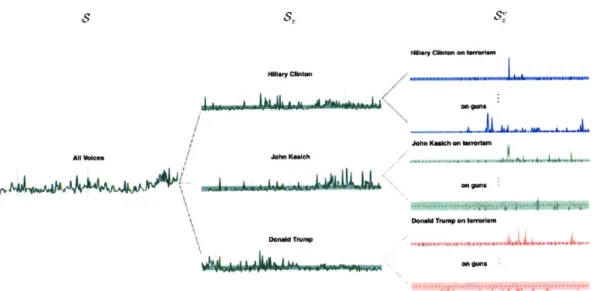
Second, we use the underscript z to denote events filtered by topic z, so that S'" is the tweet series by user u regarding topic z. Figure 3-1 illustrates how a raw tweet time series can be subdivided into multiple tweet series per candidate and by topic.
We also define the discrete time series representation of S as Ts. More formally, Ts(i) describes the number of event counts occurring between At * i < t < At * (i + 1)
for some i, where At is the size of discrete time step. All time series operations use discrete time series representation, with At = 1 day unless otherwise noted.
A burst B t = {Vej E S s.t. e" E [tr, ty]} is defined as a temporal cluster of tweets in time interval [tx, ty]. Specifically, a burst is responsive if there exists some tweets in the burst that are caused by exogenous events, e.g., breaking news or tweets by
S S.
Hillary Clinton on terrorism
Hillary Clinton
-- Aon guns
John Kasich on terrorism All Voices John Kasich
A L on guns
Donald Trump on terrorism
Donald Trump
on guns
Figure 3-1: An example showing how tweet series S is divided into sub-user and sub-topic streais S"; S". A-1 day.
other users.
3.2
Overall Objective
The main objective in this thesis is to develop a system that. detects tweet. bursts and analyze the bursts by their characteristics. Therefore, the first measure of success iin tie syste is the ability to reliably produce bursts of tweets in which many tweets are caused by exogenous events. The second measure of success is how well analysis using the characterizations of tweet bursts can help reveal anything interesting about how a user responds in the face of exogenous events.
3.3
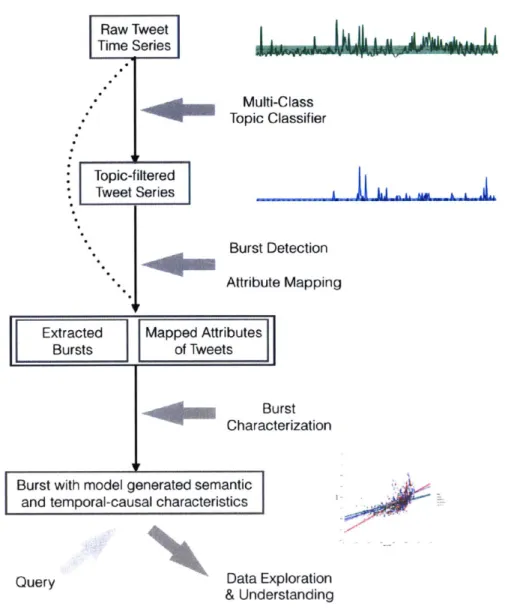
Overview of BurstMapper
With the objectives in mind, we introduce BurstAlapper, a system to ident-ify and characterize bursts in tweet time series. Figure 3-2 displays the overall structure of the system. There are several stages to BurstAlapper
*
Topic
Filtering: Given tweet series by m-ultiple sources, we filter the seriesinto per-topic subbands using a trained topic classifier [511 to provide topic annotation e2.
" Burst Detection: Given the topic-filtered series of tweets, a burst detection
algorithm extracts high-density regions of tweet events.
" Attribute Mapping of Tweets: The content for each tweet is embedded in a high
dimensional Euclidean space, based upon term-occurrence. This is then reduced onto a latent semantic feature space by applying the state-of-the-art Tweet2Vec model [541.
For the topic-filtered series over multiple users u, Hawkes Process [251 is used to determine influence from user u' to u at time t by inferring an underlying influence network based on relative event timing.
" Burst Characterization and Data Exploration: Now, each burst can be mapped
along the two dimensions of characterization, semantic coherence and causal
influence, conputed based on the semantic and temporal-causal feature
nap-ping of tweets. Using the two measure of the tweet bursts, one can design a classifier that uses the linear comnlbination of the features for responsive burst classification. Further, examining bursts along the two dimensions can reveal interesting ways users respond to exogenous events.
For the remainder of this chapter, each component of BurstAiapper is explained in greater detail.
3.4
Topic Categorization
We want to annotate topic category for each tweet in the original tweet series S. For
this purpose, a multi-class topic classifier is used to label topics for the tweets.
Burst ilapper adopts a convolutional neural network based word embedding model
for training tweet topic classifier as suggested in Vijayaraghavan et al.
1511.
Figure3-3 illustrates the model architecture. It begins by mapping the tweets to n-gram word
31
Multi-Class Topic Classifier Raw Tweet Time Series Topic-filtered Tweet Series Burst Detection Attribute Mapping
Extracted Mapped Attributes Bursts of Tweets
Burst
Characterization
Burst with model generated semantic and temporal-causal characteristics
Query Data Exploration
& Understanding
Figure 3-2: The overall pipeline for the proposed framework BurstMapper
70
1 D Convolution :T 1D Max pooling
:6
Figure 3-3: The scheniatic of the (oiiputat.ioinal et al. [51] for develop)ig a. tweet topic classifier
archit ectture used in Vijayaraghavan
I
Ii
~II7
Cony & Max
pooling Flatten
l
Fully connected
A
.
Low-pass frequency filter Compute residual
R
Residual Series--m.dua posAtwred 4i emnt cauna &ent Extract Bursts 3f0 320 340 3&0 LUmcretized ImestampsResulting Bursts F- B H urst Inteival
Figure 3-4: The schematic burst (etection algorithm. The enlarged figure shows how using the residual signal (an filter many tweets that are not, due to exogenous events.
enibeddings. Afterwards, the n-gram word embedding is passed to a, convolutional neural network for supervised classification, with topic annotation determined by the highest score in the softmax layer. In this thesis, we use the pre-trained election topic classifier in [51], with reported F1 score for the topics to be 0.90.
3.5
Burst Detection
The aim of burst detection is to extract temporal clusters of high density tweets.
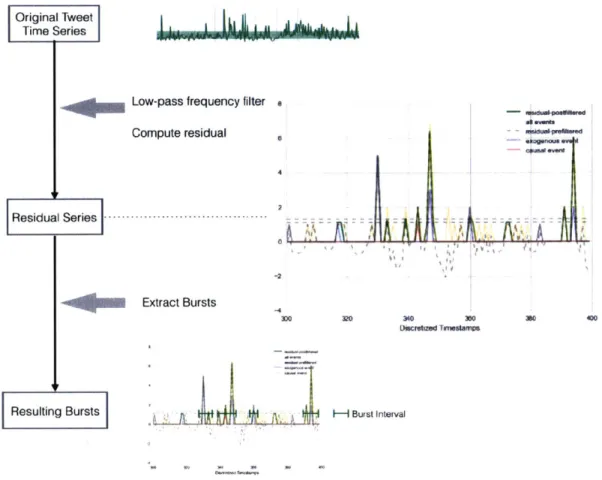
BurstAIapper applies a. two-step procedure for detecting bursts:
(1) Computing residual signal- the series S; filtered by topic is passed through
a high-pass frequency filter. The filter is constructed by first. transforming TS into
33 Original Tweet
Time Series
Ts using Butterworth filter (this removes sporadically occurring events). Next, the residual signal is computed as rs = Ts - is. The values of rs are set to 0 if at any
given time t, rs(t) is less than some threshold.
(2) Extracting bursts- now, given rs, we apply a simple greedy algorithm to output bursts. We slide a time window through rs, and concatenate timestamps t into time interval [tm, ty] with rs(t) > 0 into Bs.
Figure 3-4 illustrates the process. Note that the right diagram shows how the tweets caused by exogenous events can be captured by the residual series. The overall burst detection algorithm is summarized in Algorithm A-1.
3.6
Attribute Mapping of Tweets
3.6.1
Semantic Mapping
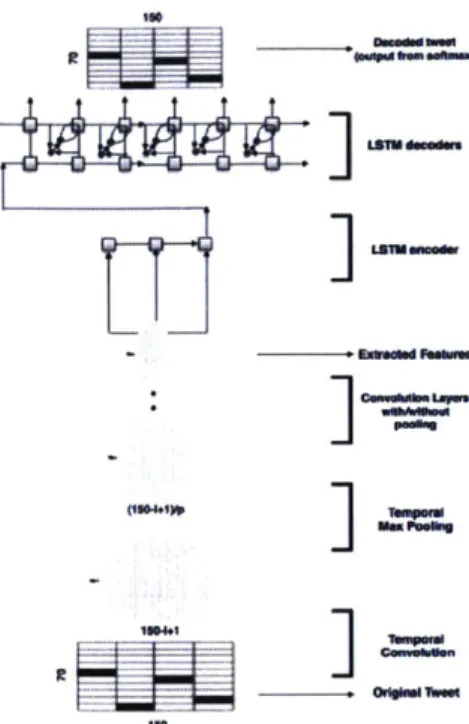
BurstMapper adopts the Tweet2Vec model [541 for mapping the tweet contents onto
a 600-dimensional latent semantic feature space. Tweet2Vec is a recently proposed model for embedding tweet that achieves state-of-the-art results on measuring seman-tic similarity [541. The model learns semanseman-tic embedding based on a character-level
CNN-LSTM encoder-decoder architecture. After the model is trained, for any given
tweet e,, with content en, we use the encoder portion of Tweet2Vec to produce the 600-dimensional latent semantic embedding features e""'. Figure 3-5 displays the architecture.
3.6.2
Temporal-Causal Mapping
For temporal-causal mapping of tweets, we adopt the Hawkes Process model [251. Hawkes Process is a point process in which the frequency of event occurrence depends on the event history. It is dictated by the intensity function of time, denoted by A(t) as describing the expected event occurrence frequency at time t. Hawkes Process corresponds to Poisson Process with varying-rate in discrete time domain.
LSM.codaM
ILSTU
fe - Extraad Feabwft (150-1.1W Temlparal 1504.1] 150Figure 3-5: The schematic of the computational architecture used in Vosoughii t al.
[541 for developing Tweet2Vec, vector embedding of tweet, content.
time, An(t), that describes user a's frequency of tweet.s. is:
extrinsic influence
A, (t) + a3
rb(ti)
(3.1)p, is user u's tweeting frequency, independent of other users. E
a,'j(tjti)
accountsthe historical influence of other users i' on u's tweeting frequency, where (' (edscribes
user-to-user influence from i' to it. 6/(tjtf) is a. time-decaying weight function to discount influence over time. For convenience, define A11 1(t) =
o'',t(tlti).
Note that Hawkes Process is a forin of Generalized Linear Model, and the parameters(Va correspond to regression-based Granger Causality
1231.
See1251[35]
for details.In this thesis, BurstMapper applies the discrete-time Hawkes Process [35].
To fit a Hawkes Process model for S,,, jointly consider A1,(t) for all users - that
corresponds to tweeting frequency for series S'. One can learn the model parameters
by \ILE learning on data, log-likelihood. 35
To account the dynamic nature of tweet time series, Hawkes Process is fitted multiple times on a sliding time window W (length W) through time. For each tweet
es, we have its corresponding causal influence mapping e"aU:
e;""Z=ZAec(t)(.2
t:tEW U' (3.2)
essentially accounting user influence averaged over all time windows where t E W.
3.7
Burst Characterization and Data Exploration
3.7.1
Burst Characterization
Given the extracted bursts, and the semantic and temporal-causal mapping of the tweets, we now compute the two measures of bursts characteristics.
Semantic Coherence
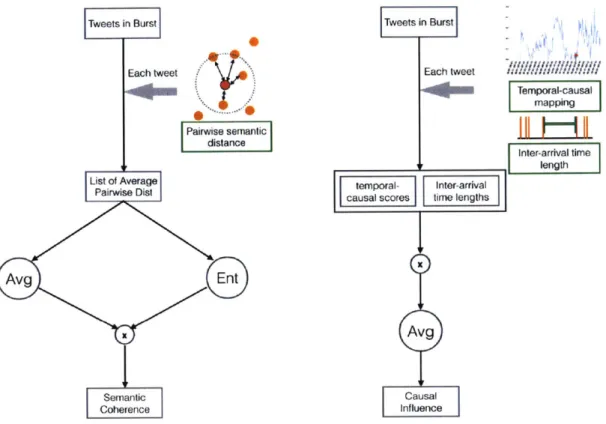
The first measure is semantic coherence. The intuition is that if users participate in
similar sub-topic discussion, the pairwise semantic similarity among tweets should be high. Additionally, if many people participate in the same sub-topic, then it is likely to have wider variability in content expression. Specifically, for burst B,, we have:
1
SO s S ttv = -* Avg(m) * Ent(m)
Z
(3.3)
where m [e-"C'7 F, j E kNN(i) Vej E S s.t. et E [t,,t ]]
where Z is the normalizing constant. Basically, for each tweet ej in the burst, we first compute the average of the semantic distances between ej and its top-k nearest neighbors (which are tweets by other users). This results in an array, m. To compute semantic coherence, the average (Avg) and entropy (Ent) of m are computed.
Causal Influence
Causal influence aims to measure temporal-causal activity level within a burst. Using the temporal-causal mapping of the tweets, we have:
1
CIss = -I * Avg(g)
13xt Z (3.4)
where g = [e" * (e - e) Vej E S s.t. et E [tX, ty]]
The basic intuition is that e"1 computes the level of potential causal influence of users i' on the tweet ei. O(ei - ev) computes the wait time between tweet ej and
when the user last tweeted.
Applying the Two Measures for Characterizing Bursts
In the later chapters, we will show that by linearly combining the two measures for a burst, one can develop a classifier for identifying responsive tweet bursts. Also, we will show that mapping the bursts along the two dimensions can reveal interesting ways different users generally respond to exogenous events.
3.7.2
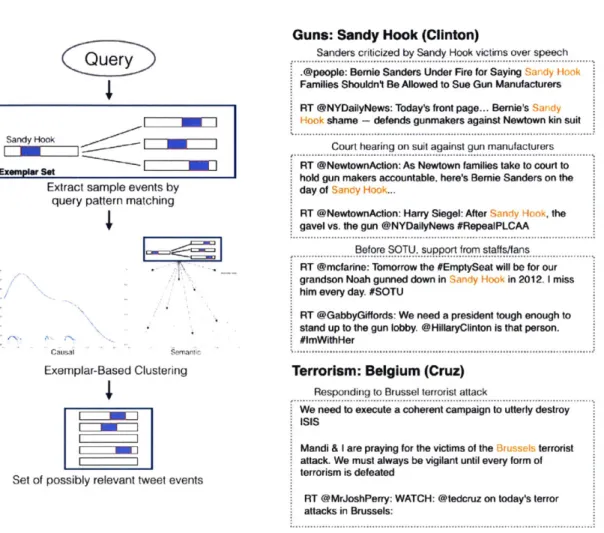
Querying
from
the Bursts
As the system churns raw tweet series and outputs the detected bursts that are mapped along the two measures, we also want to be able to search the bursts accord-ing to some queries of interest. Naive query pattern matchaccord-ing may fail to retrieve semantically and temporally similar tweets that do not contain the query terms. We apply a simple two-step procedure. First, we extract a set of seed tweets based on those with matching query terms. Second, we apply an exemplar-based clustering algorithm
1331
using the seed tweets as examples. The similarity between pairs of events for clustering algorithm is computed assim(ei, e2) = e (3*Ie C F(--)*MIau _ auIF) (3.5)
37
Tweets in Burst Each tweet Pairwise semanic distance List of Average] Pairwise Dist Avg Ent x Semantic Coherence Tweets in Burst Each tweet Temporal-causal mapping inter-arrival time length temporal- Inter-arrival
causal scores time lengths
Avg
Causal Influence
Figure 3-6: A graphical explanation of how the two proposed burst characters
inea-sures are computed given the tweets and their corresponding attributes in a, burst. (Left) Computation of semantic coherence; (Right) Computation of causal influence.
After the cluster IDs are assigned, instances that are far away from the assigned cluster centroids will be dropped. In the end, the process returns bursts that contain tweets closest to the center of the assigned cluster id. This process is described in Algorithm A-2. Figure 3-7 displays the procedure visually, as well as samJple results
based on two queries ("Sandy Hook" for the Sanders remark controversy: "Belgium"
for the terror attack). Notice how the returned contents are semantically relevant to the query term.
Qu ery
Sandy Hook -- _ Exemplar Set
Extract sample events by query pattern matching
'I!
Exemplar-Based Clustering
i I
Set of possibly relevant tweet events
Guns: Sandy Hook (Clinton)
Sanders criticized by Sandy Hook victims over speech
.@people: Bernie Sanders Under Fire for Saying Families Shouldn't Be Allowed to Sue Gun Manufacturers RT @NYDailyNews: Today's front page... Bernie's
shame - defends gunmakers against Newtown kin suit
Court hearing on suit against gun Manufacturers
RT @NewtownAclion: As Newtown families take to court to hold gun makers accountable. here's Bernie Sanders on the
day of ...
RT @NewtownAction: Harry Siegel: After gavel vs. the gun @NYDailyNews #RepeaPLCAA
the
Before SOTU. support from staffs/fans RT @mcfarine: Tomorrow the #EmptySeat will be for our
grandson Noah gunned down in in 2012- I miss
him every day. #SOTU
RT @GabbyGiffords: We need a president tough enough to stand up to the gun lobby. @HillaryClinton is that person.
#lmWithHer
Terrorism: Belgium (Cruz)
Respoidiring to Brussel terrorist attack
We need to execute a coherent campaign to utterly destroy
ISIS
Mandi & I are praying for the victims of the terrorist
attack. We must always be vigilant until every form of
terrorism is defeated
RT @MrJoshPerry: WATCH: @tedcruz on today's terror attacks in Brussels:
Figure 3-7: (Left) The schemiatic of the process to query tweet. events base1d oil the
two measures; (Right) Two examlples of retuirned tweets using the event-based queries.
Chapter 4
Evaluations
4.1
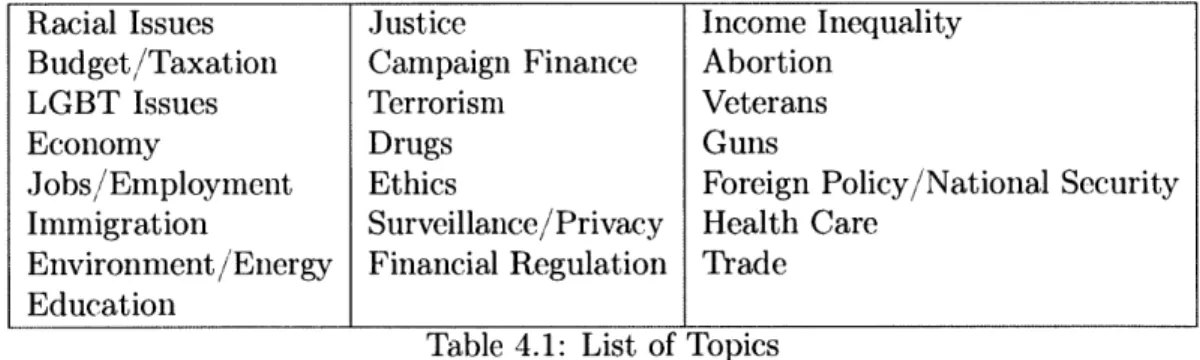
Datasets Description
To evaluate BurstMapper, we focus on tweets relevant to the 2016 U.S. presidential election. We map each tweet to one of 22 election topics (excluding the 'Others' category, see Table 4-1, Appendix B explains the definition for each topic in more details), based on the pre-trained model used in [511.
Racial Issues Justice Income Inequality
Budget/Taxation Campaign Finance Abortion
LGBT Issues Terrorism Veterans
Economy Drugs Guns
Jobs/Employment Ethics Foreign Policy/National Security
Immigration Surveillance/Privacy Health Care
Environment/Energy Financial Regulation Trade Education
Table 4.1: List of Topics
Two datasets are used for evaluation experiments. The first corpus, named
Five-Candidates, provides annotated data based on historical tweets by five U.S. leading
presidential candidates' for the 2016 election. The second dataset, called
FiveCandi-datesExpanded, is obtained by considering a larger set of users of both the candidates
and the accounts followed by them on Twitter.
'Candidates: Hillary Clinton, Bernie Sanders, Ted Cruz, John Kasich, and Donald Trump. The list is selected based on the candidates that were still running in April, 2016.
4.1.1
Detailed Description of Datasets
FiveCandidates
In order to collect the tweets, we use GNIP's2 Historical Power Track to obtain the
five candidates' tweet history. We are able to obtain tweets from May 2nd, 2015 to May 2nd, 2016, totaling 29,016 tweets. After passing through topic categorization
funnel that filters tweets in the 'Others' category3, we are left with 7,220 tweets,
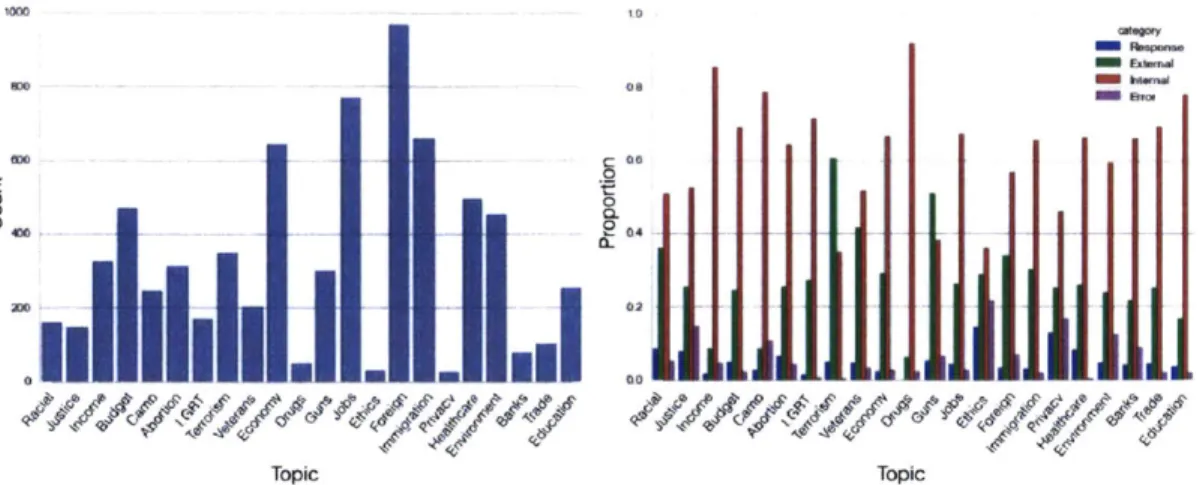
comprising of 25% of all tweets. Figure 4-1 (Left) shows the tweet count distribution.
FiveCandidatesExpanded
To collect the tweets for the second dataset, we use the Twitter Public API to obtain users that the five candidates follow. We apply a profile-based examination to filter accounts that may potentially be celebrities (those with number of followers more than 500,000). The historical tweets by the new set of users are extracted from Jan 1st, 2016 to May 2nd, 2016. We further filter users with less than 3 tweets related to any of the 22 topics. The preprocessing steps result in a total of 1,470 users with 117,648 tweets after applying topic categorization filter.
4.1.2
Label Annotation
The FiveCandidates dataset additionally undergoes a manual labeling process to clas-sify whether a tweet is caused by some exogenous events. We resort to Amazon Mechanical Turk to have online workers to do the labeling. Each tweet can be cat-egorized as: (i) Response (tweet influenced by tweets of other voices), (ii) External (tweet influenced by breaking news events), (iii) Internal (tweet not due to exogenous events), and (iv) Error (tweet where topic categorization errs). Figure 4-1 (Right) shows the resulting proportion of tweet categories, with the worker agreement of 0.70
2
GNIP(http://gnip.com) is a service provider (acquired by Twitter) for social media data inges-tion. It has a "Historical Power Track" that enables search-back-in-time capabilities to Twitter's historical tweets.
3
There are 21796 'Others' tweets, in which the candidates elaborate on personality/credibility, polls, campaign events, etc. An example: 'RT
@FoxNews:
.Otedcruz: "#SuperTuesday revealed pretty powerfully that the only candidate who has a path to beating ArealDonaldTrump is me.'l0 a
Topic Topic
Figure 4-1: Left: Count of events for each of 22 topics. Right: the labeled proportion deternined by nianually labeling.
(3+1 AMT "dedicated workers per tweet )4.
For the purpose of the experinlents, the Response and External categories both account for the type of tweets caused by exogenous events. Note the relatively low proportion of External and Response tweets. It is therefore understandable that correctly identifying all tweets caused by exogenous events would be difficult.
4.2
Evaluating Burst Detector
The first evaluation tests how well the burst, detector (BurstDetector) is able to produce bursts with reasonable quality. We want the tiine regions extracted by the bursts to include a, high proportion of tweets Caused by exogenous events (a.k.a.
responsUIe tweets). Since the time region due to each burst is a collection of discrete
tiniestamps, the evaluation metrics is comlputed as: (i) Precision- Prob(time stamps in the bursts of responsive tweets I tie stamplls of all bursts), and (ii) Recall- Prob(tinie stamps in the bursts of responsive tweets I all time stamps of responsive tweets).
To compare against the proposed method, two competing baselines are used. The
4
To control for the subjective nature of online workers (their decision might be biased by their view of the election). we invited a dedicated worker who is knowledgeable of the election background, and gave hii a few hours training with detailed instructions. We provided him an annotated corpus of 30 tweets (labeled by the author), in which he was able to answer with over 85% accuracy. We weighted his answers with 2 votes.
I
II
Topic Topic
Figure 4-2: Left: Precision of correctly idlentify the timnestampli Containing externally
stimulated tweets. Right: Ru all 1)10t.
first b~aseline (Sigmoid) applies a thresholded sigmoidl activation t~o the tweet volume time series. The transformed series is passed to a greedly group)ing procedlure for p)rocducing 1)ursts. The second b)aseline (Kleinberg)[1301 is a commnonly used methodl that captures 1)urst a~s state transitions dlescribing the tweet time series.
Figure 4-2 shows the results. The result shows that while naive ba.selines such a~s Sigmnoid has high recall, in exchange, the precision dr1op~s significaitly.
Klein-berg is not complarabIle in perforlmanice due to the model assuniption that the events
are homogeneous. On Twitter, tweets are clue t~o a comlplex set of influence. The assumption behind IKleinberg's detection method would't suit this dataset well.
4.3
Evaluating Measures for Burst Characterization
The next phase of evaluation applies the measures to classify whether a burst is
resp~onsive (for such bursts, let the dlefault minimum number of responsive tweets
within a burst le 1). The goa~l of this evaluation is t~o test whether the p~rop~osed measures for characterizing 1)urst are in fact informative.
To get some inspiration, we run a logistic regressi!n test to see how semantic
coherence and causa~l influence measures, as well a~s feature interactions, are significant
Temporal-Causal Semantic Interactions
eWu Avg(m) &FtU * Avg(m)
O(ei - el) Ent(m) e'a-u * Ent(m)
CI SC eF * SC
(ef - ej) * Avg(m)
(ej - e ) * Ent(m)
q(e - et ) * SC
CI * Avg(m) CI * Ent(m)
CI * SC
Table 4.2: A list of features used in regression analysis.
of 1 if the datum is a responsive burst, and 0 otherwise. A test is performed on each topic-filtered series S, (for a list of variables, see Table 4-2). Result shows that each feature, as well as the feature interaction across categories, show certain amount of significance for fitting the logit model (see Appendix D for more details).
Method Precision Recall Fl-Score
Random 0.574 1.0 0.678
Causal Interaction Only 0.664 0.755 0.702
Semantic Only 0.777 0.698 0.734
Joint Features 0.774 0.754 0.761
Table 4.3: Overall performance burst classification over 22 election topics
With the developed intuition, the next test aims to construct a responsive burst classifier to see how can the measures be practically applied. The classifier model being used is the standard Gradient Boosted Tree Classification' trained on the entire corpus. For the features, the components for each measure, shown in Table 4.2, are linearly combined as part of the feature vector. The feature vector also includes a binary vector of topic category ID.
There are 1,030 detected bursts, of which 574 are labeled responsive. A model is trained on each election topic, and evaluated with a 5-fold cross validation. The results are summarized in Table 4-3, where we also display the naive result by ran-domly guessing 1. When employing features associated with both semantic coherence and causal influence, the performance provides non-trivial improvement over random
5
Hyperparameters are tuned to be: estimator number-50, sub-sample rate-0.5, max depth-3 45
Figure 4-3: The receiver-operating characteristics (ROC) curve of the classifier on responsive burst classification task.
baseline, as well as using features associated with only a, single measure (8% 3% improvement in Fl-score).
To better understand the performance of the binary classifier, Figure 4-3 also shows the overall receiver-operating characteristics (ROC) curve that shows the per-formance of a classifier as the discrimination threshold is varied. This lot can help us to understand the trade-offs between false-positve(False Positives '(False Posi-tives+True Negatives)) and truc-positive (True Positives, (True Positives+ True Neg-atives)) rates. Depending on the application and how sensitive one is to getting false positive errors, the classification threshold can be changed accordingly. For example, at a tolerance of 24% false positives, the system can achieve almost 90% precision.
Remark The burst detector 'classifier extracts 1000 bursts from the 29,000 tweets
in the FiveCandidates corpus. This is a data reduction of 1000 29000, or 30-fold. Furthermore, the system selects about -66% of those 1000 bursts, e.g. 660 bursts. This provides a data reduction of 660 '29000 , or 44-fold. To sunnarize, this met-hod of "coping with information overload" involves: first, an aggregation from tweets to
Chapter 5
Data Explorations
In this chapter, we want to examine the datasets in more detail to see how using the two measures to analyze burst can help reveal interesting ways users respond to exogenous events. In particular, three case studies are presented:
" We examine FiveCandidates corpus in greater detail. The detected bursts are mapped along the semantic coherence and causal influence measures to explore how exogenous events drive each presidential candidate to tweet differently. " Data exploration is further tested on the Five CandidatesExpanded dataset. Here
we examine if the measures can reveal how certain groups of users may have a higher level of semantic coherence and potential causal interactions.
" The last case study discusses how BurstMapper delivers useful findings not
pro-vided by analyzing tweets with only partial semantic information like hashtags, URLs, etc.
5.1
Deeper Dive in FiveCandidates
Given the extracted bursts, a natural next step is to see how the bursts are charac-terized along the two dimensions, semantic coherence and causal influence. We focus particularly on candidate-level analysis to understand how a candidate becomes re-sponsive to exogenous events.
For each burst, we compute the semantic coherence and causal influence measures. Specifically, the measures are computed with respect to the tweets by the particular candidate within a burst. We plot all bursts on a semantic coherence by causal
influence plane. The motivation is that some bursts are not necessarily both highly
semantically coherent and temporally causal, and it is thus interesting to explore
under what situations might bursts not have high values for both measures1. The
results are plotted in Figure 5-1.
We first examine the region with high semantic coherence and high causal influence measures for a burst. Comparing the bursts between Hillary Clinton and Bernie Sanders, observe how Sanders' bursts are mostly about addressing and attacking his fellow candidates. On the other hand, Clinton focuses more on addressing supporters and announcing policy plan when major breaking news events occur.
Upon closer inspections on Sanders' tweets, he has been relatively vocal on topics where other candidates tweet less frequently about (e.g., financial regulation, worker inequality, etc). Also, many of his tweets are not burst-related, but rather part of frequent promotions of his own ideology. However, it turns out Sanders becomes tem-porally responsive and semantically coherent on battleground topics to attack fellow candidates. Therefore, in terms of responsiveness to exogenous events, Sanders is actually more responsive than Clinton, where in contrast Clinton's tweets are consid-erably more composed and planned.
Now take a closer view at Clinton's tweets. When Clinton is temporally respon-sive and semantically coherent, she is usually responding to some important news events or controversial issues. One can observe that Clinton takes advantage of the opportunities to make speeches or plan announcements. Since these announcements take time to prepare, they often make Clinton slightly lag behind her competitors. To summarize, analyzing along the semantic coherence and causal influence measures can reveal different ways the candidates respond to exogenous events. We find that mapping the bursts along tile two dimensions also tell us how other candidates
re-'Temporal-causality measures if relative tweet timing between voices follows a consistent pattern. It is possible to have a burst not having strong temporal-causality between voices, but still be 'responsive' (e.g., a terror attack, which happens only a few times in a year, is such an example).