Divergent Routing of Positive and Negative Information
from the Amygdala during Memory Retrieval
The MIT Faculty has made this article openly available.
Please share
how this access benefits you. Your story matters.
Citation
Beyeler, Anna et al. “Divergent Routing of Positive and Negative
Information from the Amygdala During Memory Retrieval.” Neuron
90, 2 (April 2016): 348–361 © 2016 Elsevier Inc
As Published
http://dx.doi.org/10.1016/J.NEURON.2016.03.004
Publisher
Elsevier/Cell Press
Version
Author's final manuscript
Citable link
http://hdl.handle.net/1721.1/112737
Terms of Use
Creative Commons Attribution-NonCommercial-NoDerivs License
Divergent routing of positive and negative information from the
amygdala during memory retrieval
Anna Beyeler#, Praneeth Namburi#, Gordon F Glober, Clémence Simonnet, Gwendolyn G Calhoon, Garrett F Conyers, Robert Luck, Craig P Wildes, and Kay M Tye
The Picower Institute for Learning and Memory, Department of Brain and Cognitive Sciences, Massachusetts Institute of Technology, Cambridge, MA 02139
# These authors contributed equally to this work.
SUMMARY
Although the basolateral amygdala (BLA) is known to play a critical role in the formation of memories of both positive and negative valence, the coding and routing of valence-related information is poorly understood. Here, we recorded BLA neurons during the retrieval of associative memories and used optogenetic-mediated phototagging to identify populations of neurons that synapse in the nucleus accumbens (NAc), the central amygdala (CeA) or ventral hippocampus (vHPC). We found that despite heterogeneous neural responses within each population, the proportions of NAc neurons excited by reward predictive cues and of BLA-CeA neurons excited by aversion predictive cues were higher than within the entire BLA. Although the BLA-vHPC projection is known to drive behaviors of innate negative valence, these neurons did not preferentially code for learned negative valence. Together, these findings suggest that valence encoding in the BLA is at least partially mediated via divergent activity of
anatomically defined neural populations.
INTRODUCTION
The ability to appropriately recognize stimuli imbued with either positive or negative valence is critical for survival as well as mental health. The neural circuits underlying the assignment of valence to environmental stimuli are thought to be highly conserved in the mammalian brain (Janak and Tye, 2015) and are dysfunctional in psychopathologies including anxiety, depression and addiction (Allsop et al., 2014; Etkin and Wager, 2007; Lammel et al., 2014; Mervaala et al., 2000; Tye et al., 2011, 2013). Distributed and interconnected brain structures have been tied to valence coding (Berridge and Robinson,
To whom correspondence should be addressed: Kay M. Tye, 77 Massachusetts Ave, 46-6263, Massachusetts Institute of Technology, Cambridge, MA 02139, [email protected].
Publisher's Disclaimer: This is a PDF file of an unedited manuscript that has been accepted for publication. As a service to our
customers we are providing this early version of the manuscript. The manuscript will undergo copyediting, typesetting, and review of the resulting proof before it is published in its final citable form. Please note that during the production process errors may be discovered which could affect the content, and all legal disclaimers that apply to the journal pertain.
AUTHOR CONTRIBUTIONS
Conceptualization, AB, PN, KMT; Methodology, AB, PN, RL, GFC; Investigation, AB, PN, GFG, GGC, CS; Software, PN; Writing -
HHS Public Access
Author manuscript
Neuron
. Author manuscript; available in PMC 2017 April 20.Published in final edited form as:
Neuron. 2016 April 20; 90(2): 348–361. doi:10.1016/j.neuron.2016.03.004.
A
uthor Man
uscr
ipt
A
uthor Man
uscr
ipt
A
uthor Man
uscr
ipt
A
uthor Man
uscr
ipt
2003; Namburi et al., 2015a; Nieh et al., 2013), but real-time dynamics within circuits processing valence information during behavioral selection remain largely unexplored. The basolateral complex of the amygdala (BLA) receives inputs from multiple sensory
modalities (Bordi and LeDoux, 1992; Fontanini et al., 2009; McDonald, 1998; Pitkänen, 2000) and neurons therein respond to cues of both positive and negative valence (Paton et al., 2006; Shabel and Janak, 2009). However, the BLA contains a diversity of neurons projecting to different downstream targets (Pitkänen, 2000) known to drive opposing behaviors (i.e. approach and avoidance, Namburi et al., 2015b; Stuber et al., 2011), and the naturally-occurring firing patterns of these distinct subsets of BLA neurons during
information processing remain unknown.
Previous evidence suggests that valence assignment during memory retrieval is supported by differences in real-time activity among anatomically defined populations of BLA neurons. The BLA and nucleus accumbens (NAc) have been implicated in the formation of cue-reward associations (Ambroggi et al., 2008; Namburi et al., 2015b; Tye et al., 2008) and optogenetic activation of BLA terminals in the NAc drives positive reinforcement (Britt et al., 2012; Stuber et al., 2011). By contrast, the assignment of negative valence has been linked to BLA projections to the central amygdala (CeA, Amorapanth, 1999; Ciocchi et al., 2010; Goosens and Maren, 2001), and disconnection between the BLA and the CeA abolishes fear responses to cues associated with an aversive outcome (Jimenez and Maren, 2009). Valence processing in the BLA may also mediate innate emotional states; both the BLA and the ventral hippocampus (vHPC) are linked to anxiety (Adhikari, 2014; Etkin et al., 2009; Somerville et al., 2004) and optogenetic activation of BLA terminals in the vHPC increases anxiety-related behaviors (Felix-Ortiz et al., 2013).
We recently showed that projection-target-defined populations of BLA neurons play distinct roles in valence learning (Namburi et al., 2015b). However, the real time activity and mechanisms by which the BLA produces distinct emotional and motivational states have yet to be identified.
Here, we hypothesized that during the retrieval of positive or negative associative memories, opposite valences are encoded by anatomically divergent BLA circuits. Using an
intersectional, dual-virus approach, we employed optogenetic-mediated “phototagging” in combination with large-scale in vivo electrophysiological recordings to reveal the specific neural code of BLA neurons that synapse in the NAc, CeA or vHPC, in response to the presentation of cues associated with either rewarding or aversive outcomes.
RESULTS
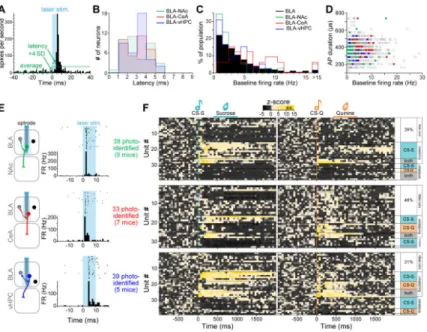
Optogenetic-mediated photoidentification of BLA projection neurons during retrieval
In order to “photoidentify” distinct populations of BLA neurons, we used a dual-virus approach to express the light-activated cation channel channelrhodopsin-2 (ChR2) in a subpopulation of BLA neurons, defined by axonal termination within a specific downstream region (NAc, CeA or vHPC, Figure 1A). To this end, we used an anterograde viral vector carrying a construct allowing for cre-dependent ChR2 expression in the BLA and a retrograde viral vector carrying cre-recombinase in the downstream target (see methods,
A
uthor Man
uscr
ipt
A
uthor Man
uscr
ipt
A
uthor Man
uscr
ipt
A
uthor Man
uscr
ipt
Nieh et al., 2015; Senn et al., 2014). This strategy allows specific targeting and identification of BLA neurons terminating in the region of interest and avoids spurious identification of BLA neurons sending axons of passage through this region, which is a shortcoming of electrical and optical antidromic stimulation. So that we could evaluate the activity of photoidentified cells during valence retrieval, we trained mice to discriminate between two auditory stimuli: one associated with a rewarding outcome of positive valence (sucrose) and the second associated with an aversive outcome of negative valence (quinine; Figure 1B-C). After mice learned the reward-predictive significance of the conditioned stimulus associated with sucrose delivery (CS-S), as indicated by licking after tone onset and before the delivery of sucrose (Figure 1C-D), we introduced a second auditory conditioned stimulus (CS-Q) associated with the delivery of a bitter tastant (quinine; Figure 1B). Mice initially generalized the two tones, exhibiting licking responses for both the CS-S and CS-Q, and progressively learned to discriminate between the two stimuli (Figure 1E, Movie S1). When the mice reached performance criteria for the sucrose association (at least 70% of sucrose deliveries collected during the session) and for the quinine association (at least 70% of quinine deliveries avoided during the session), we performed acute recordings in the BLA over two successive days in 21 animals (Figures 1D-G, S1).
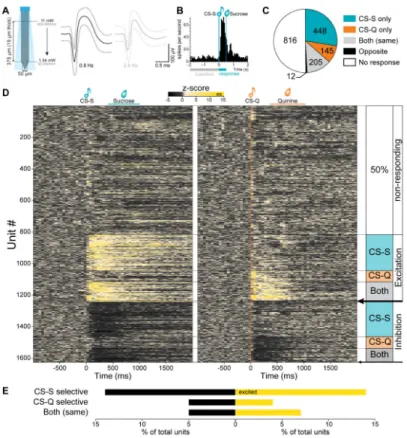
Half of BLA neurons respond to sucrose and/or quinine cues
To determine the functional response profiles of BLA neurons, recordings were performed with silicon optrodes (Figure 2A) and neural data were analyzed after histological
confirmation of the placement of the recording electrodes and of the spread of viral expression (Figures 1G, S1 and S2A). During each recording session, ~30 sucrose and ~30 quinine trials were presented, and the firing rate of every isolated unit was analyzed in response to the two cues. Of the 1626 neurons recorded in the BLA, 50% of the neurons were task responsive, meaning they showed a significant firing rate change in response to one or both cues (Wilcoxon signed-rank test, p<0.01, Figure 2B-D, Table S1). 28% of neurons significantly changed firing rate selectively during the conditioned stimulus associated with sucrose (CS-S) and 9% selectively during the conditioned stimulus associated with quinine (CS-Q). 13% of the units significantly changed their firing rate in response to both cues in a qualitatively similar manner (either excitatory or inhibitory responses), which we termed the “same” way, and less than one percent changed their firing rate in response to both cues in qualitatively distinct directions, which we termed “opposite” ways (Figure 2C). When averaging the proportion of cells responding with excitation or inhibition within the three categories (responsive to the CS-S only, responsive to the CS-Q only, and responsive to both cues in the same way) we found that 53±2% of the units showed excitatory responses while 47±2% showed inhibitory responses (Figure 2E, illustrated as % of total units).
We also tested the response of each unit to the unconditioned stimulus (US, Figure S2) and found that 32% of the units responding to the CS also significantly changed their firing rate during the first 500 ms after the delivery of the US (sucrose or quinine), while 18% responded to the US without changing their firing rate to the cues (Figure S2C-D). Overall, 50% of the units responded to the delivery of the US (Figure S2E). 37% of the units responded only during the sucrose delivery, 6% responded only during quinine delivery and
A
uthor Man
uscr
ipt
A
uthor Man
uscr
ipt
A
uthor Man
uscr
ipt
A
uthor Man
uscr
ipt
7% responded during both US deliveries (5.7% in a “same” qualitative way and 1.5% in qualitatively “opposite” ways, Figure S2E-F). Overall, we found that more cells were inhibited than excited by the US, irrespective of valence (34±3% excitatory compared to 66±3% inhibitory responses, Figure S2F).
BLA projectors send collaterals to multiple downstream targets
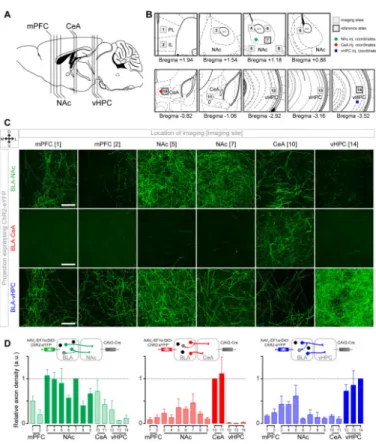
Because previous studies suggest that a subset of BLA neurons collateralize to multiple downstream targets (Shinonaga et al., 1994) we estimated the extent of collateralization in each of the BLA neural populations projecting to the NAc, CeA and vHPC by measuring fluorescence in multiple downstream targets of the BLA (Figure 3A-B) from animals expressing ChR2-eYFP selectively in one projector population (BLA-NAc, BLA-CeA or BLA-vHPC). This approach allowed us to evaluate the presence of neurites from each of these projection-target-defined populations, however, the presence of fluorescent processes may include fibers of passage and not faithfully represent functional synaptic terminals. We estimated the extent of collateralization based on membrane fluorescence relative to a reference location, shown in Figure 3B. Each of the three BLA projector populations sent collaterals to multiple downstream targets (Figure 3C), however the fluorescence within the intended target structure always surpassed that in the collateral regions we examined (Figure 3D). In the images we collected, the average relative fluorescence from BLA-NAc projector neurites outside the NAc was 33±9%. The collateral fluorescence observed for BLA-vHPC projectors was 24±5% and only 17±4% for BLA-CeA projectors. We found that BLA-NAc projectors expressed neurites extending across the NAc subregions, and outside the NAc to the medial prefrontal cortex (mPFC), CeA and vHPC (Figures 3C-D and S3). The relative fluorescence of BLA-NAc projectors in the CeA was 57% of the fluorescence in NAc ventro-lateral core, which could be partly due to axons of passage that do not locally terminate or form functional synapses. The BLA-vHPC projector population displayed more fluorescence in the medial than in the lateral NAc shell (paired t-test, t=3.77, p<0.05). However, there was no detectable difference in the amount of membrane fluorescence of BLA-CeA projectors between the medial and lateral NAc shell (paired t-test, t=0.67, p=0.27). Notably, among our samples, BLA-CeA projectors scarcely expressed membrane fluorescence in the vHPC (~1% relative eYFP fluorescence).
To quantify the extent of synaptic terminals from BLA-NAc projectors in the CeA, we expressed synaptophysin fused to the fluorescent protein mCherry (Calhoun et al., 1996; Oh et al., 2014). In mice expressing mCherry in the synaptic terminals and eYFP in the cell membranes of BLA-NAc projectors, the relative mCherry fluorescence in the CeA was only 20% (Figure S3A-B), while the relative eYFP fluorescence was 57% (Figure 3D). This finding suggests that BLA-NAc projectors collateralize to the CeA, albeit to a lesser extent than expected by quantifying neurite fluorescence alone, which likely includes fibers of passage.
A
uthor Man
uscr
ipt
A
uthor Man
uscr
ipt
A
uthor Man
uscr
ipt
A
uthor Man
uscr
ipt
ChR2-expressing neurons have shorter photoresponse latencies compared to non-expressing neighbors
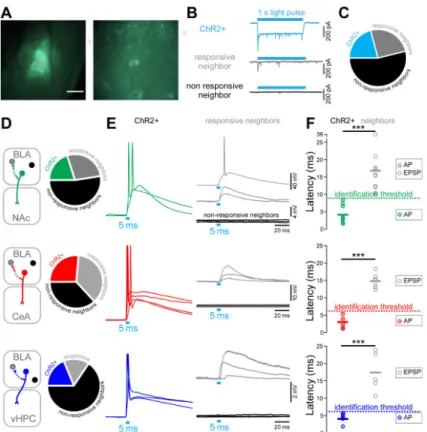
The BLA is known to be an epileptogenic region (Ben-Ari et al., 1980) and recurrent collaterals between pyramidal cells in the BLA have been anatomically described (McDonald, 1984). To unequivocally distinguish the BLA projection neurons expressing ChR2-eYFP (ChR2+) from the non-expressing neighbors that receive excitatory inputs from projectors in vivo, we empirically determined the photoresponse latencies ex vivo, where visual and electrophysiological validation of opsin expression is possible (Figures 4A-B and S4). We classified neurons in three categories using whole-cell patch-clamp recordings in the BLA (Figure 4B-C): (1) projectors that exhibit a peak/steady-state current, characteristic of ChR2-expressing neurons in response to a 1 s blue light illumination (ChR2+, 21% of 91 cells), (2) negative neighbors receiving direct or indirect synaptic input from ChR2-expressing projectors (responsive neighbors, 25%), and (3) ChR2-negative neighbors that did not respond to illumination (non-responsive neighbors, 54%). We then measured the latencies of the light-evoked action potentials (AP) or excitatory postsynaptic potentials (EPSPs) from the onset of a 5 ms light pulse to the peak of the response, in mice expressing ChR2 in NAc projectors (n=40 cells), in CeA projectors (n=19 cells), or in BLA-vHPC projectors (n=32 cells, Figure 4D). While all ChR2+ projectors fired after
photostimulation, only one of the responsive neighbors reached a suprathreshold response, with a latency of 17.3 ms (BLA-NAc neighbor, Figure 4E-F). Firing latencies ranged from 2-8 ms for BLA-NAc projectors, and were significantly shorter than the light-evoked EPSP latencies of their responsive neighbors (10-36 ms, Student t-test, ***p<0.01). BLA-CeA projectors expressing ChR2 responded faster than their responsive neighbors (1-5 vs 12-18 ms, Student t-test, ***p<0.01). Finally, the photoresponse latencies of BLA-vHPC projectors ranged from 2-5 ms and were shorter than the photoresponse latencies of their responsive neighbors (11-24 ms, Student t-test, ***p<0.01, Figure 4F). Based on these data, we defined the in vivo photoresponse latency threshold as 9 ms for the NAc-projecting BLA neurons, and 6 ms for both the BLA-CeA and BLA-vHPC projectors.
BLA projector populations differentially respond to sucrose and quinine cues
In order to perform optogenetic-mediated “phototagging” to identify BLA projectors in vivo, at the end of every recording session, we provided different patterns of photostimulation to compute the photoresponse latency and classify neurons as ChR2-expressing projectors (Figure 5A; see methods). After applying the identification threshold defined by our ex vivo recordings, we found a similar distribution of latencies across the three projector populations (Kolmogorov-Smirnov tests, p>0.05, Figure 5B). There were no detectable differences in the distribution of firing rates between the BLA-NAc and BLA-vHPC populations compared to the distribution in the BLA (Kolmogorov-Smirnov tests, p>0.05), while BLA-CeA
projectors have a different distribution of firing rates compared to all BLA neurons
(Kolmogorov-Smirnov test, p<0.01, Figure 5C). Finally, there were no detectable differences in the distribution of the action potential duration (peak-trough) between each of the three projector populations compared to the BLA distribution (Kolmogorov-Smirnov tests, p>0.05, Figure 5D). Altogether, 7% of the units recorded met our criteria for
photoidentification (Figure 5E; see methods). We found that 61% of BLA-NAc projectors were cue-responsive, compared to 50% in the entire set of BLA neurons, while BLA-CeA
A
uthor Man
uscr
ipt
A
uthor Man
uscr
ipt
A
uthor Man
uscr
ipt
A
uthor Man
uscr
ipt
and BLA-vHPC projecting populations contained 52% and 69% cue-responsive units, respectively (Figure 5F).
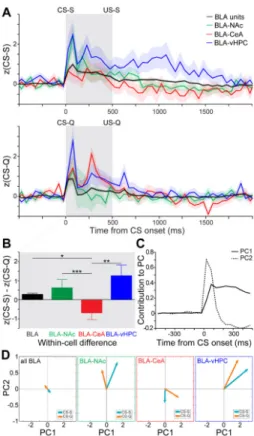
To visualize the response of each projector population to sucrose and quinine cues without applying any predetermined categories, we computed the average z-score of all recorded BLA neurons, BLA-NAc, BLA-CeA and BLA-vHPC projectors (Figure 6A) in response to the sucrose cue (CS-S) and to the quinine cue (CS-Q). We compared z-score distances between the CS-S and CS-Q among the four populations (average within cell differences for BLA=0.28, BLA-NAc= 0.63, BLA-CeA= −0.69, and BLA-vHPC=1.26; Figure 6B) and found that the response profile of BLA-CeA projectors differed from each of the other three groups (Kruskal-Wallis test, p<0.001, BLA-CeA post-hoc comparisons: to BLA-NAc ***p<0.001, to BLA *p<0.05, and to BLA-vHPC **p<0.01, Figure 6B).
To compare CS representation dynamics in BLA projector populations, we projected the z-score time course of each neuron from 500 ms before to 500 ms after cue-onset onto a two-dimensional space using principal components analysis (PCA, Figures 6C-D and S6). The time period between 100 and 500 ms after the cue-onset contributed to the component explaining the highest amount of variance in the dataset (PC1), while the first 100 ms following cue-onset contributed the most to the second principal component (PC2, Figure 6C). Interestingly, PC1 separates responses to the sucrose and quinine cues in all populations as illustrated by the separation of the CS-S and CS-Q vectors along PC1 (Figures 6D, S6B-C). Additionally, PC2 separates the responses between the projector populations, especially separating CeA projectors from NAc and vHPC projectors (Figures 6D, S6C). Altogether, the PCA of the z-score time course suggests that the late cue-response (≥100 ms) contains more information regarding the valence of the cue, while the early cue-response (≤100 ms) contains more information regarding the projection target of the cell.
BLA neurons projecting to NAc and CeA preferentially code for opposite valence
After classification of the units depending on their qualitative response type, we found heterogeneity within each population (Figure 7A-B). We categorized the functional responses into six classes: selectively excited by the CS-S, selectively excited by the CS-Q, excited by both cues, selectively inhibited by the CS-S, selectively inhibited by the CS-Q, or inhibited by both cues (Figure 7C-D). Examination of the population profiles of specific projector responses reveals noteworthy absences: for example, zero BLA-NAc neurons were excited by the CS-Q and zero BLA-CeA neurons were inhibited by the CS-Q (Figure 7C). When comparing the proportions of neurons excited or inhibited by one cue (Figure 7D), we found a larger proportion of BLA-NAc projectors excited by the CS-S (10/13 units; 77%), compared to the entire BLA neural population (228/448 units, 51% in the BLA, binomial distribution, +p<0.1, Figure 7D). We also found that all BLA-CeA projectors responding only to the quinine cue showed an excitatory response (5/5 units; 100%), compared to 71/145 units (49%) of the BLA units (binomial distribution, *p<0.05). We also observed that all recorded BLA-NAc projectors that responded only to the quinine cue showed inhibitory responses (2/2 units, 100%, Figure 7C-D). Regarding responses to the unconditioned stimuli (Figures S5 and S7), we did not detect differences in the proportion of excitatory and inhibitory responses to the sucrose and quinine cues (binomial distribution, p>0.05).
A
uthor Man
uscr
ipt
A
uthor Man
uscr
ipt
A
uthor Man
uscr
ipt
A
uthor Man
uscr
ipt
Finally, we compared the response profiles to the conditioned stimuli in the BLA neural population as a whole and in the three projection-target-defined BLA populations using different classification criteria for the representation of valence previously described in the literature (Figure 7E, for review see Namburi et al., 2015a).
Using a simple classification emphasizing cue selectivity (termed “valence selectivity” in Namburi et al., 2015a), we can categorize neurons based upon their selectivity to the sucrose-predictive (CS-S) or quinine-predictive (CS-Q) cue, regardless of the response direction (excitation or inhibition). Among all recorded BLA neurons that responded selectively to one cue, we found ~3 fold more neurons selective to the CS-S (448/593, 76%, Figure 7E, left panel) than units selective to the CS-Q. We did not detect differences in the proportion of units selectively responding to the CS-S in the three projector populations compared to the whole BLA population (13/15, 87% in BLA-NAc; 8/13, 62% in BLA-CeA; 13/21, 62% in BLA-vHPC, binomial tests, p>0.05, Figure 7E).
Another classification, the “valence index,” defines the proportion of cells encoding valence as those with distinct responses to the CS-S and CS-Q (i.e. combining units responding selectively to one of the cues with units showing opposite responses to both cues) relative to all task-responsive cells (Figure 7E, middle panel). By using this classification we found that within the BLA task-responsive units we sampled, the majority encode valence during the retrieval of the positive and negative associations (605/810, 75%). This proportion was not detectably different in the three projector populations compared to the BLA population (15/23, 65% in BLA-NAc; 13/17, 76% in BLA-CeA; 21/27, 78% in BLA-vHPC, binomial tests, p>0.05, Figure 7E).
A third classification is the “valence bias,” which defines the proportion of a population encoding positive or negative valence among all the cells encoding valence (Figure 7E, right panel). Using this metric, positive valence is encoded at a population level by neurons that increase their firing upon presentation of the reward predicting cue (CS-S), that decrease their firing in response to a cue predicting an aversive outcome (CS-Q), or exhibit both of these opposing responses. Contrastingly, negative valence is encoded at the population level by cells inhibited by reward predicting cues and/or excited by cues predicting aversive outcomes. Using this operational definition in our dataset, we found that 51% of valence encoding BLA neurons code for positive valence (310/605), whereas 49% code for negative valence (295/605). Within the BLA projector populations, we found a significantly larger proportion of BLA-NAc projectors encoding positive valence (12/15, 80%) compared to the whole BLA (binomial test *p<0.05, Figure 7E). Within our sample, fewer BLA-CeA projectors encoded positive valence (4/13, 31%), and instead tended to preferentially encode negative valence (9/13 cells, 69%). In contrast, positive and negative valence encoding neurons were evenly represented among valence-responsive BLA-vHPC neurons (9/21 cells, 43% encoding positive valence, Figure 7E).
Altogether, quantitative analysis of the neural response of BLA populations (all BLA, BLA-NAc, BLA-CeA and BLA-vHPC), and analysis of the proportion of units responding with excitation and inhibition to the cues of positive and negative valence, both show that
BLA-A
uthor Man
uscr
ipt
A
uthor Man
uscr
ipt
A
uthor Man
uscr
ipt
A
uthor Man
uscr
ipt
NAc and BLA-CeA populations have divergent profiles in response to cues predicting rewarding and aversive outcomes.
DISCUSSION
Divergent circuits for encoding positive and negative valence
To assess valence encoding in BLA neurons projecting to the NAc, CeA, or vHPC, we recorded photoidentified cells during the retrieval of rewarding and aversive Pavlovian associations. Within this behavioral task, two cues of the same sensory modality (tones) were predictive of either a positive or negative outcome, themselves of matched modality (the tastants, sucrose or quinine). In so doing, we observed heterogeneous responses to the conditioned stimuli within BLA projector populations, yet provided evidence that
information regarding the sucrose and quinine predictive cues is differentially routed to divergent circuits (Figures 6-7).
BLA neurons respond to cues associated with positive and negative valence
Our results are consistent with previous studies reporting that intermingled neurons in the BLA respond to the valence of learned cues in rats (Shabel and Janak, 2009) and monkeys (Fuster and Uyeda, 1971; Paton et al., 2006; Zhang et al., 2013b). The proportion of cue-responsive BLA units we identify in mice is similar to that recorded by Fuster and Uyeda in monkeys (53%, while we found 50%). Moreover, the proportions of units differentially modulated by cues predicting positive or negative outcomes (responding to the CS-S only, to the CS-Q only, or to both cues in an opposite manner) are also strikingly consistent between mice and monkeys in these two studies (37% in both). Fuster and Uyeda also identified a similar proportion of units responding to both cues in the same qualitative way (excited by both cues or inhibited by both cues; 16%, while we found 13%). These marked similarities suggest that the coding properties of BLA neurons are preserved across mammalian phylogeny.
The critical novel finding that we present is that projection-target-defined populations of BLA neurons play distinct roles in valence retrieval in vivo. These distinctions are not exclusively based upon opposing excitatory responses, but also involve inhibitory responses. When all BLA neurons are considered together, approximately half of the cells responding selectively to the CS-S, selectively to the CS-Q, or similarly to both cues, displayed inhibitory responses (Figure 2D). As most of the BLA neurons displayed low but stable firing rates (Figure 5D), this suggests that inhibition of an ensemble of cells during a specific cue may carry valence information through a decrease in synaptic activation of the
downstream target(s) of these cells.
Design Advantages
Here, we introduce important advances for photostimulation-assisted identification of neural populations within a recurrent excitatory network. Recently, the in vivo activity of
projection-target-defined cells has been examined by expressing ChR2 in neurons of interest and using light-evoked firing as an instrument to identify these neurons in intact animals (Ciocchi et al., 2015; Jennings et al., 2013; Zhang et al., 2013a). However, two confounds
A
uthor Man
uscr
ipt
A
uthor Man
uscr
ipt
A
uthor Man
uscr
ipt
A
uthor Man
uscr
ipt
could undermine the stringent identification of projection-target-defined neurons using these methods. First, lateral synaptic contacts between glutamatergic neurons may result in the inclusion of non-projectors in the photoidentified group. To avoid the inappropriate inclusion of indirectly excited, non-expressing neighboring cells, we have refined this method by establishing projection-specific cutoffs for photostimulation-evoked action potential latency based upon direct ex vivo observations. The second confound arises from “antidromic” phototagging approaches that can inaccurately identify neurons via antidromic activation of fibers of passage. Here, we circumvent this confound using a dual-virus recombination strategy, which requires co-infection at terminal and somatic sites in order for ChR2 expression to occur. Using this approach, we eliminate the need for antidromic stimulation and collision tests, and can photoidentify cells at the level of the soma.
We have also taken strides to facilitate the interpretation of our neural data as they relate to valence encoding. Previous studies examining valence processing in the BLA have used different sensory modalities for the conditioned stimuli paired with rewarding and aversive outcomes (Shabel and Janak, 2009), as well as for the outcomes themselves. For instance, palatable foods or liquids are often presented as rewarding unconditioned stimuli, whereas electric shocks or air puffs are used as aversive unconditioned stimuli (Cohen et al., 2012; Fuster and Uyeda, 1971; Paton et al., 2006; Shabel and Janak, 2009). These discrepancies in stimuli modality require sensory processing along distinct streams, which may result in the recruitment of distinct subpopulations of BLA neurons independent of valence processing. To reduce this potential confound, we matched the modality of the rewarding and aversive unconditioned stimuli (gustatory), and conditioned stimuli (auditory).
To further reduce variability in the detection of sensory signals during the behavioral task, we head-restrained mice. In a head-fixed configuration, the mice receive auditory
conditioned stimuli at a consistent intensity throughout all trials. Further, acute recordings in head-fixed mice allow for multiple recording tracks within each animal, increasing the yield of recorded units and photoidentified cells compared to previous studies.
“Both” cells and collaterals: hypotheses
We found evidence of collateralization to multiple downstream targets among BLA projector populations. We hypothesize that certain cells collateralize within these distributed circuits to enhance overall arousal through increased excitability of postsynaptic cells in the entire valence system. Congruent with this idea, a recent study identified a population of dorsal hippocampal neurons sending collaterals to the NAc, the BLA and the mPFC, which was activated across behavioral conditions of different valence (Ciocchi et al., 2015). We speculate that BLA neurons targeting multiple downstream structures respond similarly to positive and negative valence in order to increase overall arousal in response to salient conditioned stimuli.
An alternative possibility is that certain valence encoding neurons in the BLA project to multiple downstream targets in order to promote behavioral flexibility. Within natural environments, valence exists on a continuum wherein sensory cues predict rewards and dangers of various magnitude, and these pairings are often subject to change. In order to survive, an animal must shift behavioral strategies when environmental contingencies
A
uthor Man
uscr
ipt
A
uthor Man
uscr
ipt
A
uthor Man
uscr
ipt
A
uthor Man
uscr
ipt
change. Individual BLA neurons that innervate multiple projection targets have the ability to send information both to canonical fear and reward pathways. These cells may track changing environmental contingencies via selective strengthening of inputs to one target over the other(s), potentially through the formation of increased synaptic contacts, through compartment-specific changes in release probability following axo-axonal excitation, or downstream local inhibition.
Valence: operational definitions
If we consider all cells in a population, and define valence coding within that population to be its net responsivity to either a rewarding or an aversive cue, our results indicate that all the assayed BLA populations increase activity in response to positive and negative valence (Figure 6A). However, if we further calculate the difference between the responses induced by the sucrose cue and by the quinine cue (Figure 6B), we find that cells in the entire BLA population, BLA-NAc projector population, and BLA-vHPC population tend to be more excited/less inhibited by the sucrose cue compared to the quinine cue, whereas the cells in the BLA-CeA projector population were overall more excited/less inhibited by the quinine cue compared to the sucrose cue. These results suggest that the BLA-NAc projector
population is sending a stronger excitatory drive to the NAc in response to reward predictive cues than to aversive predictive cues and that conversely, the BLA-CeA projector population is sending a stronger excitatory drive to the CeA during retrieval of an aversive association. Within the four BLA populations, we found that cells responding exclusively to the reward predictive cue were overrepresented among cue-selective neurons (Figure 7E). As the mice did not consume the quinine during most trials, the bias in cue selectivity may represent the relative magnitude of valence predicted by the two cues (sucrose consumption vs. quinine smell). Alternatively, the bias toward neurons responding to the reward predictive cue could reflect a larger computational load required to take action (go) compared to that required to suppress action (no go).
To further decode the nature of valence processing during the retrieval of associative memories, we classified BLA neural responses to the sucrose predictive cue and the quinine predictive cue based upon their directionality. The valence index quantifies the proportion of a task-responsive population that encodes valence. Within this classification, neurons that respond similarly to both cues are not considered as valence encoding, as these neurons might encode the salience of the cues or general arousal. Using this definition, among the task-responsive cells, we found that 75% of BLA neurons encoded valence, and this proportion was similar regardless of their projection target.
Among the valence encoding BLA neurons identified using the valence index, we examined the relative proportion of cells encoding positive or negative valence using the valence bias metric (Figure 7E). Despite the limitation that the downstream cell type contacted by BLA projectors is unknown, we found that a larger proportion of BLA-NAc projectors encode positive valence compared to the entire BLA, whereas the BLA-CeA projectors tend to preferentially encode negative valence. By contrast, and to our surprise, positive and negative valence encoding neurons were equally represented among valence-responsive BLA-vHPC neurons. Given that activation of this projection is anxiogenic (Felix-Ortiz et al.,
A
uthor Man
uscr
ipt
A
uthor Man
uscr
ipt
A
uthor Man
uscr
ipt
A
uthor Man
uscr
ipt
2013), we hypothesized that BLA neurons projecting to the vHPC would code for negative valence during retrieval. Our contrasting findings raise the possibility that innate and learned emotional valence could be processed by distinct circuitry emerging from the BLA. For this reason, we examined neural responses to the unconditioned stimuli.
Innate versus learned valence: responses to the US
While the value of the predictive cues must be learned across multiple conditioning sessions, the valence of sucrose and quinine are innate and do not require training. Analyzing
responses of BLA neurons to these stimuli presents two limitations, however. First, the US is delivered during the CS, and second, the rewarding US (sucrose) is consumed by the animal, whereas the aversive US (quinine) can be smelled, but is not consumed (Figure 1D, Movie S1). The majority of the BLA neurons selectively responding to the sucrose or quinine delivery changed their firing upon the sucrose delivery (595/698, 85%, Figures S2E, 7E). This disparity may be because the sucrose is actively consumed by the mice, whereas the quinine is avoided.
Among the US-valence-responsive BLA neurons we recorded, the majority encode innate negative valence (518/723, 58%) while 305/723 (42%) encoded innate positive valence (Figure S7D). Compared to our findings regarding responses to conditioned stimuli, in which 49% of valence-encoding BLA neurons encoded negative valence, these results suggest that a greater proportion of BLA neurons encoded innate negative valence than learned negative valence. This encoding of the innate valence of the US by BLA neurons may promote the attribution of valence to the CS during learning (Gore et al., 2015). If we categorize the units depending on their response type to the US and calculate the US-valence bias (Figure S7D), we find that the NAc projector population preferentially encodes innate positive valence (11/18, 61%), and that CeA projectors we recorded preferentially encode innate negative valence (12/17, 71%). If we assume that most of the BLA-CeA projectors that we recorded in this study are projecting to the viral injection site in the CeM, and consider anxiety-related behaviors as a state of innate negative valence, our results are consistent with previous findings showing that activation of the BLA-CeA projection is anxiolytic, via disynaptic inhibition of the CeM through feedforward recruitment of the CeL by the BLA (Tye et al., 2011).
Surprisingly, we found that the vHPC projectors did not preferentially encode innate negative valence (9/19, 47%), despite our previous finding that activation of the BLA-vHPC is anxiogenic (Felix-Ortiz and Tye, 2014; Felix-Ortiz et al., 2013). This discrepancy may result from recruitment of different BLA-vHPC projectors for the initiation of anxiety-like behaviors and the processing of discrete sensory stimuli.
Looking forward
The heterogeneity of response types within different populations suggests that combinatorial activity within the BLA in response to a conditioned cue ultimately recruits the motor output that triggers the appropriate behavior. Despite this heterogeneity, our results suggest that BLA-NAc projectors preferentially encode positive valence, when valence is defined (1) as the differential response of the entire population to rewarding versus aversive cues (Figure
A
uthor Man
uscr
ipt
A
uthor Man
uscr
ipt
A
uthor Man
uscr
ipt
A
uthor Man
uscr
ipt
6A-B), (2) as excitation/inhibition balance of cue selective cells (Figure 7D), or (3) as a valence bias (Figure 7E). Conversely, we found that BLA-CeA projectors preferentially encode negative valence when valence is defined using any of these three definitions. However, other BLA outputs including projections to the bed nucleus of the stria terminalis, the prefrontal cortex, anterior cingulate cortex, and orbitofrontal cortex represent promising avenues for future study of valence processing in anatomically defined BLA populations. The results we present here detail functional differences in valence encoding based upon anatomically-defined circuits, and offer insight toward mechanisms by which emotional and motivational information may be routed through the brain.
EXPERIMENTAL PROCEDURES
Stereotaxic Surgery and Viral Vectors
All procedures were carried out in accordance with the guidelines from the NIH and with approval of the MIT committee on animal care (CAC). Adult wild-type male C57BL/6J mice were used. We injected an anterograde adeno-associated viral vector (AAV5), carrying
ChR2 fused to eYFP in a cre-recombinase-dependent double-inverted open reading frame (DIO) construct, under the control of the pan-neuronal promotor EF1α AAV5
EF1α-DIO-ChR2-eYFP) in the BLA to transduce local cell bodies, and injected a retrogradely traveling canine adenovirus of type 2 carrying cre-recombinase (CAV2-cre), into the downstream target of interest (NAc, CeA or vHPC).
Behavioral Conditioning
~3 months after surgery, mice were food-restricted and head-fixed daily over six days to learn to associate two auditory cues with two gustatory outcomes of positive and negative valence. During the first days, the mice learned to associate one conditioned stimulus (CS-S) with a delivery of sucrose before we introduced a second conditioned stimulus (CS-Q) associated with a delivery of an aversive solution (quinine). When the mice showed anticipatory licking in response to the CS-S and reached a performance criterion of 70% successful trials for sucrose (lick) and for quinine (no lick) we performed acute recordings in the BLA over two consecutive days in 21 animals (Figure 1, S1).
In Vivo Electrophysiology
Once the mice recovered from surgery, they were head-fixed and a silicon optrode coated with red fluorescent microspheres was lowered into the BLA. The optrode was then lowered at ~1 μm/s until we observed a neural response to 473 laser stimulation. We then started a recording session presenting ~30 sucrose and ~30 quinine interleaved trials. Following completion of the task, a phototagging session, during which pseudorandomly dispersed stimulations of 1 s constant light, 10 s of 1 Hz (10 ms pulses), 2 s of 10 Hz (5 ms pulses) and 100 ms of 100 Hz (5 ms pulses) were delivered, with at least 5 iterations each.
Ex Vivo Electrophysiology
Coronal sections of 300 μm containing the BLA were collected from animals that had the same viral surgery as the animals used for in vivo recordings. Whole-cell patch-clamp recordings were taken from visually identified fluorescent projectors and neighboring
non-A
uthor Man
uscr
ipt
A
uthor Man
uscr
ipt
A
uthor Man
uscr
ipt
A
uthor Man
uscr
ipt
expressing cells. BLA cells expressing ChR2 were activated using a 470 nm LED. Response latencies of action potentials (AP) and excitatory postsynaptic potentials (EPSPs) were measured for 20 pulses of 5 ms delivered at 10 Hz and averaged for each neuron (Figure S4).
Confocal Microscopy
Mice included in this study were trained, recorded and perfused before the brain was extracted for histological verification of the viral injections and the recording location. Brains were fixed, frozen and sliced in 50 μm coronal sections. Sections were then incubated with a DNA-specific fluorescent probe, slide-mounted and imaged using an Olympus FV1000 confocal laser scanning microscope.
Statistical Analysis
Changes in neural firing rate in response to the CS and US were tested using a Wilcoxon signed-rank test comparing an experimental window of 500 ms to a baseline window of 2s (Figure 2B, S2C, Table S1). Significance threshold was placed at p<0.01 to classify a neuron as responding to the event. We used the same signed-rank test for light responses (100 ms baseline window and experimental window of 9 ms for BLA-NAc projectors and 6 ms for BLA-CeA and BLA-vHPC projectors), in addition to a threshold on the light-evoked response magnitude (average z-score>0.5). Paired statistical comparisons were made with a two-tailed paired Student t-test. Comparison of distributions were performed using a two sample Kolmogorov-Smirnov tests. Comparisons of z-scores differences were realized with a non-parametric Kruskal-Wallis test. Comparisons of proportion of excitation and inhibition within populations were made using binomial distribution tests. Threshold for significance was placed at +p<0.1, *p<0.05, **p<0.01 and ***p<0.001). All data are shown as mean ± standard error of the mean (SEM).
Supplementary Material
Refer to Web version on PubMed Central for supplementary material.
ACKNOWLEDGMENTS
We thank the entire Tye laboratory for helpful discussion. We thank EJ Kremer for providing the CAV2-cre vector, R. Neve for the HSV and AAV9 vectors and the UNC vector core for the AAV5 vectors. KMT is a New York Stem Cell Foundation - Robertson Investigator and McKnight Scholar and this work was supported by funding from the JPB Foundation, PIIF, PNDRF, JFDP, Whitehall Foundation, Klingenstein Foundation, NARSAD, Alfred P Sloan Foundation, New York Stem Cell Foundation, Whitehead Career Development Chair, NIH R01-MH102441-01 (NIMH) and NIH Director’s New Innovator Award DP2-DK-102256-01 (NIDDK). AB was supported by a fellowship from the Swiss National Science Foundation and NARSAD. PN was supported by Singleton, Leventhal and Whitaker fellowships. GGC was supported by JFDP and NARSAD.
REFERENCES
Adhikari A. Distributed circuits underlying anxiety. Front. Behav. Neurosci. 2014; 8:112. [PubMed: 24744710]
Allsop SA, Vander Weele CM, Wichmann R, Tye KM. Optogenetic insights on the relationship between anxiety-related behaviors and social deficits. Front. Behav. Neurosci. 2014; 8:241. [PubMed: 25076878]
A
uthor Man
uscr
ipt
A
uthor Man
uscr
ipt
A
uthor Man
uscr
ipt
A
uthor Man
uscr
ipt
Ambroggi F, Ishikawa A, Fields HL, Nicola SM. Basolateral amygdala neurons facilitate reward-seeking behavior by exciting nucleus accumbens neurons. Neuron. 2008; 59:648–661. [PubMed: 18760700]
Amorapanth P. Lesions of Periaqueductal Gray Dissociate-Conditioned Freezing From Conditioned Suppression Behavior in Rats. Learn. Mem. 1999; 6:491–499. [PubMed: 10541469]
Ben-Ari Y, Tremblay E, Ottersen OP. Injections of kainic acid into the amygdaloid complex of the rat: an electrographic, clinical and histological study in relation to the pathology of epilepsy.
Neuroscience. 1980; 5:515–528. [PubMed: 6892841]
Berridge KC, Robinson TE. Parsing reward. Trends Neurosci. 2003; 26:507–513. [PubMed: 12948663]
Bordi F, LeDoux J. Sensory tuning beyond the sensory system: an initial analysis of auditory response properties of neurons in the lateral amygdaloid nucleus and overlying areas of the striatum. J. Neurosci. Off. J. Soc. Neurosci. 1992; 12:2493–2503.
Britt JP, Benaliouad F, McDevitt RA, Stuber GD, Wise RA, Bonci A. Synaptic and behavioral profile of multiple glutamatergic inputs to the nucleus accumbens. Neuron. 2012; 76:790–803. [PubMed: 23177963]
Calhoun ME, Jucker M, Martin LJ, Thinakaran G, Price DL, Mouton PR. Comparative evaluation of synaptophysin-based methods for quantification of synapses. J. Neurocytol. 1996; 25:821–828. [PubMed: 9023727]
Ciocchi S, Herry C, Grenier F, Wolff SBE, Letzkus JJ, Vlachos I, Ehrlich I, Sprengel R, Deisseroth K, Stadler MB, et al. Encoding of conditioned fear in central amygdala inhibitory circuits. Nature. 2010; 468:277–282. [PubMed: 21068837]
Ciocchi S, Passecker J, Malagon-Vina H, Mikus N, Klausberger T. Selective information routing by ventral hippocampal CA1 projection neurons. Science. 2015; 348:560–563. [PubMed: 25931556] Cohen JY, Haesler S, Vong L, Lowell BB, Uchida N. Neuron-type-specific signals for reward and
punishment in the ventral tegmental area. Nature. 2012; 482:85–88. [PubMed: 22258508] Etkin A, Wager TD. Functional neuroimaging of anxiety: a meta-analysis of emotional processing in
PTSD, social anxiety disorder, and specific phobia. Am. J. Psychiatry. 2007; 164:1476–1488. [PubMed: 17898336]
Etkin A, Prater KE, Schatzberg AF, Menon V, Greicius MD. Disrupted amygdalar subregion functional connectivity and evidence of a compensatory network in generalized anxiety disorder. Arch. Gen. Psychiatry. 2009; 66:1361–1372. [PubMed: 19996041]
Felix-Ortiz AC, Tye KM. Amygdala Inputs to the Ventral Hippocampus Bidirectionally Modulate Social Behavior. J. Neurosci. 2014; 34:586–595. [PubMed: 24403157]
Felix-Ortiz AC, Beyeler A, Seo C, Leppla CA, Wildes CP, Tye KM. BLA to vHPC Inputs Modulate Anxiety-Related Behaviors. Neuron. 2013; 79:658–664. [PubMed: 23972595]
Fontanini A, Grossman SE, Figueroa JA, Katz DB. Distinct subtypes of basolateral amygdala taste neurons reflect palatability and reward. J. Neurosci. Off. J. Soc. Neurosci. 2009; 29:2486–2495. Fuster JM, Uyeda AA. Reactivity of limbic neurons of the monkey to appetitive and aversive signals.
Electroencephalogr. Clin. Neurophysiol. 1971; 30:281–293. [PubMed: 4103500]
Goosens KA, Maren S. Contextual and auditory fear conditioning are mediated by the lateral, basal, and central amygdaloid nuclei in rats. Learn. Mem. Cold Spring Harb. N. 2001; 8:148–155. Gore F, Schwartz EC, Brangers BC, Aladi S, Stujenske JM, Likhtik E, Russo MJ, Gordon JA, Salzman
CD, Axel R. Neural Representations of Unconditioned Stimuli in Basolateral Amygdala Mediate Innate and Learned Responses. Cell. 2015; 162:134–145. [PubMed: 26140594]
Janak PH, Tye KM. From circuits to behaviour in the amygdala. Nature. 2015; 517:284–292. [PubMed: 25592533]
Jennings JH, Sparta DR, Stamatakis AM, Ung RL, Pleil KE, Kash TL, Stuber GD. Distinct extended amygdala circuits for divergent motivational states. Nature. 2013; 496:224–228. [PubMed: 23515155]
Jimenez SA, Maren S. Nuclear disconnection within the amygdala reveals a direct pathway to fear. Learn. Mem. Cold Spring Harb. N. 2009; 16:766–768.
Lammel S, Tye KM, Warden MR. Progress in understanding mood disorders: optogenetic dissection of neural circuits. Genes Brain Behav. 2014; 13:38–51. [PubMed: 23682971]
A
uthor Man
uscr
ipt
A
uthor Man
uscr
ipt
A
uthor Man
uscr
ipt
A
uthor Man
uscr
ipt
McDonald AJ. Neuronal organization of the lateral and basolateral amygdaloid nuclei in the rat. J. Comp. Neurol. 1984; 222:589–606. [PubMed: 6199387]
McDonald AJ. Cortical pathways to the mammalian amygdala. Prog. Neurobiol. 1998; 55:257–332. [PubMed: 9643556]
Mervaala E, Föhr J, Könönen M, Valkonen-Korhonen M, Vainio P, Partanen K, Partanen J, Tiihonen J, Viinamäki H, Karjalainen AK, et al. Quantitative MRI of the hippocampus and amygdala in severe depression. Psychol. Med. 2000; 30:117–125. [PubMed: 10722182]
Namburi P, Al-Hasani R, Calhoon GG, Bruchas MR, Tye KM. Architectural Representation of Valence in the Limbic System. Neuropsychopharmacol. Off. Publ. Am. Coll. Neuropsychopharmacol. 2015a
Namburi P, Beyeler A, Yorozu S, Calhoon GG, Halbert SA, Wichmann R, Holden SS, Mertens KL, Anahtar M, Felix-Ortiz AC, et al. A circuit mechanism for differentiating positive and negative associations. Nature. 2015b; 520:675–678. [PubMed: 25925480]
Nieh EH, Kim S-Y, Namburi P, Tye KM. Optogenetic dissection of neural circuits underlying emotional valence and motivated behaviors. Brain Res. 2013; 1511:73–92. [PubMed: 23142759] Nieh EH, Matthews GA, Allsop SA, Presbrey KN, Leppla CA, Wichmann R, Neve R, Wildes CP, Tye
KM. Decoding neural circuits that control compulsive sucrose seeking. Cell. 2015; 160:528–541. [PubMed: 25635460]
Oh SW, Harris JA, Ng L, Winslow B, Cain N, Mihalas S, Wang Q, Lau C, Kuan L, Henry AM, et al. A mesoscale connectome of the mouse brain. Nature. 2014; 508:207–214.
Paton JJ, Belova MA, Morrison SE, Salzman CD. The primate amygdala represents the positive and negative value of visual stimuli during learning. Nature. 2006; 439:865–870. [PubMed: 16482160] Pitkänen, A. The Amygdala: A Functional Analysis. Oxford University Press; Oxford, OX; New York:
2000.
Senn V, Wolff SBE, Herry C, Grenier F, Ehrlich I, Gründemann J, Fadok JP, Müller C, Letzkus JJ, Lüthi A. Long-range connectivity defines behavioral specificity of amygdala neurons. Neuron. 2014; 81:428–437. [PubMed: 24462103]
Shabel SJ, Janak PH. Substantial similarity in amygdala neuronal activity during conditioned appetitive and aversive emotional arousal. Proc. Natl. Acad. Sci. 2009; 106:15031–15036. [PubMed: 19706473]
Shinonaga Y, Takada M, Mizuno N. Topographic organization of collateral projections from the basolateral amygdaloid nucleus to both the prefrontal cortex and nucleus accumbens in the rat. Neuroscience. 1994; 58:389–397. [PubMed: 8152545]
Somerville LH, Kim H, Johnstone T, Alexander AL, Whalen PJ. Human amygdala responses during presentation of happy and neutral faces: correlations with state anxiety. Biol. Psychiatry. 2004; 55:897–903. [PubMed: 15110733]
Stuber GD, Sparta DR, Stamatakis AM, van Leeuwen WA, Hardjoprajitno JE, Cho S, Tye KM, Kempadoo KA, Zhang F, Deisseroth K, et al. Excitatory transmission from the amygdala to nucleus accumbens facilitates reward seeking. Nature. 2011; 475:377–380. [PubMed: 21716290] Tye KM, Stuber GD, De Ridder B, Bonci A, Janak PH. Rapid strengthening of thalamo-amygdala
synapses mediates cue–reward learning. Nature. 2008; 453:1253–1257. [PubMed: 18469802] Tye KM, Prakash R, Kim S-Y, Fenno LE, Grosenick L, Zarabi H, Thompson KR, Gradinaru V,
Ramakrishnan C, Deisseroth K. Amygdala circuitry mediating reversible and bidirectional control of anxiety. Nature. 2011; 471:358–362. [PubMed: 21389985]
Tye KM, Mirzabekov JJ, Warden MR, Ferenczi EA, Tsai H-C, Finkelstein J, Kim S-Y, Adhikari A, Thompson KR, Andalman AS, et al. Dopamine neurons modulate neural encoding and expression of depression-related behaviour. Nature. 2013; 493:537–541. [PubMed: 23235822]
Zhang S-J, Ye J, Miao C, Tsao A, Cerniauskas I, Ledergerber D, Moser M-B, Moser EI. Optogenetic dissection of entorhinal-hippocampal functional connectivity. Science. 2013a; 340:1232627. [PubMed: 23559255]
Zhang W, Schneider DM, Belova MA, Morrison SE, Paton JJ, Salzman CD. Functional circuits and anatomical distribution of response properties in the primate amygdala. J. Neurosci. Off. J. Soc. Neurosci. 2013b; 33:722–733.
A
uthor Man
uscr
ipt
A
uthor Man
uscr
ipt
A
uthor Man
uscr
ipt
A
uthor Man
uscr
ipt
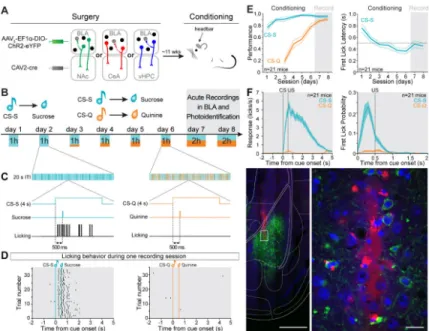
Figure 1. Experimental design and behavioral training
(A) Anterograde AAV5-EF1α-DIO-ChR2-eYFP was injected in the BLA and retrograde
CAV2-cre was injected in one of the following downstream targets: NAc, CeA or vHPC. A head bar was cemented to the skull to enable subsequent head-fixed training and recording. The animals were exposed to one week of dual Pavlovian conditioning, wherein one conditioned stimulus (CS-S) predicted the delivery of a sucrose solution, and a different conditioned stimulus (CS-Q) predicted the delivery of a bitter solution (quinine).
(B) Schematic of conditioning and retrieval task. On days 1-2, an auditory cue was paired with a sucrose delivery and on days 3-6, a second auditory cue was paired with quinine deliveries. The number of quinine cues was gradually increased from 10% to 50% of total trials. On days 7-8, during the retrieval of rewarding and aversive associations an optrode was inserted into the BLA to record neural activity, and laser stimulation was used to photoidentify neurons expressing ChR2.
(C) Time courses of a reward trial (left panel) and an aversive trial (right panel). The cues were played for 4 s and a 3 μL drop of solution (sucrose or quinine) was delivered ~500 ms after the onset of the cue. Anticipatory licking before the sucrose delivery indicates acquisition of the reward association and no licking indicates expression of the aversive association.
(D) Licking behavior of a representative mouse in response to the CS-S (left raster) and the CS-Q presentations (right raster) during a recording session.
(E) Performance for the reward association (CS-S performance = sucrose trials with licks / number of sucrose trials) and for the aversive association (CS-Q performance = quinine trials without licks / number of quinine trials) increased during learning of the task (left panel) and the latency of the first lick after the CS-S onset decreased across training (right panel). The thinner lines represent the SEM, and the dashed line at 500 ms indicates the time of US delivery.
A
uthor Man
uscr
ipt
A
uthor Man
uscr
ipt
A
uthor Man
uscr
ipt
A
uthor Man
uscr
ipt
(F) Licking behavior during the recording sessions, averaged across all animals. Left panel represents the licking behavior and right panel represents the probability of first lick in response to the cues. The shaded areas represent SEM.
(G) Representative image of a recording track in the BLA. The recording optrode was coated with red fluorescent microspheres before insertion into the brain (left image, scale bar 500 μm The area containing the tip of the electrode in the BLA (white rectangle on the left image) is enlarged to the right. Scale bar reflects 20 μm. Blue is DAPI, green is eYFP and red is red fluorescent microspheres.
A
uthor Man
uscr
ipt
A
uthor Man
uscr
ipt
A
uthor Man
uscr
ipt
A
uthor Man
uscr
ipt
Figure 2. BLA units respond to matched modality sucrose and/or quinine cues
(A) Schematic of the optrode used to record neural activity. The blue quadrilateral represents the theoretical light cone. Right, the average waveform of 2 units isolated from one
recording site (average ±99.7% confidence interval).
(B) Peri-stimulus time histogram (PSTH) of the firing rate of a single unit, to the onset of 30 sucrose predicting cues (CS-S). For each unit, a Wilcoxon signed-rank test determined if the firing rate during the first 500 ms of the cue was significantly different from the 2 s baseline window (p<0.01).
(C) 1626 BLA units were recorded from 21 mice. 810 (50%) had a significantly different firing rates during the first 500 ms of the cue compared to the 2 s before the cue (Wilcoxon signed rank test, p<0.01). 28% responded selectively to the CS-S, 9% to the CS-Q, 13% responded to both cues in the same way and less than 1% responded to both cues in an opposite way.
(D) Heat maps of the z-score of all recorded units in response to the CS-S (vertical teal line, left map) and in response to the CS-Q (vertical orange line, right map). 26% of the units showed a significant excitatory response to one and/or the other auditory cue (Wilcoxon signed-rank test, p<0.01). 14% of the units were selectively excited by the CS-S and 4% by the CS-Q, while 7% were excited by both cues. 24% of the units showed a significant inhibitory response to one and/or the other cue. 14% were selectively inhibited by the CS-S and 5% by the CS-Q while 5% were inhibited by both cues. The black arrows indicate units responding to both cues in an opposite manner (top arrow: excited by the CS-S and inhibited by the CS-Q (0.5%); bottom arrow: inhibited by the CS-S and excited by the CS-Q (0.2%)).
A
uthor Man
uscr
ipt
A
uthor Man
uscr
ipt
A
uthor Man
uscr
ipt
A
uthor Man
uscr
ipt
(E) Proportion of units responding to the rewarding cue only (CS-S selective), to the aversive cue only (CS-Q selective) or to both cues in the same way, with an inhibitory response (black) or with an excitatory response (yellow).
A
uthor Man
uscr
ipt
A
uthor Man
uscr
ipt
A
uthor Man
uscr
ipt
A
uthor Man
uscr
ipt
Figure 3. Evidence of collateralization of BLA projection neurons
(A) Sagittal view representing the relative position of brain sections imaged to quantify membrane fluorescence of neurites expressing ChR2-eYFP.
(B) Coronal locations of the 14 sites imaged for each mouse. Locations proximal to the injection coordinates were used as reference sites (black outlines) to compare the fluorescence intensity with other imaging sites (gray outlines).
(C) Confocal images containing a section of (from left to right): the prelimbic (PL) and infralimbic (IL) medial prefrontal cortex (mPFC), the NAc medial shell and lateral core, the medial CeA and the vHPC from one mouse expressing ChR2-eYFP in BLA-NAc projectors (top row), in BLA-CeA projectors (middle row), or in BLA-vHPC projectors (bottom row). Scale bars represent 50 μm.
(D) Quantification of the fluorescent pixels per confocal image for each experimental group (BLA-NAc n=3 mice, except for mPFC where n=2, BLA-CeA n=4 mice and BLA-vHPC, n=3 mice). The relative axon density represents the fraction of fluorescent pixels normalized within each animal. The number of fluorescent pixels was obtained by thresholding the maximum intensity projection (MIP) of the confocal z-stack (>0.5, see Figure S3).
A
uthor Man
uscr
ipt
A
uthor Man
uscr
ipt
A
uthor Man
uscr
ipt
A
uthor Man
uscr
ipt
Figure 4. Empirical determination of photoresponse latency threshold ex vivo
(A) Left panel: differential interference contrast (DIC) image of a 300 μm thick coronal brain section of a mouse expressing ChR2-eYFP in BLA-NAc projectors, with green fluorescence image overlaid. Right panel: BLA-NAc projectors expressing ChR2-eYFP and recorded in whole-cell patch-clamp.
(B) Representative peak/steady state current of a neuron expressing ChR2 (ChR2+, sky-blue trace) in response to a 1 s light pulse (sky-blue rectangle). In non-expressing neighboring cells, light stimulation either evoked a transient current (gray trace) or the cells did not respond (black trace).
(C) Proportion of all cells recorded ex vivo expressing ChR2-eYFP (ChR2+, 21%, sky-blue), of responsive neighbors (25%, gray), and of non-responsive neighbors (54%, black). Numbers indicate the number of recorded neurons.
(D) Proportion of ChR2+ neurons, responsive neighbors, and non-responsive neighbors recorded in the BLA of mice expressing ChR2-eYFP in BLA-NAc (green), BLA-CeA (red) or BLA-vHPC (dark blue) projectors.
(E) Representative traces of neural responses to a 5 ms light pulse of BLA projectors expressing ChR2-eYFP (green, red or dark blue traces), in responsive neighbors (gray traces) and non-responsive neighbors (black traces).
(F) Light evoked peak response latency in BLA-NAc, BLA-CeA and BLA-vHPC projectors expressing ChR2 and in non-expressing neighbors. Light evoked response latencies are significantly shorter in BLA-NAc (unpaired t-test, t17=4.64, ***p<0.001), BLA-CeA
(unpaired ttest, t10=10.64, ***p<0.001) and BLA-vHPC (unpaired t-test, t9=5.62, ***plt;
0.001) projectors compared to their non-expressing neighbors. The distribution of the latency in expressing and non-expressing cells was used to define the latency threshold for in
A
uthor Man
uscr
ipt
A
uthor Man
uscr
ipt
A
uthor Man
uscr
ipt
A
uthor Man
uscr
ipt
vivo photoidentification (9 ms for NAc projectors and 6 ms for CeA and BLA-vHPC projectors).
A
uthor Man
uscr
ipt
A
uthor Man
uscr
ipt
A
uthor Man
uscr
ipt
A
uthor Man
uscr
ipt
Figure 5. Neural response of BLA projection neurons to cues predicting sucrose or quinine
(A) Photoresponse latencies in vivo were calculated by measuring the time from stimulation onset to the first bin in which firing rate increased at least four standard deviations (4 SD) above baseline.
(B) No differences were detected in photoresponse latency distributions among BLA-NAc, BLA-CeA and BLA-vHPC projectors (Kolmogorov-Smirnov tests, p>0.05).
(C) The distribution of firing rates in BLA-NAc and BLA-vHPC projectors was not different from the BLA distribution (Kolmogorov-Smirnov tests, p>0.05) while the firing rate distribution in BLA-CeA projectors was different from the BLA distribution (Kolmogorov-Smirnov tests, p<0.01).
(D) Scatterplot depicting the action potential (AP) duration (peak-trough) as a function of the firing rate of all the recorded units (gray) and in the three photoidentified populations (BLA-NAc in green, BLA-CeA in red and BLA-vHPC in blue).
(E) Representative examples of firing rate (FR) in response to 10 ms photostimulation for units photoidentified as BLA-NAc (green), BLA-CeA (red) or BLA-vHPC (blue) projectors. (F) Heat maps of the z-scores of all the units photoidentified as BLA-NAc projectors (top), BLA-CeA projectors (middle) or BLA-vHPC projectors (bottom) in response to the CS-S (teal line, left) and to the CS-Q (orange line, right).
A
uthor Man
uscr
ipt
A
uthor Man
uscr
ipt
A
uthor Man
uscr
ipt
A
uthor Man
uscr
ipt
Figure 6. Category-independent coding properties of BLA populations
We first analyzed responses within each population independent of qualitative
classifications. (A) Z-score time courses averaged across all BLA units (black), all BLA-NAc projectors (green), all BLA-CeA projectors (red) or all BLA-vHPC projectors (blue), in response to the CS-S (upper panel) and in response to the CS-Q (bottom panel). Shaded areas represent the SEM. The gray shaded box depicts the interval from CS onset to US onset.
(B) Difference between CS-S and CS-Q z-scores, averaged from the onset of the CS to the US delivery, for each BLA units (black bar) and for neurons of the three projector
populations (green, red and blue bars). Positive values indicate greater magnitude
responsiveness to the CS-S, while negative values indicate greater magnitude responsiveness to the CS-Q. BLA-CeA projectors respond more to the CS-Q than the CS-S compared to all other populations (Kruskal-Wallis test p<0.01, CeA post-hoc comparisons: to BLA-NAc ***p<0.001, to BLA *p<0.05, and to BLA-vHPC **p<0.01).
(C) The z-score time course of each neuron from −500 ms to 500 ms relative to cue-onset was projected onto two-dimensions using principal component analysis (PCA). In order to visualize the time periods that contribute most significantly to the principal components depicted in (D), we plotted the contribution of each 50 ms time bin to principal component 1 (PC1) and principal component 2 (PC2). Bins prior to the cue onset did not contribute to either principal component, whereas the first time bins after CS onset contribute most strongly to PC2 and subsequent bins contribute to PC1.
(D) Neural responses to the sucrose predictive cue (CS-S) and quinine predictive cue (CS-Q) in all BLA units, BLA-NAc, BLA-CeA and BLA-vHPC projector populations, visualized
A
uthor Man
uscr
ipt
A
uthor Man
uscr
ipt
A
uthor Man
uscr
ipt
A
uthor Man
uscr
ipt
along PC1 and PC2. Neural dynamics in principal component (PC) space across all neurons in each population were averaged for each cue to obtain the position of the vectors.
A
uthor Man
uscr
ipt
A
uthor Man
uscr
ipt
A
uthor Man
uscr
ipt
A
uthor Man
uscr
ipt
Figure 7. Distinct roles in coding positive and negative valence defined by projection target
For these analyses, we grouped neurons based upon their qualitative response to the CS-S and CS-Q.
(A) PSTHs of the firing rates (FR) of three units photoidentified as BLA-NAc projectors, one showing an excitatory response to the cue associated with sucrose (CS-S, top), one showing an inhibitory response to the cue associated with quinine (CS-Q, middle), and one showing an inhibitory response to both cues (B, bottom).
(B) Perievent raster histograms of the firing rates of three units photoidentified as BLA-CeA projectors, one inhibited by the cue associated with sucrose (CS-S, top), one excited by the cue associated with quinine (CS-Q, middle) and one excited by both cues (B, bottom). (C) Distribution of units excited (left, filled bars) or inhibited (right, open bars) by the CS-S (S), by the CS-Q (Q), or by both cues in the same way (B), in all the BLA units (black), in the BLA-NAc photoidentified units (green), in the BLA-CeA photoidentified units (red) and in BLA-vHPC photoidentified units (blue).
(D) Proportion of units excited and inhibited by the sucrose cue (S) or the quinine cue (Q), in the four neural populations. A larger proportion of BLA-NAc neurons (77%) showed phasic excitations to the CS-S than in the nonspecific BLA neural population as a whole (51%; binomial distribution, +p=0.093). A larger proportion of BLA-CeA neurons (100%) showed phasic excitation to the CS-Q than in the nonspecific BLA neural population (49%; binomial distribution, *p<0.05)
(E) Valence definitions applied to all BLA units and the three projector populations. Cue selectivity: proportion of cue responsive cells responding exclusively to the sucrose cue (filled bars) or to the quinine cues (open bars). Valence index: proportion of task responsive cells encoding valence (including those responsive to only one cue, or responding oppositely
A
uthor Man
uscr
ipt
A
uthor Man
uscr
ipt
A
uthor Man
uscr
ipt
A
uthor Man
uscr
ipt
to both cues; closed bars) compared to those responding in the same way to both cues. Valence bias: relative proportion of neurons responding to positive valence (filled bars) and negative valence (open bars). The BLA-NAc projector population has a greater proportion of cells encoding positive valence than the nonspecific BLA population based upon this valence bias metric (binomial distribution, *p<0.05).