Distributions of crenarchaeal amoA
genes and transcripts in the Pacific Ocean
The MIT Faculty has made this article openly available. Please sharehow this access benefits you. Your story matters.
Citation Church, Matthew J. et al. “Abundances of Crenarchaeal amoA Genes and Transcripts in the Pacific Ocean.” Environmental Microbiology 12.3 (2010): 679–688.
As Published http://dx.doi.org/10.1111/j.1462-2920.2009.02108.x Publisher John Wiley & Sons, Inc.
Version Author's final manuscript
Citable link http://hdl.handle.net/1721.1/69223
Terms of Use Creative Commons Attribution-Noncommercial-Share Alike 3.0 Detailed Terms http://creativecommons.org/licenses/by-nc-sa/3.0/
1 2
Distributions of crenarchaeal amoA genes and transcripts 3
in the Pacific Ocean 4
5
Matthew J. Church1*, Brenner Wai1, David M. Karl1, Edward F. DeLong2 6
7 8 9
1
School of Ocean and Earth Science and Technology, Department of Oceanography, 10
University of Hawaii, Honolulu, Hawaii 96822 11
2
Civil and Environmental Engineering, Massachusetts Institute of Technology, 12 Cambridge, MA 02139 13 14 15 *
For correspondence: Matthew J. Church, Department of Oceanography, University of 16
Hawaii, Honolulu, HI., 96822, USA. 17
Tel: (808) 956-8779, FAX: (808) 956-6519; [email protected] 18
19 20
Running title: Marine crenarchaeal amoA genes and transcript abundances 21
Abstract 22
Planktonic crenarchaea are thought to play a key role in chemolithotrophic 23
ammonia oxidation, a critical step the marine nitrogen (N) cycle. In this study, we 24
examined the spatial distributions of ammonia-oxidizing Crenarchaea across a large 25
(~5200 km) region of the central Pacific Ocean. Examination of crenarchaeal 16S rRNA 26
and ammonia monooxygenase subunit A (amoA) genes and amoA transcript abundances 27
provided insight into their spatial distributions and activities. Creanarchaeal gene 28
abundances increased 3 to 4 orders of magnitude with depth between the upper ocean 29
waters and dimly-lit waters of the mesopelagic zone. The resulting crenarchaeal amoA : 30
16S rRNA gene ratio averaged ~2, suggesting the majority of Crenarchaea in the epi- and 31
mesopelagic regions of the Pacific Ocean are capable of ammonia oxidation. In contrast 32
to the observed vertical changes in gene copy abundances, amoA transcript abundances 33
increased in the transitional zone separating the epipelagic waters from the mesopelagic 34
(100-200 m), before decreasing 1 to 2 orders of magnitude into the interior of the 35
mesopelagic zone. The resulting gene copy normalized transcript abundances revealed 36
elevated amoA expression in the upper ocean waters (0-100 m). These results suggest 37
ammonia oxidizing Crenarchaea are active contributors to the nitrogen cycle throughout 38
the epi- and mesopelagic waters of the central Pacific Ocean. 39
Introduction 40
The physiological activities of diverse groups of planktonic microorganisms form 41
major controls on the transformation and availability of nitrogen (N) containing 42
compounds in the sea. Nitrification is the aerobic oxidation of ammonia (NH3) to nitrate
43
(NO3-). The process occurs through two independent steps initiated by the oxidation of
44
ammonia to nitrite (ammonia oxidation), followed by oxidation of nitrite to nitrate (nitrite 45
oxidation). The two steps of the complete nitrification reaction are facilitated by different 46
groups of microorganisms. Recent cultivation-dependent and independent approaches 47
have revealed that members of the marine Crenarchaea appear to play an important role 48
in ammonia oxidation, while bacterial genera, including Nitrospina may mediate nitrite 49
oxidation (Francis et al., 2005; Konneke et al., 2005; Wuchter et al., 2006; Mincer et al., 50
2007). 51
Over the past two decades, nonthermophilic archaea have increasingly become 52
recognized as abundant, ubiquitous, and dynamic components of the ocean plankton 53
(Delong, 1992; Fuhrman et al., 1992; Karner et al., 2001). This recognition has stemmed 54
in large part from advances in geochemical and molecular-based approaches to study 55
these microorganisms. Carbon isotope analyses of archaeal lipids (Pearson et al., 2001; 56
Ingalls et al., 2006), incubation-growth experiments (Ouverney and Fuhrman, 2000; 57
Herndl et al., 2005; Teira et al., 2006b; Wuchter et al., 2006; Kirchman et al., 2007), and 58
reconstructions of archaeal metagenomes (DeLong et al., 2006; Hallam et al., 2006a; 59
Hallam et al., 2006b; Martin-Cuadrado et al., 2008) have provided insight into marine 60
crenarchaeal metabolism, indicating these microorganisms may rely on metabolic 61
strategies that include chemoautotrophy and chemoheterotrophy. Isolation of the 62
ammonia oxidizing crenarchaeon Nitrosopumilus maritimus (Konneke et al., 2005) 63
revealed that chemoautotrophic growth on ammonia resulted in stoichiometric production 64
of nitrite. There is also compelling evidence that marine Crenarchaea rely on 65
chemoheterotrophy, assimilating dissolved organic matter during growth (Herndl et al., 66
2005; Kirchman et al., 2007; Varela et al., 2008). The relative contribution of these 67
different modes of metabolism may vary with depth; chemoautotrophic growth has been 68
hypothesized to prevail in the upper ocean and mid-depth waters of the mesopelagic 69
(Hansman et al., 2009), with chemoheterotrophy hypothesized to predominate in the 70
cold, dark waters of the ocean’s bathypelagic interior (Agogue et al., 2008). 71
Despite the potential importance of Crenarchaea to the marine N-cycle, there is 72
only limited information available on the distributions and physiological activities of 73
these microorganisms. In this study, we examined the transcriptional activities and 74
distributions of presumptive nitrifying marine Crenarchaea sampled throughout the 75
euphotic zone and into the mesopelagic regions (<1000 m) across a ~5200 km region of 76
the Pacific Ocean. QPCR-derived estimates of crenarchaeal gene abundances indicate 77
that Crenarchaea are ubiquitous components of the mesopelagic microbial assemblage. 78
Moreover, reverse transcriptase quantitative PCR (RT-QPCR) amplification of amoA 79
transcripts revealed active gene expression throughout both the epi- and mesopelagic 80
waters of the Pacific Ocean. These data provide additional support that Crenarchaea 81
actively contribute to ammonia oxidation, and further suggest that despite their lower 82
abundance in the upper ocean, these microorganisms may be active in N-cycling. 83
84
Results 85
Biogeochemical and hydrographic variability 86
Sampling for this study included a wide range of spatially distinct oceanic 87
environments that included well-lit, nitrate + nitrite (N+N) depleted epipelagic waters to 88
the cold, dimly- lit, N+N enriched regions of the mesoeplagic zone. The most prominent 89
differences in the physical and biogeochemical structure of the upper ocean occurred in 90
the transitional region between the oligotrophic subtropical gyres and the nutrient-91
enriched regions of the equatorial waters. Upward doming of the thermocline in 92
equatorial region carried cold, nutrient-enriched, O2-depleted waters closer to the ocean’s
93
surface. The region of most intense upwelling (as reflected in both uplift of isotherms 94
and nutrient distributions) occurred in the northern equatorial waters (~8.6oN; Figure 1). 95
In contrast, upper ocean nutrient concentrations the northern and southern subtropical 96
gyres were very low (e.g. average N+N concentrations in the upper 100 m in these 97
regions were generally <100 nmol L-1). Among the most prominent meridional patterns 98
observed in the waters of the mesopelagic zone (>300 m) were changes in concentrations 99
of N+N and dissolved O2, with N+N concentrations generally increasing concomitant
100
with decreases in dissolved O2 concentrations from south to north (Figure 1).
101
Distributions of crenarchaeal amoA and 16S rRNA genes 102
Vertical profiles of QPCR-derived crenarchaeal amoA gene abundances varied 103
strongly with depth. Gene abundances typically increased 3 to 4 orders of magnitude 104
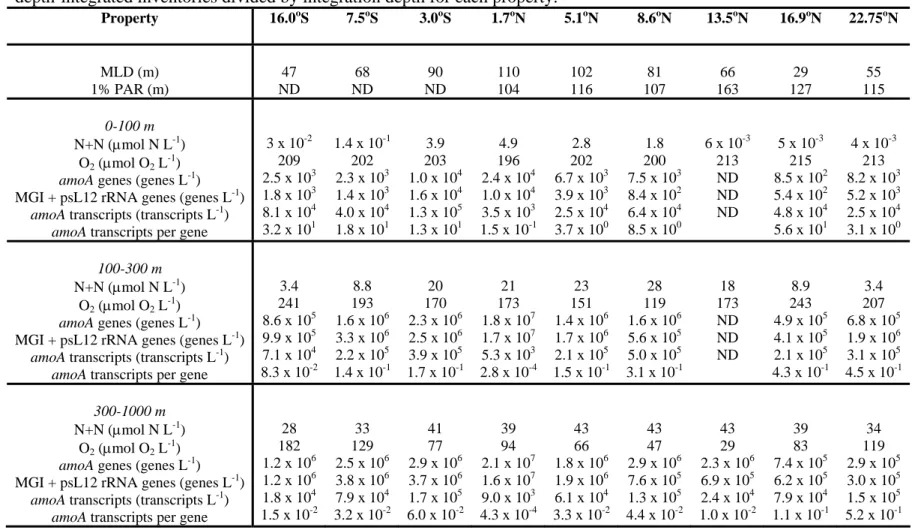
between the near-surface ocean and the lower mesopelagic zone (Figures 2, 3). amoA 105
gene abundances in the near surface ocean ranged from 1 x 10² to 7 x 10³ copies L-1, with 106
concentrations increasing through the lower euphotic zone, and ranging from 2 x 10⁵ to 2 107
x 107 copies L-1 through the mesopelagic waters (300-1000 m; Figure 3). 108
Despite distinct differences in biogeochemical properties, with one exception, 109
there were no notable differences in amoA gene abundances among the various stations 110
sampled (Figure 3). The one exception occurred within the mesopelagic waters of the 111
station sampled closest to the equator (1.7oN). Below the euphotic zone at this station, 112
amoA gene abundances were approximately an order of magnitude greater (exceeding 107 113
amoA copies L-1) than those sampled at any other station in this study (Figure 3; Table 1). 114
We also examined the vertical and meridional distributions of crenarchaea based 115
on QPCR amplification of Marine Group I (MGI) and psL12 phylotype crenarchaeal 16S 116
rRNA genes. Similar to the distributions observed in amoA genes, the MGI 16S rRNA 117
gene abundances were relatively low (~102 to 103 copies L-1) in the upper ocean (<100 118
m) and increased 3-4 orders of magnitude below the epipelagic layer (Figure 3). Similar 119
to patterns observed in amoA gene distributions, there were no clear regional differences 120
in MGI crenarchaeal 16S rRNA genes, except for the large increase in gene abundances 121
in the mesopelagic waters near the equator (1.7oN) (Figure 3; Table 1). 122
Gene abundances of the psL12 crenarchaeal phylotype were consistently lower 123
than those of the MGI, with psL12 gene abundances ranging from below detection (less 124
than approximately 2 x 101 copies L-1) in the upper ocean, to a maximum of 1 x 10⁵ 125
copies L-1 in the mesopelagic waters (Figure 2). Similar to the distributions of the other 126
crenarchaeal genes, the psL12 16S rRNA abundances generally increased with depth with 127
peak gene abundances (~103 to ~104 copies L-1) often occurring between 125 to 300 m 128
depth (Figure 3). As observed with the MGI and amoA gene abundances, concentrations 129
of the psL12 phylotype were greatest at the station near the equator (1.7oN). Unlike the 130
other phylotypes measured in this study however, the psL12 gene abundances measured 131
at this station were elevated throughout the upper ocean rather than the mesopelagic 132
waters (Figure 3). 133
Comparing the amoA gene abundances to the sum of the crenarchaeal 16S rRNA 134
gene abundances (MGI + psL12) revealed that at most depths and stations, amoA gene 135
abundances were very similar to 16S rRNA gene abundances (Figure 3; Table 1). The 136
resulting crenarchaeal amoA:16S rRNA gene ratios did not vary significantly with depth 137
(One-way ANOVA, P=0.06), although at several stations, the ratio was elevated in the 138
upper 150 m of the ocean and declined with increasing depth (Figure 3). The resulting 139
amoA to crenarchaeal 16S rRNA gene abundance ratio ranged between 0.4 and 13, 140
averaging 2.2 (± 2.6). 141
Crenarchaea amoA transcript abundances 142
In addition to evaluating archaeal gene copy abundances, we also examined 143
vertical and meridional patterns of crenarchaeal amoA gene expression based on RT-144
QPCR amplification of mRNA transcripts. Unlike gene abundances, amoA transcript 145
abundances tended to be less variable with depth. For example, in the near surface ocean, 146
amoA transcripts ranged between 9 x 10³ to 2 x 10⁵ transcripts L-1, increasing to between 147
1 x10⁴ to 1 x 10⁶ transcripts L-1in the dimly-lit regions of the lower euphotic zone (100-148
200 m; Figures 2). Below this zone of peak amoA expression, transcript abundances 149
declined by 1 to 2 orders of magnitude into the interior of the mesopelagic zone (Figure 150
4). Among the various regions sampled, transcript abundances were greatest in the 151
northern equatorial waters (8.6oN) where cold, N+N-enriched, and O2-depleted waters
152
upwelled into the upper ocean. At this station, amoA transcript abundances were 153
approximately 5-fold greater than those measured in other regions of the study site. In 154
contrast, the lowest amoA transcript abundances were measured at the near-equatorial 155
station (1.7oN), where amoA and 16S rRNA gene abundances were maximal. 156
One of the most notable differences between the distributions of crenarchaeal 157
amoA transcripts and gene abundances occurred in the upper ocean (<100 m) waters 158
where the abundance of archaeal amoA genes was relatively low, but transcripts were 159
relatively abundant. Throughout the well-lit upper ocean, the gene-copy normalized 160
amoA transcript abundances averaged ~102 transcripts per gene copy (Figure 4). The 161
copy normalized transcript abundances tended to approach unity between in the 162
transitional region separating the epipelagic from mesopelagic zone (125-200 m) before 163
decreasing with depth into the lower mesopelagic zone (Figure 4). In the mesopelagic 164
waters amoA gene abundances increased coincident with decreases in gene expression 165
resulting in low and spatially variable (ranging 1 x 10⁻⁴ and 6 x 10⁻¹) transcripts per gene 166
copy (Figure 4, Table 1). 167
168
Discussion 169
QPCR amplification of crenarchaeal amoA and 16S rRNA genes together with 170
RT-QPCR amplification of amoA mRNA transcripts provided insight into the 171
distributions and abundances of crenarchaeal amoA genes and transcripts across ~5200 172
km of the Pacific Ocean. At all stations sampled, amoA gene abundances increased 3 to 4 173
orders of magnitude between the near-surface ocean and the dimly-lit waters of the lower 174
mesopelagic zone. In contrast, amoA transcripts tended to be elevated in the transitional 175
waters (100-200 m) separating the epipelagic region from the mesopelagic zone. 176
Strikingly, when normalized to gene copies, amoA transcription was greatest throughout 177
the well-lit portions of the upper ocean. 178
To date, there is limited information on processes regulating the transcriptional 179
activities of ammonia oxidizing microorganisms in the sea. Laboratory studies with 180
cultivated marine ammonia oxidizing bacteria and natural assemblages of soil-dwelling 181
Crenarchaea indicate expression of the amo operon is upregulated by external 182
concentrations of ammonia (Treusch et al., 2005; Berube et al., 2007; El Sheikh and 183
Klotz, 2008). Although we did not measure ammonia concentrations as part of this 184
study, concentrations in the open ocean typically range in the 10s to 100s of nanomolar 185
(Lipschultz, 2001; Woodward and Rees, 2001; Rees et al., 2006), with peak 186
concentrations often measured in the mid to lower euphotic zone, above the depth of the 187
primary nitrite maxima (Gruber, 2008). Our finding that amoA gene transcript 188
abundances often peaked in the transitional region separating the euphotic zone from 189
mesopelagic waters could be consistent with the presumed depth-dependent changes in 190
the availability of ammonia. Temperature has also been shown to play a role in 191
regulating crenarchaeal amoA transcription in terrestrial soils (Tourna et al., 2008). In 192
the present study, we observed elevated gene-copy normalized amoA transcript 193
abundances throughout the warm upper ocean waters; however, we did not observe a 194
significant relationship (least-squares linear regression, P>0.05) between amoA 195
transcripts per gene copy and temperature in our study. 196
Prior studies evaluating crenarchaeal amoA transcription in the sea have largely 197
focused on regions where low concentrations of dissolved oxygen play an important role 198
in shaping N cycling processes. For example, in the Black Sea, Lam et al. (2007) 199
observed most active amoA transcription coincided with the vertical transition from oxic 200
to suboxic waters. Within this depth stratum, crenarchaeal amoA transcripts were ~104 201
transcripts L-1 (Lam et al., 2007). In the waters of the Peruvian upwelling region, 202
crenarchaeal amoA transcript abundances were somewhat greater than measured in the 203
Black Sea, ranging from ~105 to ~106 transcripts L-1. Peak transcript abundances in the 204
Peruvian upwelling waters occurred coincident with the top of the nitracline, where 205
dissolved O2 concentrations decreased to <10 µmol L-1
and ammonium concentrations 206
exceeded ~1 µmol L-1
(Lam et al., 2009). In the present study, transcript abundances 207
ranged between ~103 to ~106 transcripts L-1, with peak transcript abundances occurring 208
near the top of the nitracline in the O2 depleted, upwelled waters north of the equator
209
(8.6oN). However, although dissolved O2 concentrations of these upwelled waters were
210
lower than those measured at comparable depths along our transect, the O2 content of this
211
water was upwards of 65 µmol L-1
, suggesting the availability of O2 likely did not play a
212
major role in structuring N cycle processes in these waters. 213
The observation that total amoA transcript abundances often peaked in the dimly 214
lit region separating the epipelagic from the mesopelagic waters appears consistent with 215
previously reported depth-structure in rates of marine ammonia oxidation (Wada and 216
Hattori, 1971; Olson, 1981a; Ward, 1987; Yoshida et al., 1989; Dore and Karl, 1996a). 217
In the northern regions of the NPSG, Olson (1981a) found that rates of ammonia 218
oxidation ranged between 2.2 and 7.3 nmol N L-1 d-1,with peak rates coinciding with the 219
vertical position of the primary NO2- maxima of the lower euphotic zone (100-175 m).
220
Similarly, at Station ALOHA in the central NPSG, Dore and Karl (1996) found that rates 221
of ammonia oxidation ranged from 1 to 134 nmol L-1 d-1 in the upper 200 m of the water, 222
with peak rates typically occurring in the low light regions (150 -175 m) of the primary 223
nitrite maxima. 224
Previous studies that have demonstrated inhibitory influences of sunlight on 225
ammonia oxidation and growth of ammonia oxidizing bacteria (Olson, 1981b; Ward, 226
1987; Horrigan and Springer, 1990; Guerrero and Jones, 1996). Although the exact 227
mechanisms underlying this photoinhibition remain unknown, laboratory studies have 228
found evidence for reversible photooxidative damage to the ammonia monooxygenase 229
protein under low wavelength (<410 nm) radiation (Hooper and Terry, 1974; Hyman and 230
Arp, 1992). The influences of light on crenarchaeal ammonia oxidation activities or 231
transcriptional responses have not yet been reported. However, the observation that the 232
gene copy normalized amoA transcript abundances were elevated in the upper ocean 233
where light intensities were upwards of 80-90% of the incident flux raises the possibility 234
that marine Crenarchaea might be less sensitive to photoinhibition than their more well-235
studied bacterial counterparts. Alternatively, the observed depth-related changes in amoA 236
transcription may not reflect changes in the ammonia oxidation physiology of these 237
microorganisms, but rather reflects post-transcriptional or translational modification of 238
the transcribed gene product. As such, the elevated copy normalized transcriptional 239
activities observed throughout the upper ocean could reflect increased turnover of the 240
ammonia monooxygenase protein rather than increases in the per cell ammonia oxidation 241
activities. Future investigations focused specifically on examining the role of sunlight on 242
crenarchaeal ammonia oxidation, gene transcription, as well as proteomic analyses, 243
should provide insight to these transcriptional patterns. 244
A number of previous studies have examined depth-dependent structure in the 245
abundance of Archaea in the ocean; several of these studies provide evidence that 246
phylogenetically distinct populations of Crenarchaea vertically segregate within the epi-, 247
meso-, and bathypelagic waters (Massana et al., 2000; Francis et al., 2005; Hallam et al., 248
2006b; Mincer et al., 2007; Beman et al., 2008). In a recent study in the Gulf of 249
California, Beman et al. (2008) measured depth distributions of crenarchaeal amoA genes 250
together with 15N-based measurements of ammonia oxidation. These authors identified 251
two vertically segregated groups of phylogenetically distinct crenarchaeal clades; 252
intriguingly, rates of ammonia oxidation tended to be greatest in those regions where the 253
upper ocean clade was most abundant (Beman et al., 2008). Although the QPCR primers 254
utilized in the present study did not allow discrimination of the transcriptional activities 255
of these vertically separated amoA-containing crenarchaeal groups, we observed gene 256
copy normalized amoA transcript abundances were greatest in the epipelagic waters, 257
decreasing several orders of magnitude with increasing depth. This depth-dependent 258
decrease in gene copy normalized amoA transcript abundances would be consistent with 259
the presumed reduced input of ammonia accompanying vertical attenuation of particle 260
flux into the mesopelagic zone (Karl et al., 1984). However, the observation that 261
transcriptional activity appears greatest in the upper ocean opens the possibility that 262
despite low abundances, Crenarchaea might play a role in ammonia oxidation in the 263
epipelagic layers of the ocean. Such results might shed insight into microorganisms 264
responsible for upper ocean nitrification (Yool et al., 2007). 265
Over a wide range epi- and mesopelagic habitat conditions, we generally observed 266
close correspondence between crenarchaeal amoA gene abundances and total (MGI + 267
psL12) 16S rRNA gene abundances. Throughout the water column, the amoA : total 268
crenarchaeal 16S ratio averaged 2.2 (± 2.6), indistinguishable from previous estimates 269
published by Beman et al. (2008) and Wuchter et al. (2006). In our study, this ratio did 270
not vary significantly with depth, although the ratio was as great as 13 at one site in the 271
upper ocean (<100 m), and as low as 0.4 in the lower regions of the euphotic zone (150-272
175 m) at another station. 273
For all stations sampled along this transect, the mesopelagic crenarchaeal 274
amoA:16S rRNA gene ratio averaged 1.6 (± 1.2). A recent study reported crenarchaeal 275
amoA : MGI 16S rRNA gene ratios in the mesopelagic waters of the subtropical Atlantic 276
Ocean were often <10-2 (Agogue et al., 2008), a finding these authors’ attribute to an 277
increasing archaeal reliance on chemoheterotrophy rather than chemoautotrophy. In the 278
present study, across a large region of the subtropical and tropical Pacific Ocean, we 279
found no clear evidence of depth-dependent or regional changes in the crenarchaeal 280
amoA : 16S rRNA ratios between the near-surface ocean and the mesopelagic waters of 281
the central Pacific Ocean. The observation that crenarchaeal amoA :16S rRNA gene 282
ratios of the mesopelagic waters averaged 1.6 is generally consistent with previous QPCR 283
and metagenomic studies in the Pacific Ocean (Mincer et al., 2007; Beman et al., 2008; 284
Konstantinidis et al., 2009). However, such results appear contrary to the study by 285
Agogue et al (2008) in the Atlantic Ocean. These differences may stem from the 286
selection of QPCR primers utilized by these studies. Kostantinidis et al. (2009) reported 287
up to three mismatches in the reverse primer sequence used by Agogue et al. (2008) to 288
amoA phylotypes obtained from a metagenomic survey in the bathypelagic waters of the 289
subtropical North Pacific. We also examined the specificity of the QPCR primers 290
utilized by Agogue et al. (2008) against a database containing >200 publicly available 291
crenarchaeal amoA gene sequences derived from both PCR clone libraries and ocean 292
metagenomes. Consistent with the results of Kostantinidis et al. (2009), we found several 293
nucleotide mismatches in these primers to the dominant amoA phylotypes reported from 294
the meso- and bathypelagic waters of the Pacific Ocean. 295
Additional constraint on amoA to 16S rRNA gene ratios can be obtained based on 296
genomic and metagenomic sequences. The genome sequence of Nitrosopumilus 297
maritimus, a MGI Crenarchaeum, contains a single copy of the amoA gene. Similarly, 298
the Cenarchaeum symposium genome also contains a single gene copy of the amoA gene 299
(Hallam et al., 2006a). Moreover, metagenomic reconstruction of natural assemblages of 300
Crenarchaea in the bathypelagic waters of the Pacific Ocean indicates that when 301
normalized to gene length, the ratio of amoA to 16S rRNA genes approaches unity 302
(Konstantinidis et al., 2009). While our results suggest the majority of Crenarchaea in 303
the epi- and mesopelagic waters of the Pacific contain amoA genes, and thus are likely 304
capable of oxidizing ammonia for energy, such results do not preclude the likelihood that 305
marine Crenarchaea utilize diverse metabolic pathways, including chemoheterotrophy, 306
for growth. Numerous studies indicate MGI Crenarchaea are capable of assimilating 307
both inorganic and organic carbon substrates during growth (Teira et al., 2006a; 308
Kirchman et al., 2007; Varela et al., 2008), and metagenomic analyses suggest these 309
microorganisms have the capacity to utilize other forms of reduced N, including urea as 310
potential sources of energy (Hallam et al., 2006b). 311
In conclusion, QPCR amplification of crenarchaeal genes and RT-QPCR 312
amplification of amoA gene transcripts provided information on the spatial distributions 313
and transcriptional activities of these microorganisms in the Pacific Ocean. Crenarchaeal 314
abundances demonstrated strong vertical structure with greatest abundances observed in 315
the dimly-lit waters of the mesopelagic zone. In contrast, crenarchaeal amoA gene 316
expression was less variable with depth, and generally decreased below the euphotic 317
zone. When normalized to gene copy abundances, the resulting patterns of transcitpnio 318
suggest that despite low abundances, Crenarchaea may be physiologically active in 319
ammonia oxidation throughout the euphotic zone. Future studies focused on defining 320
specific processes controlling crenarchaeal physiology (e.g. light, ammonia, temperature, 321
dissolved oxygen) and abundance (e.g. grazing and viral infection), should provide 322
important new insights into controls on ammonia oxidation in the sea. 323 324 Experimental Procedures 325 Biogeochemical analyses 326
Seawater samples for subsequent biogeochemical analyses were collected from 327
discrete depths in the upper ocean using twenty four 10 liter PVC sampling bottles 328
attached to a Conductivity-Temperature-Depth (CTD) rosette sampling system. In total, 329
8 to 12 discrete depths were sampled from vertical profiles (0-1000 m) at 9 locations 330
between ~16oS, 170oW and 22.75oN, 158oW in the Pacific Ocean (Figure 1). Two 331
stations were sampled in the warm, low chlorophyll northern waters of the South Pacific, 332
including a station in the subtropical gyre (16oS, 170oW) and a station in the eastern 333
portion of Western Pacific Warm Pool (7.5oS, 167oW). Samples were also collected from 334
within the near-equatorial waters of both the North and South Pacific (3.0oS, 166oW; 335
1.7oN, 163oW; 5.1oN, 161oW; 8.6oN, 161oW), and at three stations in the NPSG (13.5oN, 336
159oW; 16.9oN, 159oW; 22.75oN, 158oW). 337
High vertical resolution vertical scale (1 m) hydrographic data in the upper ocean 338
was obtained using a Sea Bird CTD equipped with dissolved oxygen and fluorescence 339
sensors. The dissolved oxygen and fluorescence sensors were calibrated against discrete 340
measurements of dissolved oxygen (Carritt and Carpenter, 1966) and chloropigment 341
(chlorophyll + phaeopigment) fluorescence (Letelier et al., 1996). Seawater for 342
determination of nutrient concentrations was subsampled into acid washed 125 ml or 500 343
ml polyethylene bottles and the bottles were capped and frozen upright. At the shore-344
based laboratory, high sensitivity measurements of NO3- + NO2- (N+N) were determined
345
based on the chemiluminescence methodology developed by Garside (1982) as modified 346
by Dore and Karl (1996b). 347
Nucleic acid sampling 348
Seawater samples for subsequent extraction of planktonic nucleic acids were 349
collected from 10 discrete depths spanning the epi- and mesopelagic zones (15 m to 1000 350
m) at 8 stations located between ~16oS, to 16.9oN during the CMORE-BULA (Center for 351
Microbial Oceanography: Research and Education-Biogeochemistry Underwater: a 352
Latitudinal Assessment) research cruise (April 15-26, 2007). Additional samples were 353
collected from 12 discrete depths (15 m to 1000 m) during a Hawaii Ocean Time-series 354
(HOT) program cruise (May 3-7, 2007) to Station ALOHA (22.75˚N, 158˚W) in the 355
North Pacific Subtropical Gyre (NPSG). Seawater samples were collected using 10-liter 356
polyvinyl chloride (PVC) bottles attached to a conductivity-temperature-depth (CTD) 357
rosette sampler. Water was subsampled from the CTD rosette into 10 liter, acid-rinsed 358
polyethylene carboys and between 2 and 4 liters was immediately filtered using a 359
peristaltic pump onto 25 mm diameter 0.2 µm pore size Supor® filters (Pall Gelman, 360
Inc.). Upon completion of filtration, the filters were removed from the filter holders and 361
placed in 2 ml microcentrifuge tubes. Filters for subsequent RNA extraction were 362
immersed in 500 µl RLT buffer (Qiagen RNeasy) containing 1% β-mercaptoethanol. 363
Filters for subsequent DNA extraction were immersed in 500 µl of lysis buffer (20 mM 364
Tris-HCL, pH 8.0; 2 mM EDTA, pH 8.0; 1.2% Triton X and 20 mg ml-1 lysozyme). 365
Samples were immediately flash frozen in liquid nitrogen then stored at -80oC until 366
processed in the shore-based laboratory. 367
Nucleic acid extraction, QPCR, and RT-QPCR 368
Planktonic RNA was extracted following the protocol described in Church et al. 369
(2005). Briefly, 0.2 g of 0.1 mm glass beads were added to microcentrifuge tubes 370
containing the sample filters and the tubes were placed inside a Fast Prep machine (Bio 371
101, Carlsbad, CA. USA) and agitated for 1.5 minutes. Following this bead beating step, 372
tubes were centrifuged at 8500 x g for 30 seconds, and the supernatants transferred to 373
clean 2 ml microcentrifuge tubes with an equal volume of 70% ethanol. Samples were 374
applied to Qiagen RNeasy® Mini columns (Qiagen, Valencia, CA. USA.) and total RNA 375
was purified and eluted following the manufacturer’s specifications. RNA extracts were 376
treated with DNase I following the Qiagen On-Column DNase I® RNA extraction 377
protocol; RNA was eluted from spin column with 30 µl RNase-free water and stored 378
frozen at –80ºC. RNA concentrations were determined fluorometrically using the Quant-379
iT® RNA assay kit (Invitrogen, Carlsbad, CA., USA) and a Turner TD-700 fluormeter 380
(Turner Designs, Sunnyvale, CA. USA). 381
Microcentrifuge tubes containing the sample filters for DNA extraction were 382
placed in a water bath at 37oC for 1 hour, after which 84 µl of proteinase K and 600 µl of 383
lysis buffer AL (Qiagen DNeasy) were added to each sample. Samples were vortexed 384
and placed in a hybridization oven at 70oC for 30 minutes. Following this incubation, 385
668 µl of 100% ethanol was added to each sample, and the microcentrifuge tubes were 386
vortexed and transferred to Qiagen DNeasy spin columns. DNA was purified following 387
the manufacturer’s recommended protocols. DNA concentrations were determined using 388
the Quant-iT® DNA assay protocol and quantified fluorometrically. 389
Total RNA was reverse transcribed (RT) using SuperScript® III first strand cDNA 390
synthesis kit (Invitrogen) following the manufacturer’s specifications. cDNA reactions 391
consisted of 2-4 ng total RNA, 1 mmol L-1 dNTPs, 1X RT buffer, 5 mmol L-1 MgCl2, 10
392
mmol L-1 DTT, 40 U RNaseOUT (Invitrogen), 200 U SuperScript III RT, and 0.5 µmol 393
L-1 of the anti-sense gene specific primer (CrenAmoAModR; Mincer et al. 2007). Upon 394
completion of the cDNA synthesis, 1 U RNase H was added to each reaction. The 395
resulting cDNA was diluted to 50 µl total volume with nuclease-free water, and stored at 396
–20ºC until analyzed by QPCR assays. An identical set of reactions minus the reverse-397
transcriptase (no-RT reactions) were performed for each RNA extract; these reactions 398
served as controls to examine the potential contributions of carryover genomic DNA on 399
the RT-QPCR amplification of the cDNA. 400
Crenarchaeal amoA transcript abundances and copy abundances of crenarchaeal 401
amoA and 16S rRNA genes were examined using previously described QPCR protocols 402
(Mincer et al., 2007). The QPCR assays consisted of duplicate 25 µl reactions 403
containing: 12.5 µl 2X SyberGreen Master Mix (Applied Biosystems, Foster City, CA. 404
USA), 8 µl of nuclease-free water, 2 µl of environmental DNA or cDNA reaction mixes 405
(including no-RT reactions), and 0.5 µM final concentration of both forward and reverse 406
primers. QPCR reactions were analyzed using an Applied Biosystems 7300, following 407
the thermal cycling reaction conditions described in Mincer et al. (2007). Standards for 408
the QPCR and RT-QPCR reactions for the amoA and MGI 16S rRNA consisted of serial 409
10-fold dilutions of plasmids containing amplified fragments of the targeted genes of 410
interest. QPCR amplification efficiencies averaged 99%; 98%, 94%, and 104% for the 411
crenarcaheal amoA transcripts and gene copies of amoA, 16S rRNA, and psL12 412
phylotypes, respectively. 413
Acknowledgements 414
We are grateful to the numerous scientists and staff that contributed to the success 415
of the CMORE-BULA cruise; of particular note, Karin Björkman, Claire Mahaffey, 416
Susan Curless, Donn Viviani, Blake Watkins, Lance Fujieki, and Brett Updyke all 417
assisted with sample collections, analyses, and data management. We acknowledge the 418
helpful support of the R/V Kilo Moana captain and crew. Brenner Wai was supported by 419
the CMORE Scholars program. This project was supported by grants from the National 420
Science Foundation: OCE 0425363 to M.J.C., OCE03-26616 to D.M.K., and EF 0424599 421
(CMORE) to D.M.K. and E.F.D, with additional support from the Gordon and Betty 422
Moore Foundation Marine Microbiology Initiative (to D.M.K and E.F.D). 423
Figure Legends 424
425
Figure 1. Contour plots depicting vertical and meridional distributions in ocean 426
temperature (upper panel), nitrate + nitrite (N+N; middle panel), and dissolved O2
427
(bottom panel). Stations and depths sampled as part of this study depicted by filled 428
symbols. 429
430
Figure 2. Depth-dependent variations in biogeochemical properties and crenarchaeal 431
amoA gene abundance and gene transcripts at selected stations in the subtropical South 432
Pacific (7.5oS; A, B), near-equatorial (1.7oN; C, D), northern equatorial (8.6oN; E, F), and 433
subtropical North Pacific Ocean (22.75oN; G, H). (Top panels) Chloropigment 434
concentrations (green circles), N+N (open diamonds), and dissolved O2 (cyano circles).
435
(Bottom panels) log10 crenarchaeal amoA genes (red circles) and amoA transcript
436
abundances (blue triangles). 437
438
Figure 3. Vertical profiles of crenarchaeal amoA (A), MGI 16S rRNA (B), and psL12-439
related phylotype 16S rRNA (C) gene abundances for all stations sampled. Ratio of 440
Crenarcaheal amoA to total Crenarchaea 16S rRNA (MGI + psL12) gene copies; dotted 441
line depicts 1:1 ratio (D). 442
443
Figure 4. Vertical profiles of crenarchaeal amoA gene transcript abundances (A) and 444
ratio of amoA transcripts per gene copy (B). Dotted line depicts 1:1 ratio. 445
Table 1. Variability in depth-averaged concentrations of nitrate + nitrite (N+N), dissolved O2, and crenarchaeal genes (amoA and 16S
447
rRNA) and crenarchaeal amoA gene transcripts at stations sampled for this study. Depth-averaged concentrations calculated based on 448
depth-integrated inventories divided by integration depth for each property. 449 Property 16.0oS 7.5oS 3.0oS 1.7oN 5.1oN 8.6oN 13.5oN 16.9oN 22.75oN MLD (m) 1% PAR (m) 47 ND 68 ND 90 ND 110 104 102 116 81 107 66 163 29 127 55 115 0-100 m N+N (µmol N L-1 ) O2 (µmol O2 L-1)
amoA genes (genes L-1)
MGI + psL12 rRNA genes (genes L-1)
amoA transcripts (transcripts L-1)
amoA transcripts per gene
3 x 10⁻² 209 2.5 x 10³ 1.8 x 10³ 8.1 x 10⁴ 3.2 x 101 1.4 x 10⁻¹ 202 2.3 x 10³ 1.4 x 10³ 4.0 x 10⁴ 1.8 x 101 3.9 203 1.0 x 10⁴ 1.6 x 10⁴ 1.3 x 10⁵ 1.3 x 101 4.9 196 2.4 x 10⁴ 1.0 x 10⁴ 3.5 x 10³ 1.5 x 10⁻¹ 2.8 202 6.7 x 10³ 3.9 x 10³ 2.5 x 10⁴ 3.7 x 100 1.8 200 7.5 x 10³ 8.4 x 10² 6.4 x 10⁴ 8.5 x 100 6 x 10⁻³ 213 ND ND ND 5 x 10⁻³ 215 8.5 x 10² 5.4 x 10² 4.8 x 10⁴ 5.6 x 101 4 x 10⁻³ 213 8.2 x 10³ 5.2 x 10³ 2.5 x 10⁴ 3.1 x 100 100-300 m N+N (µmol N L-1 ) O2 (µmol O2 L-1)
amoA genes (genes L-1)
MGI + psL12 rRNA genes (genes L-1)
amoA transcripts (transcripts L-1)
amoA transcripts per gene
3.4 241 8.6 x 10⁵ 9.9 x 10⁵ 7.1 x 10⁴ 8.3 x 10⁻² 8.8 193 1.6 x 10⁶ 3.3 x 10⁶ 2.2 x 10⁵ 1.4 x 10⁻¹ 20 170 2.3 x 10⁶ 2.5 x 10⁶ 3.9 x 10⁵ 1.7 x 10⁻¹ 21 173 1.8 x 10⁷ 1.7 x 10⁷ 5.3 x 10³ 2.8 x 10⁻⁴ 23 151 1.4 x 10⁶ 1.7 x 10⁶ 2.1 x 10⁵ 1.5 x 10⁻¹ 28 119 1.6 x 10⁶ 5.6 x 10⁵ 5.0 x 10⁵ 3.1 x 10⁻¹ 18 173 ND ND ND 8.9 243 4.9 x 10⁵ 4.1 x 10⁵ 2.1 x 10⁵ 4.3 x 10⁻¹ 3.4 207 6.8 x 10⁵ 1.9 x 10⁶ 3.1 x 10⁵ 4.5 x 10⁻¹ 300-1000 m N+N (µmol N L-1 ) O2 (µmol O2 L-1)
amoA genes (genes L-1)
MGI + psL12 rRNA genes (genes L-1)
amoA transcripts (transcripts L-1)
amoA transcripts per gene
28 182 1.2 x 10⁶ 1.2 x 10⁶ 1.8 x 10⁴ 1.5 x 10⁻² 33 129 2.5 x 10⁶ 3.8 x 10⁶ 7.9 x 10⁴ 3.2 x 10⁻² 41 77 2.9 x 10⁶ 3.7 x 10⁶ 1.7 x 10⁵ 6.0 x 10⁻² 39 94 2.1 x 10⁷ 1.6 x 10⁷ 9.0 x 10³ 4.3 x 10⁻⁴ 43 66 1.8 x 10⁶ 1.9 x 10⁶ 6.1 x 10⁴ 3.3 x 10⁻² 43 47 2.9 x 10⁶ 7.6 x 10⁵ 1.3 x 10⁵ 4.4 x 10⁻² 43 29 2.3 x 10⁶ 6.9 x 10⁵ 2.4 x 10⁴ 1.0 x 10⁻² 39 83 7.4 x 10⁵ 6.2 x 10⁵ 7.9 x 10⁴ 1.1 x 10⁻¹ 34 119 2.9 x 10⁵ 3.0 x 10⁵ 1.5 x 10⁵ 5.2 x 10⁻¹ 450 451
References 452
Agogue, H., Brink, M., Dinasquet, J., Herndl, G. J. (2008) Major gradients in putatively 453
nitrifying and non-nitrifying Archaea in the deep North Atlantic. Nature 456: 788-454
792 455
Beman, J. M., Popp, B. N., Francis, C. A. (2008) Molecular and biogeochemical evidence 456
for ammonia oxidation by marine Crenarchaeota in the Gulf of California. ISME J 457
2: 429-441 458
Berube, P. M., Samudrala, R., Stahl, D. A. (2007) Transcription of all amoC copies is 459
associated with recovery of Nitrosomonas europaea from ammonia starvation. J 460
Bacteriol 189: 3935-3944 461
Carritt, D. E., Carpenter, J. H. (1966) Comparison and evaluation of currently employed 462
modifications of the Winkler method for determining dissolved oxygen is 463
seawater: a NASCO report. J Mar Res 24: 286-318 464
Church, M. J., Short, C. M., Jenkins, B. D., Karl, D. M., Zehr, J. P. (2005) Temporal 465
patterns of nitrogenase (nifH) gene expression in the oligotrophic North Pacific 466
Ocean. Appl Environ Microbiol 71: 5362-5370 467
Delong, E. F. (1992) Archaea in coastal marine environments. Proc Natl Acad Sci USA 468
89: 5685-5689 469
DeLong, E. F., Preston, C. M., Mincer, T., Rich, V., Hallam, S. J., Frigaard, N. U., et al. 470
(2006) Community genomics among stratified microbial assemblages in the 471
ocean's interior. Science 311: 496-503 472
Dore, J. E., Karl, D. M. (1996a) Nitrification in the euphotic zone as a source for nitrite, 473
nitrate, and nitrous oxide at Station ALOHA. Limnol Oceanogr 41: 1619-1628 474
Dore, J. E., Karl, D. M. (1996b) Nitrite distributions and dynamics at station ALOHA. 475
Deep-Sea Res II 43: 385-402 476
El Sheikh, A. F., Klotz, M. G. (2008) Ammonia-dependent differential regulation of the 477
gene cluster that encodes ammonia monooxygenase in Nitrosococcus oceani 478
ATCC 19707. Environ Microbiol 10: 3026-3035 479
Francis, C. A., Roberts, K. J., Beman, J. M., Santoro, A. E., Oakley, B. B. (2005) 480
Ubiquity and diversity of ammonia-oxidizing archaea in water columns and 481
sediments of the ocean. Proc Natl Acad Sci USA 102: 14683-14688 482
Fuhrman, J. A., McCallum, K., Davis, A. A. (1992) Novel major archaebacterial group 483
from marine plankton. Nature 356: 148-149 484
Garside, C. (1982) A chemi-luminescent technique for the determination of nanomolar 485
concentrations of nitrate and nitrite in seawater. Mar Chem 11: 159-167 486
Gruber, N. (2008) The marine nitrogen cycle: overview and challenges. In: D. A. B. D.G. 487
Capone, M.R. Mulholland, E.J. Carpenter (ed) Nitrogen in the Marine 488
Environment. Elsevier Inc., Amsterdam, p 1-50 489
Guerrero, M. A., Jones, R. D. (1996) Photoinhibition of marine nitrifying bacteria. 1. 490
Wavelength-dependent response. Mar Ecol Prog Ser 141: 183-192 491
Hallam, S. J., Konstantinidis, K. T., Putnam, N., Schleper, C., Watanabe, Y., Sugahara, 492
J., et al. (2006a) Genomic analysis of the uncultivated marine crenarchaeote 493
Cenarchaeum symbiosum. Proc Natl Acad Sci USA 103: 18296-18301 494
Hallam, S. J., Mincer, T. J., Schleper, C., Preston, C. M., Roberts, K., Richardson, P. M., 495
et al. (2006b) Pathways of carbon assimilation and ammonia oxidation suggested 496
by environmental genomic analyses of marine Crenarchaeota. PLoS Biol 4: 520-497
536 498
Hansman, R. L., Griffin, S., Watson, J., Druffel, E. R. M., Ingalls, A. E., Aluwihare, L. I. 499
(2009) The radiocarbon signature of microorganisms in the mesopelagic ocean. 500
Proc Natl Acad Sci USA 106: 6513-6518 501
Herndl, G. J., Reinthaler, T., Teira, E., van Aken, H., Veth, C., Pernthaler, A., et al. 502
(2005) Contribution of Archaea to total prokaryotic production in the deep 503
Atlantic Ocean. Appl Environ Microbiol 71: 2303-2309 504
Hooper, A. B., Terry, K. R. (1974) Photoinactivation of ammonia oxidation in 505
Nitrosomonas. J Bacteriol 119: 899-906 506
Horrigan, S. G., Springer, A. L. (1990) Oceanic and estuarine ammonium oxidation - 507
effects of light. Limnol Oceanogr 35: 479-482 508
Hyman, M. R., Arp, D. J. (1992) 14C2H2 labeling and 14CO2 labeling studies of the de
509
novo synthesis of polypeptides by Nitrosomonas europaea during recovery from 510
acetylene and light inactivation of ammonia monooxygenase. J Biol Chem 267: 511
1534-1545 512
Ingalls, A. E., Shah, S. R., Hansman, R. L., Aluwihare, L. I., Santos, G. M., Druffel, E. R. 513
M., et al. (2006) Quantifying archaeal community autotrophy in the mesopelagic 514
ocean using natural radiocarbon. Proc Natl Acad Sci USA 103: 6442-6447 515
Karl, D. M., Knauer, G. A., Martin, J. H., Ward, B. B. (1984) Bacterial chemolithotrophy 516
in the ocean is associated with sinking particles. Nature 309: 54-56 517
Karner, M. B., DeLong, E. F., Karl, D. M. (2001) Archaeal dominance in the 518
mesopelagic zone of the Pacific Ocean. Nature 409: 507-510 519
Kirchman, D. L., Elifantz, H., Dittel, A. I., Malmstrom, R. R., Cottrell, M. T. (2007) 520
Standing stocks and activity of Archaea and Bacteria in the western Arctic Ocean. 521
Limnol Oceanogr 52: 495-507 522
Konneke, M., Bernhard, A. E., de la Torre, J. R., Walker, C. B., Waterbury, J. B., Stahl, 523
D. A. (2005) Isolation of an autotrophic ammonia-oxidizing marine archaeon. 524
Nature 437: 543-546 525
Konstantinidis, K. T., Braff, J., Karl, D. M., DeLong, E. F. (2009) Comparative 526
metagenomic analysis of an abyssal microbial community from 4000 m deep at 527
Station ALOHA in the North Pacific Subtropical Gyre. Appl Environ Microbiol 528
75: 5345-5355 529
Lam, P., Jensen, M. M., Lavik, G., McGinnis, D. F., Muller, B., Schubert, C. J., et al. 530
(2007) Linking crenarchaeal and bacterial nitrification to anammox in the Black 531
Sea. Proc Natl Acad Sci USA 104: 7104-7109 532
Lam, P., Lavik, G., Jensen, M. M., van de Vossenberg, J., Schmid, M., Woebken, D., et 533
al. (2009) Revising the nitrogen cycle in the Peruvian oxygen minimum zone. 534
Proc Natl Acad Sci USA 106: 4752-4757 535
Letelier, R. M., Dore, J. E., Winn, C. D., Karl, D. M. (1996) Seasonal and interannual 536
variations in photosynthetic carbon assimilation at Station ALOHA. Deep-Sea 537
Res II 43: 467-490 538
Lipschultz, F. (2001) A time-series assessment of the nitrogen cycle at BATS. Deep-Sea 539
Res II 48: 1897-1924 540
Martin-Cuadrado, A. B., Rodriguez-Valera, F., Moreira, D., Alba, J. C., Ivars-Martinez, 541
E., Henn, M. R., et al. (2008) Hindsight in the relative abundance, metabolic 542
potential and genome dynamics of uncultivated marine archaea from comparative 543
metagenomic analyses of bathypelagic plankton of different oceanic regions. 544
ISME J 2: 865-886 545
Massana, R., DeLong, E. F., Pedros-Alio, C. (2000) A few cosmopolitan phylotypes 546
dominate planktonic archaeal assemblages in widely different oceanic provinces. 547
Appl Environ Microbiol 66: 1777-1787 548
Mincer, T. J., Church, M. J., Taylor, L. T., Preston, C., Kar, D. M., DeLong, E. F. (2007) 549
Quantitative distribution of presumptive archaeal and bacterial nitrifiers in 550
Monterey Bay and the North Pacific Subtropical Gyre. Environ Microbiol 9: 551
1162-1175 552
Olson, R. J. (1981a) 15N tracer studies of the primary nitrite maximum. J Mar Res 39: 553
203-226 554
Olson, R. J. (1981b) Differential photoinhibition of marine nitrifying bacteria - a possible 555
mechanism for the formation of the primary nitrite maximum. J Mar Res 39: 227-556
238 557
Ouverney, C. C., Fuhrman, J. A. (2000) Marine planktonic Archaea take up amino acids. 558
Appl Environ Microbiol 66: 4829-4833 559
Pearson, A., McNichol, A. P., Benitez-Nelson, B. C., Hayes, J. M., Eglinton, T. I. (2001) 560
Origins of lipid biomarkers in Santa Monica Basin surface sediment: A case study 561
using compound-specific delta 14C analysis. Geochim Cosmochim Acta 65: 3123-562
3137 563
Rees, A. P., Woodward, E. M. S., Joint, I. (2006) Concentrations and uptake of nitrate 564
and ammonium in the Atlantic Ocean between 60 degrees N and 50 degrees S. 565
Deep-Sea Res II 53: 1649-1665 566
Teira, E., Lebaron, P., van Aken, H., Herndl, G. J. (2006a) Distribution and activity of 567
Bacteria and Archaea in the deep water masses of the North Atlantic. Limnol 568
Oceanogr 51: 2131-2144 569
Teira, E., van Aken, H., Veth, C., Herndl, G. J. (2006b) Archaeal uptake of enantiomeric 570
amino acids in the meso- and bathypelagic waters of the North Atlantic. Limnol 571
Oceanogr 51: 60-69 572
Tourna, M., Freitag, T. E., Nicol, G. W., Prosser, J. I. (2008) Growth, activity and 573
temperature responses of ammonia-oxidizing archaea and bacteria in soil 574
microcosms. Environ Microbiol 10: 1357-1364 575
Treusch, A. H., Leininger, S., Kletzin, A., Schuster, S. C., Klenk, H. P., Schleper, C. 576
(2005) Novel genes for nitrite reductase and Amo-related proteins indicate a role 577
of uncultivated mesophilic crenarchaeota in nitrogen cycling. Environ Microbiol 578
7: 1985-1995 579
Varela, M. M., van Aken, H. M., Sintes, E., Herndl, G. J. (2008) Latitudinal trends of 580
Crenarchaeota and Bacteria in the meso- and bathypelagic water masses of the 581
Eastern North Atlantic. Environ Microbiol 10: 110-124 582
Wada, E., Hattori, A. (1971) Nitrite metabolism in the euphotic layer of the central North 583
Pacific Ocean. Limnol Oceanogr 16: 766-772 584
Ward, B. B. (1987) Nitrogen transformations in the Southern California Bight. Deep-Sea 585
Res I 34: 785-805 586
Woodward, E. M. S., Rees, A. P. (2001) Nutrient distributions in an anticyclonic eddy in 587
the northeast Atlantic Ocean, with reference to nanomolar ammonium 588
concentrations. Deep-Sea Res II 48: 775-793 589
Wuchter, C., Abbas, B., Coolen, M. J. L., Herfort, L., van Bleijswijk, J., Timmers, P., et 590
al. (2006) Archaeal nitrification in the ocean. Proc Natl Acad Sci USA 103: 591
12317-12322 592
Yool, A., Martin, A. P., Fernandez, C., Clark, D. R. (2007) The significance of 593
nitrification for oceanic new production. Nature 447: 999-1002 594
Yoshida, N., Morimoto, H., Hirano, M., Koike, I., Matsuo, S., Wada, E., et al. (1989) 595
Nitrification rates and 15N abundances of N2O and NO3- in the Western North
596
Pacific. Nature 342: 895-897 597
598 599
Depth (m)
200
400
600
800
1000
0 6 12 18 24 30 42Depth (m)
200
400
600
800
1000
0 5 10 15 20 25 30 35-15
-10
-5
0
5
10
15
20
Depth (m)
200
400
600
800
1000
50 100 150 175 200 225T
e
mp
erature (
oC)
N + N (
µ
mo
l L
-1)O
2(µ
mo
l L
-1)
Depth (m)
0 200 400 600 800 1000 0 100 200 300Depth (m)
0 200 400 600 800 1000 0.0 0.5 1.0 0 10 20 30 40 50Dissolved O
2(
µmol L
-1)
0 100 200 300Chloropigment fluorescence (
µg L
-1)
0.0 0.5 1.0Nitrate +Nitrite (
µmol L
-1)
0 10 20 30 40 50 0 100 200 300 0.0 0.5 1.0 0 10 20 30 40 50 0 100 200 300 0.0 0.5 1.0 0 10 20 30 40 50
A
B
C
D
E
F
G
H
amoA genes
(log
10copies L
-1)
2 4 6 8Depth (m)
0 200 400 600 800 1000psL12 16S rRNA genes
(log
10copies L
-1)
2 4 6 8A
C
16S rRNA genes
(log
10copies L
-1)
2 4 6 8B
8.6
oN
13.5
oN
16.9
oN
22.75
oN
16
oS
7.5
oS
3
oS
1.7
oN
5.1
oN
log
10(amoA : 16S rRNA)
-1.0 -0.5 0.0 0.5 1.0 1.5 2.0
amoA transcript abundance
(log
10transcripts L
-1)
2 4 6 8Depth (m)
0 200 400 600 800 1000log
10amoA transcripts per gene copy
-8 -6 -4 -2 0 2 4 6 8