HAL Id: hal-00304707
https://hal.archives-ouvertes.fr/hal-00304707
Submitted on 1 Jan 2002HAL is a multi-disciplinary open access archive for the deposit and dissemination of sci-entific research documents, whether they are pub-lished or not. The documents may come from teaching and research institutions in France or abroad, or from public or private research centers.
L’archive ouverte pluridisciplinaire HAL, est destinée au dépôt et à la diffusion de documents scientifiques de niveau recherche, publiés ou non, émanant des établissements d’enseignement et de recherche français ou étrangers, des laboratoires publics ou privés.
southern England ? a simple methodology
K. J. Limbrick
To cite this version:
K. J. Limbrick. Estimating daily recharge to the Chalk aquifer of southern England ? a simple methodology. Hydrology and Earth System Sciences Discussions, European Geosciences Union, 2002, 6 (3), pp.485-496. �hal-00304707�
Estimating daily recharge to the Chalk aquifer of southern
England – a simple methodology
K.J. Limbrick
Aquatic Environments Research Centre, Department of Geography, University of Reading, Whiteknights, Reading, RG6 6AB, UK. ` Email: [email protected]
Abstract
A simple, practical model for estimating daily recharge - as hydrologically effective rainfall (HER) - to the Chalk outcrop of southern England is presented. Daily meteorological observations are the only data requirements. The model was calibrated for a Chalk river, the Wey, in south Dorset. Six different root constant thresholds were used to estimate daily actual evapotranspiration (AET) rates for the river. The model was then used to calculate HER using the six estimates of AET. Daily mean flow was simulated using three different models: CAPTAIN, IHACRES and INCA. The six HER estimates provided independent model inputs. HER calculated using a root constant of 200mm proved suitable not only for the Wey, but also (via a validation exercise) for other rivers on the Chalk of southern England for riverflow simulations as well as the timing and magnitude of groundwater recharge. The results suggest that a root constant of 200mm is optimal for the Chalk outcrop of southern England. The model is particularly useful for studies where the application of more complex methods of recharge estimation is impractical.
Keywords: Chalk aquifer, root constant, recharge, Hydrologically Effective Rainfall, model, riverflow, CAPTAIN, IHACRES, INCA, River
Wey
Introduction
The Chalk aquifer is a crucial element of the water resources of the UK, contributing up to 60% of all groundwater abstractions (Burt and Trudgill, 1993; Downing, 1998). Understanding possible changes in the timing and magnitude of recharge to the Chalk as a result of land use (Finch, 2000) and climate changes (Arnell and Reynard, 2000) requires the estimation of daily recharge. Similarly, studies of groundwater pollution (Lawrence et al., 1996; Gooddy et
al., 2001), solute transport (Wellings and Bell, 1980) and
catchment water balances (Greenfield, 1984) rely inherently on estimates of the timing and magnitude of aquifer recharge. Thus, the quick and effective estimation of daily recharge — as hydrologically effective rainfall (HER) — is of value both to modelling studies (Whitehead et al., 1998b; Limbrick
et al., 2000) and field studies (for example the UK Lowland Catchment Research – LOCAR – project) as HER controls
many hydrological processes.
Presently, there are several methods for estimating recharge to the Chalk aquifer. A study by the former National
Rivers Authority (now the Environment Agency) concluded that up to three methods of groundwater recharge estimation could be applied in a region (Finch et al., 1997). Available methods range from relatively simple models such as the Penman-Grindley model (see for example, Lerner et al., 1990) to more complicated models based on field observations, like the Four Root Layers Model — FRLM (Ragab et al., 1997). The FRLM was modified to produce statistically based estimates of annual groundwater recharge by Finch et al (1997). The Meteorological Office Rainfall and Evaporation Calculation System — MORECS (Hough
et al., 1995) estimates HER, and thus recharge, using data
from over 140 weather stations across the UK, and by generalising regional land use types. Recharge to the Chalk aquifer of southern England has also been estimated using lysimeter studies (Kitching and Shearer, 1982) and soil moisture experiments (Wellings, 1984).
These methods, however, give large variations in annual recharge estimates and the field studies required are often impractical in terms of time constraints and cost, especially
if daily data are required. The methodology can be complex and many models require specific input data that are not always readily available.
This paper presents a simple model for estimating daily recharge (as HER) to the Chalk outcrop of southern England. The model requires only daily meteorological observations, and so is of particular use in studies where the application of a more complicated technique is impractical.
Method
HYDROLOGICALLY EFFECTIVE RAINFALL
Generally, recharge to the Chalk aquifer occurs when the demands of evaporation and vegetation have been met and soil moisture deficits (SMDs) replenished. In the absence of detailed field observations of soil and plant characteristics, recharge can be estimated by calculating Hydrologically Effective Rainfall (HER) which is rainfall less all losses arising from the demands of evaporation, transpiration and changes in soil moisture. On the Chalk outcrop, where surface runoff can be considered negligible, HER matches total aquifer recharge closely because the majority of HER will infiltrate through the soil and unsaturated zone.
ESTIMATING ACTUAL EVAPOTRANSPIRATION
The calculation of HER requires the estimation of actual evapotranspiration (AET). Transpiration is maintained at the potential rate (PET) until SMDs reach a point after which plants have difficulty accessing stored water. For SMDs above this critical threshold, transpiration rates are reduced significantly (AET).
PET can be calculated using meteorological observations. In the absence of detailed field data, AET can be estimated using a root constant. A root constant value indicates a critical SMD after which plant transpiration becomes increasingly limited.
Root constants of around 75 mm are used for many aquifers (Headworth, 1970). Although spatially variable, the unique hydrogeological characteristics of the Chalk may result in a considerably higher root constant value than for other aquifers, for all vegetation types (Wellings, 1984; Finch, 2000). Penman (1950) proposed a root constant of 125 mm for short vegetation on the Essex Chalk whereas other studies have suggested an even higher root constant for the outcrop (Wellings and Bell, 1980). A field study on the Hampshire Chalk found that actual evapotranspiration equaled the potential rate for SMDs up to 200 mm, suggesting a root constant of at least 175 mm (Wellings, 1984).
The model presented here requires estimates of daily AET to calculate recharge. AET was estimated using several root constant thresholds. The model was then used to calculate HER using the estimates of AET. The optimal root constant for the Chalk of southern England was determined by how well these estimates of HER explained observed riverflow. Six independent root constant values were used to estimate AET as well as the timing and magnitude of HER. These root constants were chosen as representative of the range provided in the literature (125, 150, 175, 200 and 225 mm). HER was estimated using Penman-Monteith PET only, without a root constant (termed 0 mm) as a control.
Model description
To estimate AET, PET was reduced after a particular SMD was reached, according to the root constant chosen. The extent to which SMDs developed beyond a specific root constant determined by how much PET was subsequently reduced (Table 1). For example, for a root constant of 125 mm, PET was reduced by 45% for SMDs between 125 to 150 mm; 55% for SMDs between 150 to 175 mm, and 60% for SMDs exceeding 175 mm (Table 1). These magnitudes of PET reduction were chosen as ratios of modelled AET to calculated PET on the Chalk can fall to 0.4 during dry summers (Hough et al., 1995; Finch, 2000). The particular SMD at which these PET reductions were introduced varied according to root constant threshold (Table 1). Consequently, the amount of AET permitted under rising SMDs was determined by the choice of root constant. Using a range of root constant thresholds produced different estimates of HER. The most realistic HER estimate therefore indicates an optimal root constant.
Daily SMD and HER were estimated according to the following procedure:
For the ith day:
SMDi = SMDi-1 – Pi + AETi SMDi-1 > Pi – AETi (1) SMDn = 0 SMDi-1 < Pi – AETi
HERi = Pi – AETi – SMDi SMDi < Pi – AETi (2) HERn = 0 SMDi > Pi – AETi
where P is observed daily rainfall. To provide preliminary estimates, HER and SMD were first calculated using Penman-Monteith PET. AET was then estimated according to root constant threshold using the preliminary SMD estimates. More realistic estimates of HER and SMD were then re-calculated accordingly using the estimates of AET. This procedure is valid only when the initial calculation of HER and SMD begins at a date when it is reasonable to
assume that SMD is zero; for the UK this is generally in the winter .
Model calibration
The calibration of recharge models has often focussed on how well observed SMDs are reproduced (see for example, Ragab et al., 1997). Such calibration techniques are required because the direct measurement of recharge is difficult. The model presented here was calibrated by determining which root constant threshold produced values of HER that best explained daily mean flow on a Chalk river in southern England (River Wey). One advantage of simulating flow rather than point field measurements such as SMDs is that riverflow data from one site provides information on the dominant processes in the entire catchment.
In this paper, riverflow was simulated using three contrasting hydrological models, each with different transfer functions. The first, CAPTAIN (see Appendix) utilises powerful recursive estimation techniques for time series
modelling. The second, IHACRES is a unit hydrograph-based, rainfall-streamflow model. The final model is INCA. INCA’s hydrological model is semi-distributed and is a mass balance approach to simulate both soil and groundwater flow contributions.
OBSERVED DAILY DATA
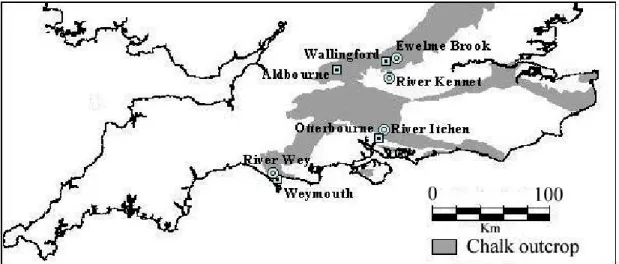
The model was calibrated using daily mean flow data on the River Wey, a spring fed system draining the Chalk of south Dorset (Fig. 1). The river has a Base Flow Index (BFI) of 0.94 and a topographical catchment area of 7 km2 (Institute of Hydrology, 1998). On the basis of the mean daily riverflow, the contributing groundwater catchment is estimated at around 25 km2. Land use in the catchment is mainly pastoral with around 30% arable (Ministry of Agriculture, Fisheries and Food, 1991; University of Reading, 2000; Institute of Hydrology, 1998). Urban area provides only a small proportion of the estimated groundwater catchment (Land Cover Map of Great Britain, 1990). The river is, therefore, considered a groundwater-dominated system where surface runoff is minimal. Daily mean flows on the River Wey at Broadwey from 1975 to 1999 were obtained from the Centre for Ecology and Hydrology, Wallingford, UK.
Daily meteorological observations at Weymouth from 1975 to 1999 provided rainfall data and estimates of PET. Penman-Monteith PET was calculated using PET software (Hess, 1998). The meteorological data from Weymouth was considered representative of the catchment of the River Wey (Fig. 1). Daily rainfall was increased by 15% to account for bypass flow (Ragab et al., 1997). Six independent estimates of daily HER at Weymouth from 1975 to 1999 were calculated according to the model and root constant
Fig. 1. Site location
Table 1. Calculation of AET by reducing PET according to
various root constant thresholds.
PET reduction 45% 55% 60% Root constant SMD (mm) SMD (mm) SMD (mm) 125 mm 125 to 150 150 to 175 >175 150 mm 150 to 175 175 to 200 >200 175 mm 175 to 200 200 to 225 >225 200 mm 200 to 225 225 to 250 >250 225 mm 225 to 250 250 to 275 >275
thresholds. The start of all six model runs was 01 January 1975, where it was assumed that SMD would have been zero.
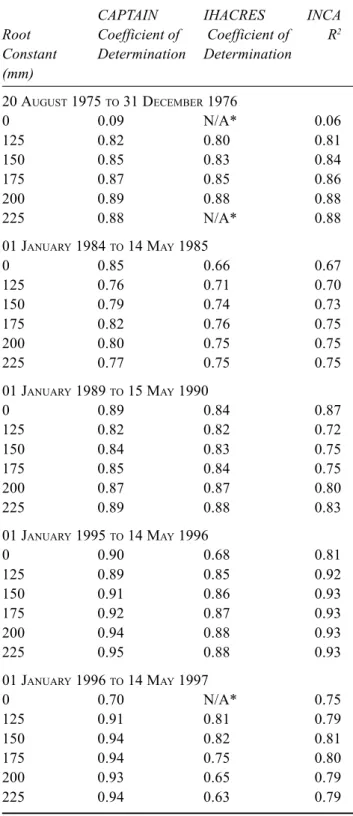
The six different estimates of maximum annual total HER produced ranged from 462 mm (root constant 0mm; 1977) to 498 mm (root constant 125 mm; 1976). Minimum annual total HER ranged from 65 mm (root constant 0 mm; 1976) to 257 mm (root constant 125 mm; 1991). The widest range in annual total HER estimates were produced during dry years when SMDs would have been greater: 1975–6, 1984–5, 1989–90, 1995–6 and 1996–7. These periods were therefore used for model calibration. A statistical measure of the quality of each riverflow simulation was available for all three models via the Coefficient of Determination (CD) or R2. These indices were used to determine which HER estimate gave the most realistic riverflow simulations during the above periods.
Model calibration: results
The most realistic riverflow simulations were obtained when relatively high root constants were used (Table 2). Typically, HER calculated using root constant thresholds at 175 mm, 200 mm and 225 mm produced the most realistic simulations. HER estimated using lower root constants generally explained less of the observed riverflow variance. On average, HER calculated using a root constant of 200 mm proved optimal. Generally, the CAPTAIN model produced more realistic simulations than either IHACRES or INCA. Whether improved riverflow simulations would be achieved with HER estimated using established models required testing. Monthly mean flow on the River Wey was simulated using CAPTAIN over the period 1975 to 1999. Monthly total HER from MORECS v.2 for south Dorset (Square 180), and for Weymouth calculated using the method of Burt and Shahgadenova (1998) provided input. Monthly totals at Weymouth estimated using the six root constants were also used. Again HER estimated using relatively high root constant thresholds provided the most realistic riverflow simulations (CD 0.8 and 0.81 for root constants at 200 mm and 225 mm respectively). Monthly total HER calculated using root constants at 200 mm and 225 mm not only performed better than HER estimated using lower root constants but also proved more realistic than HER estimated using MORECS v.2 and the method of Burt and Shahgadenova (1998) (CD 0.79 and 0.72 respectively).
The amount of annual recharge determines average annual flow on the River Wey. Estimates of water-year (October– September) HER totals from models such as MORECS v.2 and Burt and Shahgadenova (1998) can be useful for water resource planning. Simple correlation (r) and regression (r2)
Table 2. Model calibration results. * Model failed to calibrate
successfully.
CAPTAIN IHACRES INCA Root Coefficient of Coefficient of R2
Constant Determination Determination (mm) 20 AUGUST 1975 TO 31 DECEMBER 1976 0 0.09 N/A* 0.06 125 0.82 0.80 0.81 150 0.85 0.83 0.84 175 0.87 0.85 0.86 200 0.89 0.88 0.88 225 0.88 N/A* 0.88 01 JANUARY 1984 TO 14 MAY 1985 0 0.85 0.66 0.67 125 0.76 0.71 0.70 150 0.79 0.74 0.73 175 0.82 0.76 0.75 200 0.80 0.75 0.75 225 0.77 0.75 0.75 01 JANUARY 1989 TO 15 MAY 1990 0 0.89 0.84 0.87 125 0.82 0.82 0.72 150 0.84 0.83 0.75 175 0.85 0.84 0.75 200 0.87 0.87 0.80 225 0.89 0.88 0.83 01 JANUARY 1995 TO 14 MAY 1996 0 0.90 0.68 0.81 125 0.89 0.85 0.92 150 0.91 0.86 0.93 175 0.92 0.87 0.93 200 0.94 0.88 0.93 225 0.95 0.88 0.93 01 JANUARY 1996 TO 14 MAY 1997 0 0.70 N/A* 0.75 125 0.91 0.81 0.79 150 0.94 0.82 0.81 175 0.94 0.75 0.80 200 0.93 0.65 0.79 225 0.94 0.63 0.79
tests confirm that modelled water-year HER at Weymouth estimated using a root constant of 200mm best describes the variation in average water-year flows on the River Wey. Over the period 1975 to 1991 (n = 17), the following test results for the different HER estimates were obtained: Burt
and Shahgadenova (1998) (r = 0.63, r2 = 0.35); MORECS v.2 (r = 0.82, r2 = 0.61) and using a root constant of 200 mm (r = 0.85, r2 = 0.71).
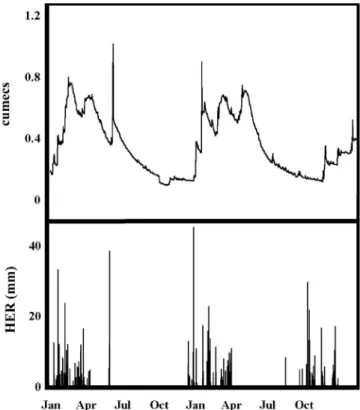
Using HER estimated with a root constant of 200mm, the CAPTAIN model captures overall variability well and
simulates recharge events synchronous with upturns in daily flow on the River Wey (Fig. 2). Some upturns in flow, however, are not explained by the data (Fig. 2). Such events occur during the summer recession as a result of brief surface runoff from urban areas near the gauging station following intense rainfall. These surface runoff events do not appear to provide significant recharge to the Chalk aquifer of the River Wey (Fig. 2) and therefore are not explained by the model.
COMPARISON WITH PREVIOUS WORK
Studies that have used detailed field measurements to estimate recharge provide a sound basis with which to compare the calibrated model. This has been achieved by using the data of Ragab et al. (1997), who assessed the ability of various models to predict observed daily SMDs at a number of locations, including a Chalk site in Hampshire (Bridets Farm) and a sandstone site in Devon (Bicton College). The various models produced a wide range in annual groundwater recharge totals. Despite this, the estimates of annual groundwater recharge from the various models are in broad agreement with HER calculated here
Fig. 2. Model calibration: CAPTAIN simulation of daily mean flow
on the River Wey at Broadwey with HER estimated using a root constant of 200mm as input 01 March 1977 to 20 August 1979. R2 =
0.93.
Table 3. Modelled annual groundwater recharge for grass adapted from Ragab et al. (1997)a with annual total HER estimated for Weymouth (using a root constant of 200 mm) and for MORECS v.2 Square 180 (south Dorset). All units in millimetres.
Bridgets Farm
1976 1977 1978 1979 1980
Penman-Grindley 416 473 380 430 292
MORECS v.2b 507 465 413 531 422
MORECSc PET with FRLM 289 397 343 437 257
FRLM 372 483 406 497 333 ZFP Methodd 296 469 362 270 245 Root Constant 200 mm 418 462 342 402 448 Bicton College 1988 1989 1990 1991 1992 Penman-Grindley 187 207 195 57 118 MORECS v.2b 330 386 324 270 N/A
MORECSc PET with FRLM 315 395 281 279 279
FRLM 314 384 268 225 261
ZFP Methode 333 308 390 277 187
Root Constant 200 mm 270 350 249 246 238
aOnly results from model runs excluding bypass flow included for comparison in this study bMORECS v.2 data for Square 180: South Dorset
cMORECS v.2 data for Bridgets Farm and Bicton College respectively. dZero-Flux Plane Method (Wellings, 1984); n.b. winter drainage. eZero-Flux Plane Method (Duffy and Grainger, 1993).
using a root constant of 200 mm (Table 3). Considerably more variation in estimates of annual groundwater recharge is seen in dry years such as 1976 and 1990. This is partly because the models place different constraints on transpiration during long, dry summers.
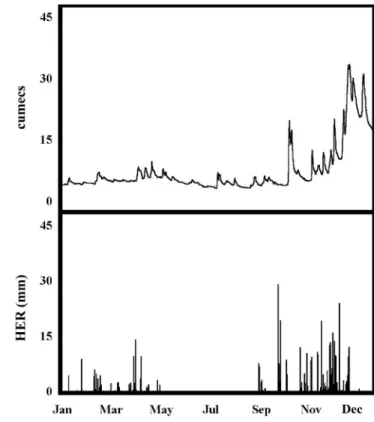
During 1976 to 1980 and 1988 to 1992, all of the models tested by Ragab et al. (1997) underestimated autumn SMDs; consequently they predicted soil saturation too early. Using a root constant of 200 mm, the model presented here describes a close relationship between the elimination of SMDs and the occurrence of recharge. During these years, the predicted elimination of SMDs — and subsequent onset of HER — closely matched observed recharge to the aquifer of the River Wey, as is apparent from salient upturns in flow (Figs. 3a–c). A delay between the predicted occurrence of autumn HER and an upturn in riverflow is especially notable during the dry years between 1989 and 1991 (Fig. 3c) due to the thicker unsaturated zone as a result of the depressed groundwater levels in this aquifer. Conversely, a much tighter relationship between predicted HER and increased riverflow is suggested by the model during the relatively
Fig. 3a. Model calibration: daily HER estimated using a root
constant of 200mm and daily mean riverflow on the River Wey at Broadwey 01 January 1976 to 31 May 1977.
Fig. 3b. Model calibration: daily HER estimated using a root
constant of 200mm and daily mean riverflow on the River Wey at Broadwey 01 January 1979 to 31 December 1980.
Fig. 3c. Model calibration: daily HER estimated using a root
constant of 200mm and daily mean riverflow on the River Wey at Broadwey 22 January 1989 to 25 April 1991.
wet years 1979 to 1980, where groundwater levels were evidently much higher (Fig. 3b).
SIMULATION OF DAILY SMDS
Simple soil models have been criticised in their ability to predict observed SMDs during extremely dry periods (Ragab et al., 1997). Measured SMDs on the Hampshire Chalk exceeded 200 mm during the dry summer of 1976 (Wellings, 1984). Comparable estimates from the model presented here using a root constant of 200 mm suggest that SMDs on the Chalk of south Dorset exceeded 200 mm in August 1976, and also during 1984, 1989, 1990 and 1995. Consequently, the model suggests that AET equated to PET on the Chalk of south Dorset for most years between 1975 and 1999 except 1975, 1976, 1984, 1989, 1990 and 1995; i.e. about 25% of the time.
Model validation
Calibration of the model presented here suggests that a root constant of 200 mm is optimal for the River Wey. The Chalk aquifer of south Dorset is, however, very fissured and responsive (Arkell, 1947; Limbrick et al., 2002). The River Wey has substantially different hydrological characteristics to rivers on other, less responsive areas of the Chalk across southern England (Institute of Hydrology, 1998). Thus, whether the relatively high root constant threshold of 200 mm is also optimal for use on other areas of the southern Chalk needs to be tested.
This has been achieved by applying the model to estimate recharge to the aquifers of three additional Chalk streams/ rivers across southern England. Meteorological and daily mean flow data were obtained for the Ewelme Brook, River Itchen and the River Kennet (Fig. 1). Six estimates of HER were calculated for the rivers using the root constant thresholds (Table 1). Daily mean flows were simulated using the CAPTAIN model with the different HER estimates for each river as input. Again, the greatest differences in annual total HER were apparent during dry years due to the contrasting effects of the different root constant thresholds. Therefore, results for a selection of dry years only are presented here.
THE EWELME BROOK AT EWELME
The Ewelme Brook flows from the Chilterns through a mostly agricultural catchment area of 13.4 km2 into the Thames Valley and has a BFI of 0.98 (Fig. 1) (Institute of Hydrology, 1998). Daily mean flows at Ewelme were obtained along with meteorological observations from the Centre for Ecology and Hydrology, Wallingford, UK (Fig.
1). The daily rainfall was increased by 15% to account for bypass flow (Ragab et al., 1997). PET was calculated using PET software (Hess, 1998). Daily HER at Wallingford estimated using the six root constants was used as input to the CAPTAIN model to simulate flows at Ewelme.
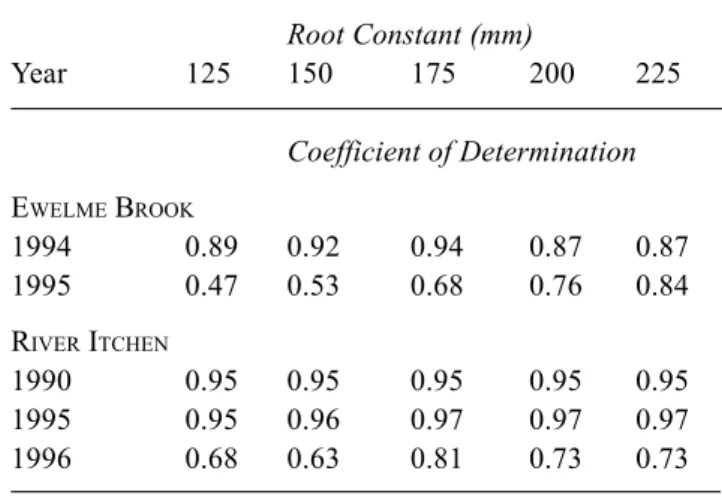
During 1994 and 1995, the most realistic simulations of daily mean flow at Ewelme were achieved with HER calculated using higher root constant values (Table 4). The
Table 4. Model validation: CAPTAIN simulation of daily
mean flow on the Ewelme Brook and River Itchen using various estimates of daily HER as input.
Root Constant (mm) Year 125 150 175 200 225 Coefficient of Determination EWELME BROOK 1994 0.89 0.92 0.94 0.87 0.87 1995 0.47 0.53 0.68 0.76 0.84 RIVER ITCHEN 1990 0.95 0.95 0.95 0.95 0.95 1995 0.95 0.96 0.97 0.97 0.97 1996 0.68 0.63 0.81 0.73 0.73
Fig. 4a. Model validation: daily HER estimated using a root
constant of 175mm and daily mean riverflow on the Ewelme Brook 01 January to 31 December 1994.
most realistic simulation of flow on the Ewelme Brook during 1994 was achieved with HER estimated using a root constant of 175mm (Table 4 and Fig. 4a). Similarly, a root constant of 225 mm proved optimal during the dry year of 1995. These results suggest that a compromise root constant threshold of 200 mm is applicable for the Ewelme Brook.
THE RIVER ITCHEN AT EASTON
The River Itchen at Easton drains a largely rural catchment of 236.8 km2 (Fig. 1) (Institute of Hydrology, 1998) The Chalk outcrop of southern Hampshire feeds the River Itchen and the stream has a BFI of 0.98 (Institute of Hydrology, 1998). Daily mean riverflows for the Itchen at Easton were obtained along with rainfall data from Otterbourne, Hampshire, UK (Fig. 1). The daily rainfall was increased by 15% to account for bypass flow (Ragab et al., 1997). The PET estimates for Weymouth and rainfall from Otterbourne were used to calculate the estimates of HER using the six root constant thresholds. The different HER estimates were then used as input into the CAPTAIN model to simulate daily mean flow on the River Itchen.
Little variation in annual HER totals for 1990 resulted in identical riverflow simulations for this year (Table 4). During
Fig. 4b. Model validation: daily HER estimated using a root
constant of 200mm and daily mean riverflow on the River Itchen 01 January to 31 December 1995.
the dry years of 1995 and 1996, however, the estimates of annual totals varied considerably and HER calculated using root constants at 175 mm, 200 mm and 225 mm proved optimal (Table 4 and Fig. 4b). The limitations of using Weymouth PET for the River Itchen aside, the optimal root constant threshold for this region of the southern Chalk appears to be between 175–200 mm.
THE RIVER KENNET AT THEALE
The River Kennet at Theale drains a largely arable area of 1033.4 km2 in the Thames Valley and has a BFI of 0.87 (Institute of Hydrology, 1998) (Fig. 1). Daily mean flows were obtained along with MORECS v.2 data for the River Kennet upstream at Aldbourne (Fig. 1). Using the daily MORECS v.2 PET and rainfall data, HER for Aldbourne was estimated by the model with a root constant of 200 mm. Along with the MORECS v.2 HER, these estimates for Aldbourne were used as input to the CAPTAIN model to simulate daily mean flow on the River Kennet at Theale.
Seven of the ten calendar-year simulations between 1986 and 1995 were more realistic with HER estimated with a root constant of 200 mm. The differences between the two models were most apparent during dry years such as 1995
Fig. 4c. Model validation: daily HER estimated using a root
constant of 200mm and daily mean riverflow on the River Kennet 01 January to 31 December 1992.
(Table 5). Although calculated for Aldbourne, the modelled HER explains flow variability at Theale remarkably well (Fig. 4c).
Conclusions
A simple model for estimating daily recharge (as HER) to the Chalk aquifer of southern England is presented. The model requires only daily meteorological observations. Model calibration and validation suggested that a root constant of 200 mm is optimal for use across the Chalk outcrop of southern England. Using this root constant, the timing and magnitude of the estimated daily HER coincided closely with upturns in observed riverflow and associated aquifer recharge events. The predicted replenishment of autumn SMDs was also synchronous with the occurrence of recharge.
This root constant implies that, even at relatively high SMDs, vegetation on the Chalk outcrop can draw readily upon stored water. Consequently, the model suggests that AET on the outcrop is approximately equal to PET for all but extremely dry years such as 1975, 1976, 1989, 1990 and 1995.
The model presented here is particularly useful for studies where the application of more complex techniques is impractical, and in hydrological modelling studies that require daily HER as input.
Acknowledgements
The author wishes to thank the following without whose assistance this study would not have been possible: staff at the National River Flow Archive, Centre for Ecology and Hydrology, Wallingford, UK, especially Terry Marsh, Jon Finch and Ragab Ragab for guidance and Felicity Sanderson for data provision; Paul Whitehead, Maria Shahgadenova and staff at the Department of Geography, University of
Table 5. Model validation: CAPTAIN simulation of daily
mean flow on the River Kennet with daily HER estimated using MORECS v.2 and a root constant of 200 mm as input.
MORECS v.2 Root Constant 200 mm (Coefficient of (Coefficient of Determination) Determination) 1990 0.92 0.93 1991 0.57 0.62 1992 0.80 0.83 1995 0.79 0.89
Reading; Bob Poots for providing the meteorological data for Weymouth; the British Atmospheric Data Centre; Ian Littlewood; Tim Hess and Cranfield University.
References
Arkell, W. J., 1947. The geology of the country around Weymouth, Swanage, Corfe, and Lulworth. Memoirs of the Geological
Survey of Great Britain. H.M.S.O. London. 386pp.
Arnell, N.W. and Reynard, N.S., 2000. Climate Change and UK Hydrology. In: The Hydrology of the UK – A Study of Change M. Acreman (Ed.). Routledge, 3–29.
Burt, T.P. and Trudgill, S.T., 1993. Nitrate in groundwater. In:
Nitrate: Processes, Patterns and Management T.P. Burt, A.L.
Heathwaite and S.T. Trudgill (Eds.). Wiley, Chichester, UK. 444pp.
Burt, T.P. and Shahgedanova, M., 1998. An historical record of evaporation losses since 1815 calculated using long-term observations from the Radcliffe Meteorological Station, Oxford, England. J. Hydrol., 205,101–111.
Downing, R. A., 1998. Groundwater – our hidden asset. British Geological Survey, Keyworth, Nottingham, UK.
Duffy, D. and Grainger, P., 1993. Monitoring of soil water
movement in the unsaturated zone at Bicton 1992. University
of Exeter, Earth Resources Centre, report to NRW South West Region, 12pp.
Finch, J.W., 2000. Modelling the soil moisture deficits developed under grass and deciduous woodland: the implications for water resources. J.CIWEM, 14, 371–376.
Finch, J.W., Ragab, R. and Harding, R.J., 1997. A simple method for estimating mean annual groundwater recharge for drift-free areas of the Chalk and Permo-Triassic Sandstone aquifers in the UK. J.CIWEM, 11, 357–362.
Gooddy, D.C., Hughes, A.G., Williams, A.T., Armstrong, A.C., Nicholson, R.J. and Williams, J.R., 2001. Field and modelling studies to assess the risk to UK groundwater from earth-based stores for livestock manure. Soil Use Manage., 17,128–137. Greenfield, B.J., 1984. The Thames catchment model. Technology
and Development Division, Thames Water Internal Report. Headworth, H.G., 1970. The selection of root constants for the
calculation of actual evaporation and infiltration for Chalk catchments. J. Inst. Water. Engrs. Sci., 24, 431–446.
Hess, T. M., 1998. Reference Evapotranspiration Program. Silsoe College, Cranfield University, 23pp.
Hough, M., Palmer, S., Weir, A., Lee, M. and Barrie, L., 1995.
The Meteorological Office Rainfall and Evaporation Calculation System: MORECS Version 2.0. An update to Hydrological Memorandum 45. Meteorological Office, Bracknell, UK.38pp.
Howarth, S.M., Whitehead, P.G., and Mumford, C.P., 1996.
Hydrological variability in the Upper Kennet catchment: patterns in rainfall, runoff, and streamflow. Report to Thames
Water Utilities Ltd. No. T/TW/2, 35pp.
Institute of Hydrology, 1998. Hydrological data UK: Hydrometric
Register and Statistics 1991–95. Centre for Ecology and
Hydrology, Wallingford, Oxon. OX10 8BB, UK. 207pp. Jakeman, A.J. and Hornberger, G.M., 1993. How much complexity
is warranted in a rainfall-runoff model? Water. Resour. Res.,
29, 2637–2649.
Jakeman, A.J., Littlewood, I.G. and Whitehead, P.G., 1990. Computation of the instantaneous unit hydrograph and identifiable component flows with application to two small upland catchments. J. Hydrol., 117, 275–300.
Appendix
CAPTAINCAPTAIN (Computer Aided Programme for Time-series
Analysis and Identification of Noisy Systems) utilises
powerful recursive estimation techniques for, amongst other applications, the modelling of stationary and non-stationary time series (Young and Benner, 1991). The model was initially designed for the recursive anaylisis and forecasting of univariate series and the modelling of bivariate time-series for hydrological and system control applications (Young and Benner, 1991). The model simply requires observed input and output data files and uses recursive estimation techniques to generate a model that describes the relationship between the two data sets. The techniques used within the CAPTAIN package have been applied extensively to hydrological systems (Whitehead, 1979) and to the reconstruction of historical riverflows (Howarth et
al., 1996).
Jakeman, A.J., Chen, T.H., Post, D.A., Hornberger, G.M., Littlewood, I.G. and Whitehead, P.G., 1993. Assessing uncertainties in hydrological response to climate change at large scale. In: Macroscale modelling of the Hydrosphere, W.B. Wilkinson (Ed.) IAHS Publication no. 214, 37–47.
Kitching, R. and Shearer, T.R., 1982. Construction and operation of a large undisturbed lysimeter to measure recharge to the Chalk aquifer, England. J. Hydrol., 58, 267–277.
Land Cover Map of Great Britain, 1990. Centre for Ecology and
Hydrology, Wallingford, UK.
Lawrence, A.R., Geol, C., Stuart, M.E., Barker, J.A. and Tester, D.J., 1996. Contamination of chalk groundwater by chlorinated solvents: Case study of deep penetration by non-aqueous phase liquids. J. CIWEM, 10, 263–272.
Lerner, D.N., Issar, A.S. and Simmers, I., 1990. Groundwater
recharge: a guide to understanding and estimating natural recharge. Vol. 8. Heinz Heise, Hannover, Germany, 111–147.
Limbrick, K.J., Whitehead, P.G., Butterfield, D., and Reynard, N., 2000. Assessing the potential impacts of various climate change scenarios on the hydrological regime of the River Kennet at Theale, Berkshire, south-central England, UK: an application and evaluation of the new semi-distributed model, INCA. Sci.
Total Envir., 251/252, 539–555.
Limbrick, K.J., Willows, J. and Marsh, T.J., 2002. Springflow variability since 1858 in south Dorset, UK. Weather (in press). Littlewood, I.G., 1994. Modelling catchment-scale water balance dynamics using long time series of rainfall, streamflow and air temperature. In: The Balance of Water – Present and Future, T. Keane and E. Daly (Eds.). Proc. Conf. AGMET Group (Ireland) and Agricultural Group of the Royal Meteorological Society (UK), Trinity College, Dublin, 7–9 September, 1994. Littlewood, I.G. and Jakeman, A.J., 1994. A new method of
rainfall-runoff modelling and its applications in catchment hydrology. In: Environmental Modelling (Vol. 2) P. Zannetti (Ed.). Computational Mechanics Publications, Southampton, UK, 143–171.
Littlewood, I.G. and Marsh, T.J., 1996. Re-assessment of the monthly naturalised flow record for the River Thames at Kingston since 1883, and the implications for the relative severity of historical droughts. Regul. Rivers., 12, 13–26. Ministry of Agriculture, Fisheries and Food, 1991. Land use
returns by parish in Dorset, 1991.
Penman, H.L., 1950. The water balance of the Stour catchment area. J. Inst. Water. Engrs. Sci., 4, 457–469.
Ragab, R., Finch, J. and Harding, R., 1997. Estimation of groundwater recharge to chalk and sandstone aquifers using simple soil models. J. Hydrol., 190, 19–41.
University of Reading, Dept. Geog. 2000. Land use returns by
parish in Dorset, 1931.
Wellings, S.R., 1984. Recharge of the upper Chalk aquifer at a site in Hampshire, England. 1. Water balance and unsaturated flow. J. Hydrol., 69, 259–273.
Wellings, S.R. and Bell, J.P., 1980. Movement of water and nitrate in the unsaturated zone of the Upper Chalk near Winchester, Hants., England. J. Hydrol., 48, 119–136.
Whitehead, P.G., 1979. Application of recursive estimation techniques to time variable hydrological systems. J. Hydrol.,
40, 1–16.
Whitehead, P.G., Wilson, E.J. and Butterfield, D., 1998a. A semi-distributed Integrated Nitrogen model for multiple source assessment in CAtchments (INCA): Part 1: model structure and process equations. Sci. Total Envir., 210/211, 547–558. Whitehead, P.G., Wilson, E.J. and Butterfield, D., 1998b. A
semi-distributed Integrated Nitrogen model for multiple source assessment in CAtchments (INCA): Part 2: application to large river basins in south Wales and eastern England. Sci. Total Envir.,
210/211, 559–583.
Young, P. and Benner, S., 1991. microCAPTAIN 2. User Handbook. Centre for Research on Envrionmental Systems, Institute of Environmental and Biological Sciences, Lancaster University, UK.
IHACRES
IHACRES (Identification of unit Hydrographs And
Component flows from Rainfall, Evaporation and Streamflow data) is a catchment-scale rainfall-streamflow
model designed to characterise the dynamic relationship between basin rainfall and streamflow (Jakeman et al., 1990; Jakeman and Hornberger, 1993; Littlewood and Jakeman 1994). The model only requires rainfall and streamflow data for input, although temperature and PET can be used if available. Amongst other applications, IHACRES has potential for the identification of unit hydrographs, continuous time series streamflow modelling and studies of environmental change impacts. The model has been successfully applied in climate change impacts studies (Jakeman et al., 1993) and in the analysis of long hydrological records and quality assessment of hydrometric data (Littlewood, 1994; Littlewood and Marsh, 1996).
INCA
INCA (Integrated Nitrogen in CAtchments) was initially developed for the assessment of multiple sources of nitrogen in catchments. The model is process based and uses reaction kinetic equations to simulate the main processes operating (Whitehead et al., 1998a). The model can be applied to catchments as a semi-distributed simulation, and incorporates an in-built multi-reach structure for river systems (Whitehead et al., 1998a). The hydrological model allows the dynamics and characteristics of river basin sub-catchments to be incorporated into the whole model. The hydrological model has proved successful in the simulation of basin-scale hydrology (Whitehead et al., 1998b) and in the assessment of climate change impacts on hydrological systems (Limbrick et al., 2000). INCA requires daily mean air temperature, SMDs and HER as model inputs.