Driving the New York State Hop Industry to Meet Demand
byNathan D. Stempel
B.S. Human Resource Management, New School University, 2009 B.E.E. Electrical Engineering, Auburn University, 2009
Master of Engineering Management, Old Dominion University, 2015
SUBMITTED TO THE PROGRAM IN SUPPLY CHAIN MANAGEMENT IN PARTIAL FULFILLMENT OF THE REQUIREMENTS FOR THE DEGREE OF
MASTER OF ENGINEERING IN LOGISTICS AT THE MASSACHUSETTS INSTITUTE OF TECHNOLOGY
JUNE 2016
2016 Nathan D. Stempel. All rights reserved.
The author hereby grants MIT permission to reproduce and to distribute publicly paper and electronic copies of this thesis document in whole or in part in any medium now known or
hereafter created.
Signature of Author:
Certified by:
Accepted by:
Signature redacted
Master of Engineering in Logistics ProgramMay 6, 2016
Signature redacted
-j I /"- Dr. Alexis H. Bateman Research Associate, Center for Transportation & Logistics
Director, Responsible Supply Chain Lab 0 r Thesis Supervisor
Signature
redacted'
MASSACHUSETTS INSTITUTE OF TECHNOLOGYJUN 302016
LIBRARIES
/
V' 6' Dr. Yossi SheffiDirector of The Center of Transportation Logistics
Elisha Gray I Professor of Engineering Systems
Driving the New York State Hop Industry to Meet Demand
By
Nathan Stempel
Submitted to the Engineering Systems Division on May 6th, 2016 in Partial Fulfillment of the Requirements for the Degree of Master of Engineering in Logistics.
Abstract
The craft brewing industry in New York State has grown rapidly over the past five years helped in part by New York State legislation called the Farm Brewery Act of 2012. The act imposes agricultural stipulations for breweries desiring to file for a Farm Brewing license. The hop industry will have to grow in kind to meet the Farm Brewery Act requirements. The level of growth that needs to be achieved was determined through the use of system dynamics modeling. Production volumes were calculated based on survey results from brewers and farmers. Currently, the state's hop industry is producing a surplus of hops and will be able to supply short-term brewery growth over the horizon of the next three years. It was discovered, however, that the industry is vulnerable to demand shifts and prudent action should be taken to become resilient to changes in buyer regulations and preferences: increasing the economy of scale and building collaborative relationships through farm clustering will improve the longevity of New York's hop industry.
Thesis Supervisor: Alexis Bateman
Title: Research Associate, Center for Transportation & Logitics Director, MIT Responsible Supply Chain Lab
Disclaimer
This work has meant a great deal to me as I have a personal steak in the success of the hop industry of New York. After reading an article in October of 2014 about the Farm Brewery Act I decided to help out by starting a farm of my own and have a modest operation in upstate New York called Hill Top Hoperation, LLC. I have made it a point to remained unbiased and present all of the facts and figures from a neutral standpoint. The success of the brewing industry will not only mean potential business for my farm but as a beer enthusiast I am hoping to ensure great beer continues to come out of New York!
Acknowledgments
This work has personally meant a lot to me and it has been a pleasure to be able to study an industry I so enjoy. I want to thank my thesis advisor, Alexis Bateman. Without her encouragement and guidance, the paper would never have been written.
My close work with Rebecca Platel at the Carey Institute of Global Good for helping to
explain what the state industry needs, putting me in contact with all the right people and providing honest feedback for my ideas.
Sam Filler of the New York State Economic Development Board for inviting me to the New York Wine Beer Spirits and Cider Summit where I was able to hear from state
representatives and industry leaders about what they feel is important and to make crucial industry connections.
Ronan McGovern, a colleague at MIT whose discussions in the early stage of the thesis proved invaluable. To him I owe credit for the hop balance that is so central to the approach I took.
To all the farmers and brewers that are energizing the industry and providing such quality beers that are creating an excellent reputation for great beers in NY. I want to
specifically thank Chad Miges for the personal tour of his farm, The Bineyard. To Kevin Mullen at Rare Form Brewery for hosting my concerns and providing insight from the brewers
perspectives. And to all those that completed the surveys with such great comments and recommendations.
Thank you to my classmates who heard about my thesis and my progress non-stop as I always felt the need to express what I was learning.
And to my family that has always supported me, and my efforts wherever I have been. Your love and encouragement keeps me energized and passionate about finding ways to improve my surroundings.
Table
Of
Contents
List of Figures ... 6
List of Tables ... 7
Glossary of Term s and Acronym s ... 8
1. Introduction ... 9 2. Literature Review ... 14 3. M ethodology ... 34 4. Results ... 43 5. Discussion ... 67 6. Conclusion ... 90 7. References ... 94 8. Appendices ... 98
List of Figures
Figure 1.1 Simplified Brewery Supply Chain Figure 1.2 Typical Hop Farming Process Cycle Figure 2.1 Timeline of US. Brewery Resurgence Figure 2.2 Trends in Brewing Licenses Issued
Figure 2.3 New York State's 2014 Economic Impact from Craft Brewing Figure 2.4 S-Shaped Growth
Figure 2.5 Example System that Exhibits S-Shaped Growth Figure 3.1 Entities by Year of NYS DOS Database
Figure 4.1 Chronological Display of Cumulative Data Base Entries Per Year Figure 4.2 Entities Aggregated per County
Figure 4.3 Aggregation of All Breweries and Farm Breweries Figure 4.4 Hop Balance in Pounds of Hops Per County and State Figure 4.5 Balance With Maximum Average Brewing Volume Figure 4.6 Time Lag Comparison in Breweries
Figure 4.7 Histogram of Delay Times Between Filing and License Issuance Figure 4.8 Cumulative Distribution of Filings
Figure 4.9 Vensim Diffusion Simulation Model Figure 4.10 Vensim Filing Rate Simulation
Figure 4.11 Vensim Cumulative Entities Simulation Figure 5.1 NeHA's Map of Services for Hop Farmers Figure 5.2 Farm Brewery Supply Chain
List of Tables
Table 2.1 Comparison of All NYS Brewery Licenses Table 2.2 Comparison of Various Farm Brewery Laws Table 2.3 Top States by Brewery Per Capita
Table 3.1 Summary of Databases Table 4.1 Hop Balance Calculations Table 4.2 Parameters of Delay Time
Table 4.3 Summary of Approach to Calculate Short-term Growth Table 4.4 Estimated Saturation Breweries per Capita over 18 Years old
Table 4.5 Scenario Summary
Table 5.1 Initial Investment Expenses
Table 5.2 Comparison of Cost of Sourcing Hops Table 5.3 Percentage of Margin from NYS Hops Used
Glossary of Terms
bbls Barrels (a barrel is 31 gallons)
D Production Brewery
DOS Department of State
FD Farm Brewery
IPA Indian Pale Ale
MD Maryland
MI Microbrewery
MR Restaurant brewery or Brewpub
NeHA North East Hop Alliance
NJ New Jersey
NY New York
NYS New York State
PA Pennsylvania
PNW Pacific Northwest
SLA State Liquor Authority
1. Introduction
A national trend of consumers shifting away from big brand breweries and toward craft
beer has strained certain farming industries, as they try to meet changing demands. In 2015, craft brewers produced 24.5 million barrels, and saw a 13 percent rise in volume and a 16
percent increase in retail dollar value. Retail dollar value was estimated at $22.3 billion, representing a 21 percent market share. The goal of the Brewer's Association, a national
brewers organization, is to have 20% of the country's beer market by 2020 (Hieronymus, 2015). Craft beer demands more hops with a larger number of varieties than traditional beers.
A classic pilsner, for example, requires one pound of hops per barrel' and uses only one hop
variety (Daniels, 2000). With today's prevalent Indian Pale Ales (IPA), it is common to see five separate hops added at different points of the brewing process (Daniels, 2000); a typical recipe includes two pounds of hops per barrel and can be much more (Moore, 2011). The Indian Ladder Farms IPA brewed by C.H. Evans, for example, uses 4.25 pounds of hops per barrel (Ten Eyck and Gehring, 2015).
The shifting consumer demand patterns trickle down to hop farmers. The United States hop industry has seen new acres being planted and existing lands replanted to change the existing varietals (George, 2015). Saaz and Golding, hop varietals used for pilsners, have fallen out the top ten consumed varietals and have been replaced by the new proprietary varietals Simcoe and Citra, both used extensively in IPAs (Cantwell, 2015).
These dynamic beer industry shifts have caught the eye of New York State (NYS) legislators. NYS has taken multiple steps to ensure the craft-brewing trend is encouraged to
expand as rapidly as possible in the state. Passing the Farm Brewery Act of 2012 was the most significant change to aid in this growth. This law ties a specific segment of the NY craft brewing industry directly to state farming. With most of the hops consumed nationally being grown in the Pacific Northwest (PNW) and a very sparse hop supply instate, this legislation creates many
questions about its success and sustained impact.
Can government policy have an impact on the growth of an industry through economic and financial incentives? The null hypothesis is that the passing of the law did not have any impact on the growth of the craft brewing industry in NYS. It will be shown that there was already a rising trend in brewery growth in the state prior to this law but a surge in new breweries after the law is enacted.
Can direct incentive in the brewing industry cause growth in a complementary supply industry? The law directly incentivizes the breweries but has only a peripheral requirement to use NYS grown hops. The null hypothesis is that the law did not have any impact on the growth of the hop industry in NYS. It will be shown that the passing of this act has created a demand on NYS hop farmers that spurred a significant number of farmer entrants and growth in the industry.
Is the current trend in industry growth sustainable given the Farm Brewer Act's
requirement to source from within NYS? The null hypothesis is that growth in the hop industry will not be large enough to support the demand from the breweries required to source from
NYS farmers. Current state supplies are actually sufficient to sustain the next three years of
Answering these questions necessitates understanding the challenges inherent in craft brewery operations and farming necessary to meet the supply. A review of the simplified brewery supply chain and farming process follows.
Brewery Supply Chain
To contextualize this research, it is important to understand the basic ingredients and supply chain of a brewery. A beer has four main components: water, yeast, barley and hops (Daniels, 2000). While spices may be added for flavor or aroma, the majority of the variable cost of production is in the barley and hops.
Barley is steeped in a malting process to convert starches to sugars that will be
ultimately turned into alcohol by yeast (Peragine, 2011). Farmers grow barley and send it to a malt house for processing. The malted barley is then distributed to the breweries. Malted barley can be roasted to differing levels to achieve coloration and different flavor profiles. A dark stout, for example, uses roasted barley. Barley farmers may have their own malt house but often a separate company will focus directly on malting as a value added process (Newbold and Thayer, 2016). The barley production in NYS is also a great concern but is outside the scope of this research.
Hops for brewing normally come directly from the farmer. Hop processing is done in-house and distributed from the farms. A simplified supply chain can be seen in Figure 1.1.
A& V of A0 > I sees OF
Figure 1. 1 Simplified Brewery Supply Chain. Graphics from Noun Project, 2016 Hop Farming
Growing hops as a venture is a complicated endeavor. Understanding the harvest potential and production process is integral to understanding the actions NYS will need to take to support its hop farmers.
Hops are perennial plants that grow to be 18 feet tall. It takes at least three years to reach this height, and full hop yields, due to the development of an extensive root network. The bine2 will be trained to climb a cord that hangs from a trellis system. The plant reaches its
maximum height near summer solstice and begins to grow horizontally as it fills out with leaves and cones. The cones contain lupulin, a yellow pollen substance, which consists of alpha and beta acids as well as essential oils. The breakdown of the acids is what gives the beer its
bitterness and the essential oils add to the aroma of each brew. There are over 110 varietals of hops that impart different characteristics to a brew and can be used in many different ratios and combinations (Woodske, 2013). Cones are harvested once a year in late August to early September depending on the varietal. Harvested hops are normally dried in a kiln-type house called an oast and either sold as whole leaf or pelletized (Ten Eyck and Gehring, 2015). The Pelletized form is mandated by most breweries so the process is almost a necessity. A timeline of a typical hop farmer's year is shown in Figure 1.2.
October-March
April June August Store unsold
" String Cord 9 Pest Control hops
" Train Hop 9 Weed e Harvest - prepare for
Bines Control 9 Dry next season
May July September
* Pest Control * Pest Control 9 Dry
* Weed & Weed e Pellitize
Control Control * Packaging
* Distribution
Figure 1. 2 Typical Hop Farming Process Cycle
Integrating the knowledge of brewery supply chains with hop farming practices allows a better understanding of the requirements the NYS Farm Brewery Act imposes.
Recommendations based on current trends and future needs can be made to integrate the two industries (brewing and hop farming) and drive growth in the NYS hop industry to ensure it meets the demand of craft brewers.
2. Literature Review
To understand the dynamics behind the law's industry implications and understand the future ramifications, a thorough review of multiple areas is needed. This chapter analyses the literature in several key areas of background information and methodology approaches, including New York State's history with hops, the details of the Act, economic impacts, system dynamics, and utilizing cluster principles to further strengthen the hops and brewing industries.
2.1 NYS Hop History
A review of the history of the hop industry is important in determining the effectiveness
of the Farm Brewery Act. James Coolidge introduced cultivation of hops to New York State
(NYS) in 1808; by 1840, NYS was producing almost as much hops as all of New England. In 1880
"New York hit its peak, producing 21 million pounds of hops on about 40,000 acres, 80% of the hops in the nation" (Ten Eyck and Gehring, 2015, p. 22).
In 1920 the enactment of Prohibition devastated the value of the hop industry and, combined with a large Downy3 mildew outbreak in 1927, the NYS industry was destroyed. Early hop pioneers, who had already moved west to escape the humidity of the Northeast,
established more profitable hop yards in places like Yakima Valley, Washington. By the time Prohibition was repealed in 1933, the competitive advantage had shifted and NYS farmers would not return to the market due to the more difficult growing conditions.
The brewing industry was very slow to recover from Prohibition. In 1983, fifty years after its repeal, only six breweries controlled 92 percent of U.S. beer production (Ten Eyck and
Gehring, 2015). The craft brewery movement developed in the new millennium, as more and more smaller scale breweries opened to fill the niche markets for more flavorful beers that included very hoppy brews. A simplified US brewery industry growth timeline is shown in
Figure 2.1. Pre
Prohibition-Number of 1983- 6
Breweries 1934-756 Breweries 2015 US peaked at Breweries re- control 92% of Breweries pass
4131 open the Market 4000 again
1920 to 1933- 1961 through 2013 US craft
Prohibition consolidation Breweries
the number of reach 2768 breweries
srinks to 230
Figure 2. 1 Timeline of US. Brewery Resurgence. Adapted from Tenyk and Gehring, 2015 and Gatza, 2015.
Sensing an emerging potential for industry growth, in 2001 the Northeast Hop Alliance (NeHA) was organized with a mission to "explore the feasibility of re-establishing commercial specialty hops production in New York and the Northeast" (Northeast Hop Alliance, 2015). The Brewers Association stated that in 2013 the United States had 2,768 craft breweries, 450 of which were located in the Northeast (Ten Eyck and Gehring, 2015).
Despite the early efforts by NeHA, The stage was not yet set for the resurgence of NYS hops until later in the 2010's. Beginning around the same time, there was a national "locavore" movement, in which people sought to consume local products over mainstream brand names
(Ten Eyck and Gehring, 2015); this also occurred in NYS.
Information gathered at The Carey Institute of Global Good from the New York State Liquor Authority shows the issuance of all Beer Production Licenses over the last 15 years (New York State Liquor Authority, 2015) see Figure 2.2. NYS now has four brewery license categories:
Production Brewery (D), Farm Brewery (FD), Microbrewery (MI) and Restaurant Brewery (MR). The differences of these licenses are summarized in the NYS Liquor Authority's "Comparison of Brewery, Micro Brewery, Farm Brewery & Restaurant-Brewer Licenses" by T. Donahue (2014).
A summary of key differences is shown in Table 2.1.
Table 2. 1 Comparison of All NYS Brewery Licenses
License Type Annual License Production Ingredient Multiple
Fee Limit Restrictions Locations
Production $4000 None No No
Brewery (D)
Farm Brewery $320 75,000 Yes, per the Can have up to
(FD) Barrels/year Farm Brewery 5 branch offices
Act with a permit
for each
Microbrewery $320 75,000 No No
(M1) Barrels/year
Restaurant $950-$1950 20,000 No Up to 5
Brew-Brewery (MR) Barrels/year Pubs each
requiring a separate
license
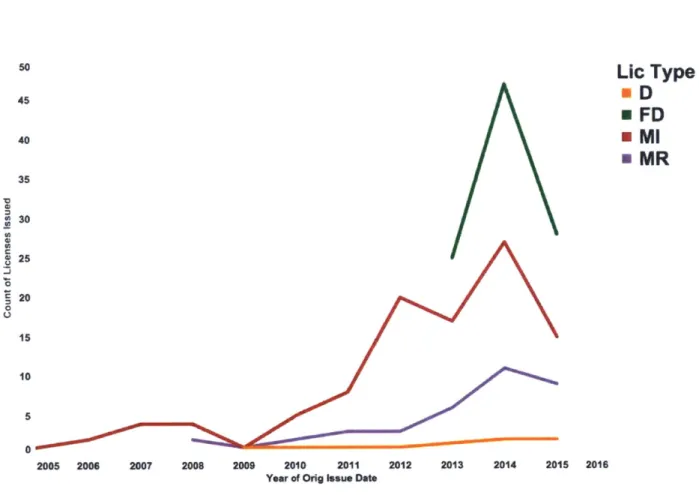
Figure 2.2 shows a surge of the Micro Brewery Licenses (MI) beginning in demand being placed on locally produced beers.
50
Lic Type
45 D * FD 40 E MI * MR 35 30 25 20 20 1015 10 2005 2006 2007 2008 2009 2010 2011 2012 2013 2014 2015 2016Year of Orig Issue Date
Figure 2. 2 Trends in Brewing Licenses Issued
With culture moving toward locally sourced goods and the resurgence of local brewing activity, the stage was set to add a stronger catalyst to the industry in the form of The Farm Brewery Act. The fervor of NYS to take advantage of rising local demand and growing craft beer production put the state government in a prime position to regain some of the market share it once dominated in the hop industry.
2.2 The Farm Brewery Act
The Farm Brewery Act was passed on June 15, 2012. It amended the Alcoholic Beverage Control Law, the Agricultural and Markets Law and the Tax Law in regard to a farm winery, farm distillery and a farm brewery (New York State, 2012). The law stipulates the ingredients that
Farm Breweries4 need to use to be considered a NYS labeled beer. These stipulations have a
tiered approach, which is designed to allow the agricultural industry to gradually expand to meet the growing demand while still providing economic incentives to brewers:
* Present until Dec 3 1 st 2018, no less than 20% by weight of its hops are grown in NYS and
no less than 20% by weight of all its other ingredients excluding water.
* From January 1st, 2019 until December 31st 2023. no less than 60% by weight hops
grown in NYS and no less than 60% of all other ingredients excluding water.
* From January 1 st 2024 and on, no less than 90% by weight of its hops grown in NYS and
no less than 90% of all other ingredients excluding water. (New York State, 2012).
These requirements placed a strain on the natural resources of the state, as hop farmers are already struggling to meet the demand from NYS brewers. If the growth in the brewing industry is outpacing the growth of the hop industry, this mismatch will only be exacerbated at each of the incremental ingredient requirement increases.
Many financial benefits to brewers have been driving the surge in breweries. The most significant advantage to being a Farm Brewery, as reported by brewers, is the ability to sell beer
by the glass (Newbold and Thayer, 2016). The Farm Brewery Act (2012) gives other economic
incentives, a licensed brewer producing NYS labeled beer may:
* Sell to Farm distilleries, Farm Breweries and Farm Wineries. * Conduct tasting on premise.
* Sell at retail for consumption off premise at the state fair, at recognized county fairs and at farmers markets operated on a not-for-profit basis.
* Sell and conduct tastings at retail for consumption on the premise of a restaurant, conference center, inn, bed and breakfast or hotel owned and operated by the licensee. * Apply for permits to conduct tastings away from the premise.
* If tasting permit for off premise is granted, apply for a permit to sell off premise.
e Operate up to five branches.
* Reduced filing costs for both initial and annual filing fees compared to other license categories.
The current success of the law is driven by the combined benefits but the long-term sustainability depends on the ability of the agricultural industry, hops and barley, to achieve a comparable growth to the Farm Brewing sector.
The NYS Farm Brewery Act did not introduce a unique concept: other states have created legislation to encourage the growth of in-state craft brewing. Some states that have developed laws based on the concept include New Jersey, Maryland, Massachusetts, Virginia and Vermont. A brief comparison of different approaches is valuable.
New Jersey (NJ) enacted its Farm Brewery Act in 2010. The law created a Farm Brewery License with lowered economic restrictions on filing fees but had a restriction of brewing only up to 2,000 barrels a year. This law is different from NY's as the Farm Brewers of NJ must be actively engaged in the farming of an ingredient that goes into their beer but there are no quotas associated with such ingredients by percent volume of use (New Jersey, 2010). This
approach does not spur a separate farming industry but allows more individuals to get into the brewing market, which they would have otherwise not been able to do.
Other laws have been passed in NJ to aid the competitiveness of craft breweries in general and are not specific to the state's Farm Brewery License. June 7, 2012 a law was adopted that increased the production volumes legal for small-scale breweries and reduced filing fees to help further promote the entire industry without tying requirements to the farming industry (New Jersey, 2012).
In 2012, Maryland (MD) took legislative steps to foster a farm brewery law. The state now allows farmers to produce up to 15,000 barrels a year as long as they are using ingredients that they are producing and the production is on the farm being issued the license (Maryland, 2012). This is similar to the NJ law, as it does not seek to create a separate local farming movement to supply the new class of breweries.
The Massachusetts (MA) General Laws, Chapter 138, Section 19C creates a provision for a farm brewery and was introduced as early as 2000 (Massachusetts, 2002). The law does not put a quota on the amount of ingredients that the farm brewery must use. The entity qualifies for the license as long as it is growing either hops or cereal grains for the production of its beers. It specifically allows for importation of ingredients without any mention to proportions (Massachusetts, 2016). In 2011, the state's Alcoholic Beverages Control Commission tried to impose a quota on each farmer engaged in brewing by requiring 50% of the ingredients to be grown on site. For example - The state refused a Farm Brewery license to Idle Hands Craft Ales based on this new provision. There was backlash from legislators and the brewing community
alter their business model (Furnari, 2011). The quota was quickly repealed and no requirements currently exist in the state (Hankins, 2015).
Senate Bill 157 of Virginia (VA), introduced January 13, 2016, focuses on providing a direct tax benefit to the individual involved in farming rather than stimulating the growth of the craft brewing industry. The law "provides an individual income tax subtraction [from the
federal adjusted gross income] for any income of a taxpayer engaged in the business of farming as defined under federal law attributable to the sale of barley, hops, or wheat grown by the taxpayer to a Virginia craft brewery" (Virginia, 2016). This bill provides direct incentives and
like NJ, MD and MA does not link the brewing industry directly with state farming.
Testament to NY's Farm Brewery act is Vermont's H.201 bill, a replication of the Farm Brewery Act. Vermont introduced the H.201 bill in 2015 to create a farm brewery license with similar economic incentives and agricultural requirements that the Farm Brewery Act of 2012 has. The act also has a tiered approach to the agricultural requirement and introduces a new class of license and a state labeled beer (Vermont, 2015). House Representative Botzow, lead architect of the law, reported that he "modeled the farm brewer's bill after a similar law in New York that took effect in 2013. The Bennington County Industrial Corporation suggested that New York had a competitive advantage in recruiting breweries (Burbank, 2016)." A comparison of each of these laws is presented in Table 2.2.
Table 2. 2 Comparison of Various Farm Brewery Laws
State Year Production Limit Agricultural Requirement (Barrels/year)
MA 2000 Various from Brewer actively grows some ingredients 5,000 to over
1,000,000
NJ 2010 2,000 Brewer actively grows some ingredients
MD 2012 15,000 Brewer actively grows some ingredients
NY 2012 75,000 Tiered Agricultural Requirements
VT 2015 Tiered Agricultural Requirements
VA 2016 N/A Direct tax break for selling to instate brewers
Unlike the laws before it, the approach taken by NYS ties the craft brewing industry to a new set of farmers by incentivizing a production license that induces demand for farmers. The continued popularity and impact of the law hinges on the agricultural supply base. If the resources become constrained or too expensive, then the breweries will have to change their business models or the state will have to adjust the law to accommodate the changing craft brewing economics.
2.3 Hop and Beer Economics
The craft brewing industry is one of the fastest growing alcoholic beverage markets, increasing an annualized 18.8% in total revenue from 2010 to 2015. It has reaching an
estimated $5 billion in annual revenue. The tremendous growth has been driven by consumers shifting to a large variety of products that have high quality and express high degrees of
The rise in craft breweries is creating a total economic impact larger than just beer sales. In 2013 the total impact from the craft brewery industry to New York State was estimated to be
$3.5B. This includes all indirect jobs and other activities such as tourist and souvenir sales
(Cuomo, 2015). Although this is an immediate boon to the state, many challenges need to be overcome to make this growth sustainable.
The demand from the breweries for NY grown hops is enormous. A farmer can sell his whole harvest before he has picked a single cone (Angel, 2014). Justin Riccobono, a NY hop farmer summarizes the majority of recent experiences of state hop farmers: "North River Hops
& Brewing, a new brewery in Wappinger's Falls, wanted to buy Riccobono's entire harvest, but
he had already agreed to supply six other New York breweries. 'We could have sold our harvest four times over,' he says" (Angel, 2014).
It is more expensive to grow hops in NY than in the Pacific Northwest (PNW), where most hops are produced. The higher cost comes from a more humid climate that increases the chance of mold infestation in addition to the fact that most NYS farmers have not reached large economies of scale. This is evident by the market prices of each: hops grown in NY go for
$12-18 per pound as compared to the $7-$13 in the PNW (Angel, 2014). This higher price point
means that an acre of hops (1,000lbs) can drive revenues of up to $20,000 a year (Angel, 2014). This highly profitable crop is a strong incentive for more farmers to start hop farms. Currently,
according to the Department of Agriculture, hops are one of the most lucrative crops and bring in more that other high yield crops such as corn and cotton that yield $700 an acre and hay, which yields $600 (Angel, 2014).
However, The elevated monetary incentive is not guaranteed over the long-term. As craft breweries scale up, the ingredient price becomes a major portion of the total operating expenses. This happens as the fixed costs of running a brewery stays the same and the variable expense of more and more ingredients becomes the dominant line on financial statements. At large volumes breweries are forced to outsource hops to remain competitive and keep prices low. If NY farmers cannot close the gap between the PNW prices they will begin to struggle to sell their hops as the brewing industry in New York becomes more mature.
Comparing the hop production volumes, it is common to find farms of over 100 acres in the PNW, while only a handful of farms in NY are at the 10 acre point (Angel, 2014). Farms are going to have to become larger to drive down NYS hop prices through economies of scale to create a sustainable relationship.
The craft brewing industry is expanding nationally which is feeding the drive to start more local breweries. Today, on average, there are two breweries opening per day with the national count passing 4,000 breweries (Watson, 2015b) with NY accounting for 141 of these (New York State Liquor Authority, 2015). In 2011, of the 206 million barrels of beer produced, 6% was from craft beer and that figure is estimated to grow to 15% by 2020 (Menashe, 2013). As the country falls back into an era where craft breweries5 are taking more of the beer market
segment ancillary economic benefits are seen. In locations where many breweries are close to each other, it is attracting tourism in the form of brew trails6 (Cuomo, 2015). In 2013 NYS craft
breweries attracted 3.66 million visitors. On June 2 5th, 2014 the state's Department of
s A craft brewery is defined as having an annual production of less than 6 million barrels, less than 25% ownership is from an alcohol producer that is not a craft brewer, and is not producing flavored malt
ii,
Agriculture and Markets officially recognized the first "cuisine trail" through Schoharie County to further drive tourism toward craft breweries (Governor, 2015).
The Brewer Association (2015b) compiled economic impacts of the craft brewing industry for 2014 (summary in Figure 2.3). Several insights can be drawn from these figures. While NYS has grown significantly, they are still well behind the average state in breweries per capita (100,000 people). They were 28th after the surge from 2010-2014, implying that before
2010 they would have ranked well below that number. Implying that NYS had a place for great expansion into the craft brewing industry.
NEW
YORK
2,921
201.88
S Million Economic Impact Impact per Capita
ECONOMICIMPW (A1KS NP
/
KS948,228
2
Barrels of Craft beer Gallons per 21+ Adult
produced per year (UNKS2MI
41!RANKS IMh1
NUMER OF REERES PER YEAR
1.3
Breweries per Capita*
200JRUNKS
2100-*pw100.A0W21+A wks so
2011 2012 2013 2014
Figure 2. 3 New York State's 2014 Economic Impact from Craft Brewing (Taken from The Brewer's Association, www.brewersassociation.org)
Furthermore, NYS must grow more to be among the top breweries per capita among competing states. Table 2.3 shows the number of breweries per capita of the top five states. If
NY's industry continues to grow, it has room for hundreds of more breweries. If these file as Farm Breweries or try to source from within NYS for their hops, it will place a greater demand on NYS farmers.
Table 2. 3 Top States by Brewery Per Capita (Derived from The Brewer's Association, www.brewersassociation.org)
Rank State Breweries Per Capita 100,000, 21+ Adults 1 Vermont 8.6 2 Oregon 7.4 3 Colorado 6.1 4 Montana 5.9 5 Wyoming 5.3
However, Meeting the demand is not going to be enough for NYS farmers. In a recent study conducted by the Brewers Association, 67% of craft beer drinkers used whether a beer was from a local brewery to make their purchase decision (Watson, 2015a). This reinforces the drive to support local economics but the same study revealed that an even more important factor in the purchase choice was flavor, as 97% of consumers have that as their main priority (Watson, 2015a). Local breweries will only survive if they meet the high quality standards that consumers expect. Based on survey results discussed later in this research many brewers are already wary of the NYS ingredient value. Quality issues in production of NY state hops may begin to play a role in a brewer's decision to remain a Farm Brewery and to source local if they cannot meet the flavor profile they want to produce.
2.4 System Dynamics
NYS through a system dynamics7 modeling approach. This approach also provides a depiction of the factors that influence the spread of the brewing industry across the state.
The growth of this industry follows an "S-Shaped" pattern as shown in Figure 2.4. This behavior is similar to the behavior of technology diffusion or the adoption of new ideas or the spread of a rumor (Sterman, 2000). The system behavior can be modeled using a system dynamic framework.
Corrying Capocity
State of
The System
Time
Figure 2. 4 S-Shaped Growth. Taken from Sterman, 2000.
This system structure and behavior occurs between two basic dynamics: a reinforcing feedback loop and a balancing feedback loop. The reinforcing loop will drive early behavior as the system encourages itself to grow. The balancing loop will create a diminishing return on
market entrances due to reaching a saturation of industry conditions and a strain on resources (Sterman, 2000).
A basic model showing the parts of a system, which exhibits this S-Curve shaped growth,
can be seen in Figure 2.5. The depiction of the model connects different aspects with arrows representing a causal relationship. The polarity of the arrow, whether it is positive or negative,
7 System dynamics is the interdisciplinary use of mathematical modeling techniques and feedback mechanisms to explain complex system behaviors (Sterman, 2000).
represents whether the connected factors move proportionally or in an inverse fashion. For the example in Figure 2.5 as the "State of the System" goes up the "Resource Adequacy" goes
down exhibiting a negative polarity. Each closed loop of effect is annotated with an R for reinforcing and B for balancing to aid in diagram clarity.
Ne 11ncreasc Rate State of the System R
Fractional NetP
Increas Rate Resource Adequacy
Carrying Capacaty
Figure 2. 5 Example System that Exhibits S-Shaped Growth. Taken from Sterman, 2000
The adoption of new technologies model that will be applied to the growth of the brewing industry is the Bass Diffusion Model. This model, originally developed to forecast the sale of new products, assumes a potential adopter makes the decision to purchase based on exposure to a series of external constants and internal market factors (Sterman, 2000). For the brewing industry, the filing of a brewery entity will be modeled analogously to a potential adopter actually making the decision to adopt a new technology. The mathematical representation can be shown in Equation 2.1
Where Adoption Rate (AR) is made up of two factors; a*P and b*P*A. a*P is the direct influence of factor (a), on the population of potential adopters (P) and b*P*A is the internal influence of the market from the interaction of the potential adopters (P) and the population that has already adopted the technology (A) (Sterman, 2000). Equation 2.1 relates to the
system dynamics as the reinforcing feedback occurs as more adopters enter the market and the balancing feedback loop exists, as the available potential adopters become adopters. The brewing industry analysis will consider someone that ha interest in opening a brewer as the potential adopter and someone who has actually filed as an entity with the state as an adopter.
The Bass Diffusion Model and the system dynamics evaluation approach show leverage points that the state has used to promote industry development. Expounded on in section 4.5, the methodology adds deep insight into additional actions that will benefit both industries.
2.5 Cluster Principals and Effects
To reach a point where the breweries and hop farmers can reach harmonious business equilibrium, a review of cluster dynamics8 of the industries is applied. Clusters of technology and innovation are increasingly common for disseminating ideas and services, creating new inventions and practices, and facilitating economies of scale. Two famous examples are the artistic revolutions around Florence Italy in the 1400's and the rise of technology companies in Silicon Valley over the past two decades (Sheffi, 2012). Applying lessons learned from these and other clusters the NY hop industry can create more efficient operations and reach a larger scale of quality hop production.
8 Cluster Dynamics are observed within a geographic area as substantial competitive advantages that are created when suppliers and competitors co-locate. This is driven by tacit knowledge exchange, development of a strong supply base and attracting top talent (David, 2013).
There are two types of clusters. Vertical clusters integrate trading partners and horizontal clusters, which are businesses that are at the same stage of production (Sheffi, 2012). Applying this perspective to the NYS hop and brewery industry, vertical clusters can be formed around the majority of craft breweries so that the farmers can supply the local
breweries and build and maintain relationships. Horizontal clusters can be formed on both the brewery side as well as the farmer's side. The density of craft breweries is already exhibiting some cluster dynamics as they attract more tourists to "brew trails" (Cuomo, 2015).
Clusters form because there is some benefit to operating in proximity to like
organizations. Each organization can influence the system by contributing knowledge, helping to develop specialized supplier relationships and developing a labor pool consisting of unique skills. As these factors interact between organizations, it can create positive feedback for each organization to make the clusters continue to grow. The cluster will increase productivity in companies of similar operation, speed innovative progress, and be a catalyst of new businesses
as competition increases (Sheffi, 2012). These dynamics, if effective in the hop and brewing industry, will cause a coalescence of efforts to focus on closing the gap between demand and production of the hops.
Participating in a cluster based economic environment yields many direct advantages. Building relationships develops trust between cluster inhabitants, which will yield experienced knowledge interchange, and a collaborative environment. Needing to innovate also leads to support for research and educational institutions (Sheffi, 2012). NY is starting to see many of these attributes of a cluster in its emerging beer industry.
Hartwick College recently opened a lab dedicated to testing and research of barley and hops. Many farmers are reaching out to The University of Vermont's Hop Program, Cornell Cooperative Extension is conducting training and extensive research into varietals that should be grown in the North East's climate. There is a collaborative environment with the recent publication of Ten Eyck and Gehring's book and coordination of equipment between farmers. The Carey Institute of Global good has a consistent educational program, and tacit knowledge exchange is occurring regularly with Cornell Newsletters by Steve Miller and through the NeHA.
All of these effects need to be amplified and utilized efficiently to increase farmer's
productivity.
Some of the barriers to entry into the hop farming industry and from scaling up to commercial scale include buying expensive equipment to harvest large amounts of hops, and having the means to process them. If farms were clustered, they could share the expense of these machines or resources when available. For example, Glacier Hops, in Montana, has planted 27 acres of hops and is coordinating four other farmers efforts to ensure planting is done near a centralized harvesting and processing facility (Hieronymus, 2015). Other resource sharing that could drive down the expense of farm operations includes buying bulk pesticides, insecticides and coconut cord (used for the hop bines to climb up) to get larger discounts. Thus making NYS farming cheaper and allow them to reach a hop price point closer to the PNW.
Clusters also enable a concentration of experienced labor (Sheffi, 2012). This can be important especially when starting out. For example, famers who have begun production can aid other farmers by inspecting designs and giving advice, helping to build the trellis system, and sharing cluster knowledge of local operations.
NYS government can also play a more direct role in cultivating the hop cluster dynamics.
Governments play critical roles such as controlling the use of the land, offering incentives, ensuring educational assistance and enforcing regulations (Sheffi, 2012). In Singapore, the government built a shared conveyor system for cement ingredient distribution. The companies all collocated silos for their own production around the use of the government supplied
conveyance and now manage a more efficient industry with more potential for economies of scale (Sheffi, 2012). NY can implement a similar infrastructure investment to allow for shared resources to improve the efficiency of the hop industry and to increase economies of scale. Alternatively, instead of a government-conducted program like Singapore, the allocation of grant money for this very specific purpose could create an opportunity for a farmer to step up and fill this role.
Another example of a government's efforts to help cluster economics is in Panama. Panama reduced the burden on corporations wanting to establish business operations in Panama by creating a one-stop location with information on permits and regulatory issues (Sheffi, 2012). A similar approach has been successful in NY with the breweries, as the Economic Development Board has created "Taste NY" to "provide information on permits, incentives, and ways to start your business, continue your business, and to flourish in New York" (Economic Development Board 2015). Avery successful marketing campaign has been spun off of the platform (Cuomo, 2015). As the hop industry gains more economic impact, there will be a significant opportunity for the state to invest in such programs to incentivize more potential farmers.
Governments also attract private investment by offering incentives such as subsidized land, temporary tax abatement, loan guarantees, and preferential regulatory treatment (Sheffi, 2012). Incentives can attract farmers since hops are a unique crop; there is no yield in the first year and only a partial yield in the second year in a hop plants life cycle, it is hard to turn the value around from investment within the first two years. There could be some innovation in financing here supported by the government; a potential two-year interest free loan or
deferred payment schedule to delay paybacks. It is hard to take out a loan to finance a project when the farmer will be making payments out of pocket with no hop sales for the first three years; a detailed analysis is conducted in section 5.3.
2.6 Summary
NYS has fostered a productive brewing environment. Taking advantage of the history to
catapult the industry back into prominence and providing support to brewers as they begin their journey has created a new agrarian boom within the sector. The attention has been
overwhelmingly focused on getting the breweries to succeed and more research and analysis needs to be done on how the same effort can be applied to the farmers.
To examine the issues highlighted in this review, my research focuses on the balance within the state of hops used and hops grown to see where the laws can be altered to create a
more sustainable relationship between the breweries, The Farm Brewery Act and the farmers. I will also focus on cluster analysis and applying collaborative technics to increase farming
efficiency and yield while driving down cost. I will also apply cluster theories to make
recommendations as to where funding should be focused and to where any further effort may be best spent in additional research and programing.
3. Methodology
To examine the complexity of the evolving NYS Farm Breweries and contingent hop supply, several different methods were employed to determine whether the legal requirements of the relationship are sustainable. Methods were selected based on their capability to predict brewery and hop growth while mapping trends to see the feasibility of the demand and supply relationship.
First, it was necessary to predict the growth in the number of Farm Breweries and compare it to that of hop farms. Then the current supplier and demand relationships were mapped to establish geographic relationships and determine clustering potential. Lastly, through the use of surveys, average production values were determined to create volumes of
supply and demand specifically to fulfill the need for the Farm Breweries. 3.1 Predicting Number of Breweries and Hop Yards
Several data sets were used to create a comprehensive list of all breweries and hop yards to be evaluated based on location, size, and type of brewing license. These databases are
summarized in Table 3.1. For the breweries, a systems dynamics approach was employed to
model the industry growth and project future entrance into the market because a regression of the data yielded inconsistent results. The hop yard growth is modeled based on growth trends
Table 3. 1 Summary of Databases
Data Base Source Key Aspects
New York State New York State Date and geography of licenses issued Brewery Licenses Liquor Authority via
Issued third party email
New York State NYS Department of Date and geography for when a person Filing Entities State via website files an entity stating intentions to
become a brewery
Hop Yard Plantings North East Hop Date of field planting, number of hops in in New York State Alliance via website a field and the geography
3.1.1 Predicting Number of Breweries
Several databases were utilized to extract the information necessary to trend the growth in the NY brewing industry. These were gathered from the State Liquor Authority and the NYS Department of State Business filings.
Liquor Authority Data:
To get better insight into how the brewing industry will grow, it is critical to find quantitative models that predict how much more growth NYS will see over the next 10 years. In order for a brewery to be in operation, it needs to have one of four brewing licenses,
discussed in section 2.1, issued from the State Liquor Authority. The number of active licenses for breweries was obtained through the Carey Institute of Global Good from the State Liquor Authority (SLA). Data was scrubbed9 to ensure valid entries and imported into Tableau for analysis and visualization.
9 Scrubbing included spelling corrections on county names, eliminating partial data points, and matching
Critical features of the data included the type of licenses issued, date issue and the county location. Each critical feature will show the growth in the four separate classes of breweries, trends in licenses issued over time and the proximity to other breweries.
Department of State Filing Data:
Licenses issued by NYS provide value by showing the trend in industry growth; by including the NYS DOS filing data; the predictive power of the overall data set is enhanced.
Every entity in the NYS DOS filing database that had either "brewing" or "brewery" in its name was recorded. These entities were used to calculate the average time from filing to receive a license and accounting for recent filings that suggest a brewery will soon be getting its license. The recorded entities took approximately 30 hours over two months to accumulate by hand. The latest filing data recorded was conducted on 11/13/2015.
The results were recorded in alphabetical order; it was assumed that no other entities were filed once a particular letter was passed. This practice assumes a complete data set even though some businesses may have been started between the start of data recording and completion on 11/13/2015.
Entity search was conducted within the NYS DOS "Corporation and Business Entity Database" using two keywords contained in the name of the filing: "Brewery" and "Brewing." The first search returned 157 entities and the second search returned an additional 429
entities.10 This does not cover all the possible breweries in NYS but taking the percentage increase as a rate indicates a representative change in the overall trend of filings.
Joining Data:
After both complete sets of data were cleaned, the sets were joined by using the names of each brewery. This gave the filing date and the date when the original brewery license was issued by the State Liquor Authority.
There are 289 separate licenses that have been issued in NYS. However, 28 Breweries have more than one license, one of which has three separate licenses. This brings the number of entities that have brewing licenses to 260. The distinction between individual breweries vice licenses is necessary because the method of forecasting number of breweries is dependent on the time from initial DOS filing time and time at which their license was granted. For breweries with multiple licenses, the license they received first was used for this calculation. The number of complete entity filing date and license issue date data pairs was 133.
In addition, there were active entities in the NYS DOS database that are very old. Some of these entities did not have listings in the SLA database. One example is The Brewery, INC that was filed in 1993. Getting the address from the NYS DOS database, it was verified they did not hold a brewing license as they only served as a restaurant. Looking into all the older entities that do not have a license led to filtering out the combination of older filed companies that do not have a license.
10 The data was scrubbed to ensure accuracy. One case had coffee brewery in the name and was identified as not being a beer brewery after further examination. Other entries were brewing supply stores, brewery investment groups and brewing consultants. The assumption was made that all breweries and brewing companies are considered to be brewing beer unless other information directs otherwise.
Of the 260 listings in the SLA data, 99 did not have brewing or brewery in their name. It
was not practical or possible to do a search for all entities that have other key words that indicate a brewery, so a factor was derived to get an upper bound on the number of possible breweries opening. The percentage of licenses issued and the entities that do not have brewing or brewery in their name was 38%. When predictive numbers are generated from the DOS database, the number of potential breweries will be adjusted to add another 38% of possible entries.
Taking the time difference in days between when the breweries were filed in the DOS database and when they were issued their original license allows an average time to filing and standard deviation to be calculated. To do this, the filings compared with the license issued resulted in 130 records that paired for evaluation. Three had negative wait times. These were assumed to be typos; another possibility is that a license was attributed to a brewery that changed its name and would not reflect credible data. There were also some licenses that have original issue dates very long after the DOS filing dates. Viewing these as outliers, from a data entry error standpoint, any data pair that took more than 6 years to get its license was filtered out. After these filters were applied, 108 data pairs were left to evaluate.
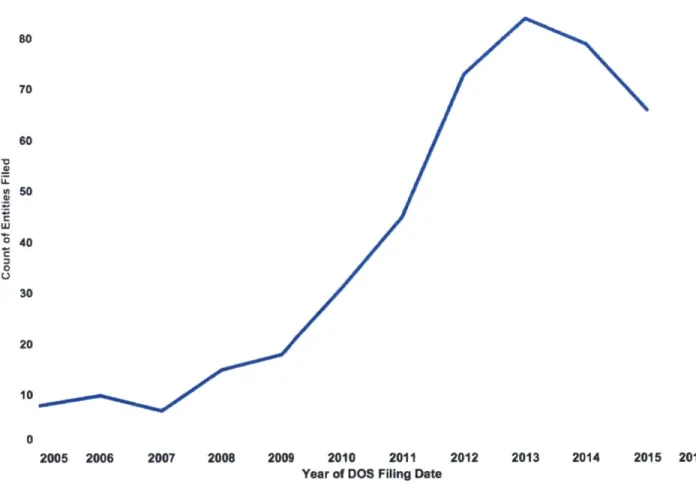
The data shows a peak in the number of filings and brewery licenses issued in 2013; this can be seen in Figure 3.1.
80 70 60 LA. w 50 o40 20 30 0 10 0 2005 2006 2007 2008 2009 2010 2011 2012 2013 2014 2015 2016
Year of DOS Filing Date
Figure 3. 1 Entities by Year of NYS DOS Filing Database
In reviewing the shape of the entities filing graph, the number of new entrants follow a pattern similar to adoption of a new technology (Sterman, 2000). As discussed in section 2.4, adoption behavior can be modeled using system dynamics. The model will provide the total population of breweries at market saturation by deriving interactions that behave like the above data set. Using the model as a system representation, the future growth of the filed entities is predicted. The future filed entities will directly translate into future breweries. Taking the fraction of recent filed breweries that are Farm Breweries and applying the average length of time from filing to licensed brewery, one can calculate the delay in the market and the timing of the increased demand from new brewers.
3.1.2 Predicting Number of Hop Yards Required
NYS' ability to meet the demand from the Farm Brewery Act relies on the numbers of
hop yards. All active hop yards on the North East Hop Alliance (NeHA) website were recorded for location, time of first planting, and name. Importing the data into Tableau to visualize and analyze drives many insights as discussed in sections 4 and 5.
A major problem with the information gathered from this source is that the entrance of
new farmers is not necessarily communicated to the North East Hop Alliance when they are formed since there is no requirement to participate in the organization. Leaving some of the incipient hop farms out of the data set implies that NYS is capable of meeting more of the demand than capacity estimates using NeHA information shows. Lack of complete data leads to large errors inherent in any approach. For this reason, the current data will be used as a base line against which all tiers of the Farm Brewery Act will be measured. Deviation from this baseline hop yield shows the minimum state capacity increase needed to ensure sustainable levels of the law's agricultural restrictions for hops.
3.2 Mapping Brewery and Hop Data
To determine how the relationships between breweries and hop farmers evolve, it is necessary to record where they are forming. Entities filed are mapped and compared with current licensed breweries. Graphics showing horizontal cluster areas consisting of a high density of like entities are created. Of interest is breweries forming next to other breweries and hop farms forming next to other hop farms. For vertical clusters, the brewery entities are compared to hop yard locations assess vertical clusters between the hop yards and the
County was chosen for the location and derived from all three datasets. County level aggregation provides sufficient granularity, allowing for analysis on a regional level and
provides an overall picture of both industries in the state. Counties are also a basic regulatory unit that can make decisions on industry support for the geographic locations.
3.3 Determining Supply and Demand Volumes
Farm Brewery and hop yard numbers are critical in determining whether NYS can meet the requirements of the Farm Brewery Act, but they do not connect the quantity of entities with actual consumption and production. To fill this gap, a survey was sent to both the
breweries and the hop yards in NYS. The surveys can be seen in Appendix A and Appendix B respectively.
Each survey consisted of a brief questionnaire to determine the average usage of ingredients and collect feedback on what factors impact decisions to scale up and make
different sourcing decisions. With average volume numbers, both the current and planned hop balances were created for each county.
The New York Brewers Association's private distribution email list was used to send the survey to all breweries. 24 breweries responded: 11 of those were Farm Breweries. This gives a representation of 11% of all farm breweries in the state.
Contact information from NeHA's database was used to email hop farmers. There were
113 farmers, 97 of whom had email addresses. 3 emails were returned as undeliverable. This
gave a distribution of 95 participants with responses from 34 farmers: representing 30% of the farmers registered with NEHA, 31 were from NY.
The data gathered gives insights into the concerns of brewers and farmers and how the industry is currently growing. The hop balance for each county was calculated using Equation
3.1 by applying survey data to the number of breweries and farms gathered as described in
section 3.1.
Eq 3.1 Hop Balance = Pounds of Hops Produced - Pounds of Hops Consumed
Equation 3.1 represents the surplus or deficit in consumption for the county based only on the demand of NYS grown hops by Farm Breweries. Mapping the hop balance per county shows the strengths and weaknesses of the industry within NYS. A deficit can represent Farm Breweries in a county not getting supplies. A surplus can also be a problem if distribution is limited to that county and the local market becomes saturated.
4. Results
Discussion of the results yields answers to the central thesis questions:
* Can government policy have an impact on the growth of an industry through economic and financial incentives?
* Can direct incentive in the brewing industry cause growth in a complementary supply industry?
* Is the current trend in industry growth sustainable given the Farm Brewer Act's requirement to source from within NYS?
Determining whether the development of the Farm Brewing sector is occurring at a pace that will exceed the supply growth hops, will answer the above questions through several means; trends of the breweries and hop yards are used to draw conclusions on how the
industries are growing; different entities are mapped to evaluate geographic densities; hop balance of each county in NYS is calculated and predicted into several future scenarios.
4.1 Trending the Growth in Farm Breweries Compared to the Hop Supply
Data from all three databases -- SLA licenses issued, NYS DOS filings, and hop yards planted -- is displayed to show chronological trending of each sector. The three data bases aligned in time are shown in Figure 4.1.
40 a' LU -j 20 0 0 0 --- - -2005 2006 2007 2008 2009 2010 2011 2012 2013 2014 2015 2016
Year of Orig Issue Date
80 cr60 ul40 0 -o2 0 2005 2006 2007 2008 2009 2010 2011 2012 2013 2014 2015 2016
Year of DOS Filing Date
30 CL 20 10 0 2005 2006 2007 2008 2009 2010 2011 2012 2013 2014 2015 2016
Year of Date First Field Planted
Figure 4. 1 Chronological Display of Cumulative Data Base Entries Per Year
Figure 4.1 shows the cumulative number of entries aggregated to the annual level. The
"Count of Licenses Issued" curves show the number of active brewery licenses issued from the
SLA sorted by the first year of issue. The four license types correspond to D: Production
Brewery, FD: Farm Brewery, MI: Microbrewery, and MR: Restaurant Brewery. Each class is
given different benefits and limitations as described in section 2.
The "Count of Entities Filed" curve shows the aggregated business entities filed with NYS
and when he or she actually gets a license as an operating brewery. Delays play a significant role in predicting the number of breweries, as will be explained later in this section.
The "Count of Hop Yards" curve shows each new field planted in NYS by year that it was first planted. Number of hops in each field varies widely from 10-10,000 but the number of
new hop fields planted per year gives a good indication of the activity and spread of the farming trade regardless of the size of the farms. Actual production estimates based on the size of the
farms are described later.
Figure 4.1 shows a sharp decline in number of new farms in 2015 due to several factors. First, the data received may be incomplete; there are farmers currently in production that are not registered with NeHA, so they would not have shown up on this database. Second, based on farmer interviews, it seems the widespread use of NeHA is also declining. For the purpose of creating a conservative estimate of whether the state is on track for meeting Farm Brewery demand, the minimum reported hop farms can still be used to get a baseline and show how much growth will be required. A more detailed tracking of this agricultural sector will be valuable for future analysis.
As shown in Figure 4.1, the parallel growth in the brewing and hops industries is striking. The Farm Brewery Act was passed in 2012 and enacted in 2013; the parallel growth in Entities Filed, Licenses Issued, and Hops Planted began well before the law was passed. In 2013 the Farm Brewer licenses created a number of new breweries and made up a significant portion of total licenses issued.
Rising brewery license issuance may not be fully attributed to the passage of The Farm Brewery Act. Farm Breweries may have cannibalized the licenses that would have gone to