HAL Id: halshs-00467545
https://halshs.archives-ouvertes.fr/halshs-00467545
Submitted on 26 Mar 2010
HAL is a multi-disciplinary open access archive for the deposit and dissemination of sci-entific research documents, whether they are pub-lished or not. The documents may come from teaching and research institutions in France or abroad, or from public or private research centers.
L’archive ouverte pluridisciplinaire HAL, est destinée au dépôt et à la diffusion de documents scientifiques de niveau recherche, publiés ou non, émanant des établissements d’enseignement et de recherche français ou étrangers, des laboratoires publics ou privés.
Detection of landslides from aerial and satellite images
with a semi-automatic method. Application to the
Barcelonnette basin (Alpes-de-Hautes-Provence, France)
Monique Moine, Anne Puissant, Jean-Philippe Malet
To cite this version:
Monique Moine, Anne Puissant, Jean-Philippe Malet. Detection of landslides from aerial and satellite images with a semi-automatic method. Application to the Barcelonnette basin (Alpes-de-Hautes-Provence, France). Landslide processes - from geomorphologic mapping to dynamic modelling, Feb 2009, Strasbourg, France. pp.63-68. �halshs-00467545�
1 INTRODUCTION
Landslides are a major problem in mountainous regions (Alexander 2008). From earth observation data, landslides study can be summarized in three application domains: (1) mapping (inventory), (2) characterization and (3) spatial and temporal moni-toring (Metternicht et al. 2005). These applications require fine (1:5000 to 1:10,000) and up-to-date spa-tial information which can be integrated easily in a GIS platform.
Until now, visual photo-interpretation techniques combined to ground survey remains the most used method to locate and characterize landslides (MATE & LCPC 1999; Mantovani et al. 1996). It allows identifying precursor signs, characteristic forms and predisposition factors for landslides at 1:10,000. It is also used to locate and map past events, declared movements and instable zones (MATE & LCPC 1999). But this traditional technique is complex to apply to large area and is time-consuming. More-over, it requires an expert knowledge on the hazard and remains very subjective (Mc Kean & Roering 2004).
In the optical domain, High Spatial Resolution images (HR - 30 to 5 m) with classical per-pixel me-thods are not used in detection and characterization landslides studies due to the inadequacy of the
spa-tial resolution. Indeed, the pixel size (30 m) doesn’t allow to detect objects of the size of a landslide (30 m on average). Moreover, per-pixel classification methods don’t fit for landslide detection because the spectral response of a landslide isn’t unique and can correspond to the aggregation of pixels with differ-ent spectral properties. The difficulty is also that landslides have often the same landuse as their direct environment and have consequently the same spec-tral response.
The new generation of Very High Spatial Resolu-tion images (VHSR – 4 to 1 m) offers new possibili-ties with its finer spatial resolution. It can be ex-ploited to provide detailed information on landslides. But in order to benefit from VHSR im-ages and their inherent complementarities between spatial and spectral informations, new method con-sidering object-oriented image analysis instead of only spectral analysis (based on pixel values) have been developed (Geneletti et al. 2003; Harayama et al. 2004). These new methods could help avoiding the problem of the heterogeneous spectral response of landslides (cf. above).
In the object-oriented image analysis, the first step is the segmentation of the image into 'regions'. It consists in grouping together pixels with similar properties by taking into account spectral informa-tion, but also texture, shape and size of object primi-tives. The influence the described parameters have
Detection of landslides from aerial and satellite images with a
semi-automatic method. Application to the Barcelonnette basin
(Alpes-de-Haute-Provence, France)
M. Moine
Image, Ville, Environnement Laboratory, UMR 7011 CNRS-ULP and Researcher Institut de Physique du Globe, UMR 7516 CNRS-ULP Strasbourg, France
A. Puissant
Image, Ville, Environnement Laboratory, UMR 7011 CNRS-ULP, Strasbourg, France
J.-P. Malet
Researcher Institut de Physique du Globe, UMR 7516 CNRS-ULP, Strasbourg, France
ABSTRACT: Until now, visual photo-interpretation techniques combined to ground survey remains the most used method to locate and characterize landslides. New perspectives in using remote sensing for landslides location are now offered by the availability of new very high spatial resolution images and by the develop-ment of object-oriented image analysis. In this context, the aim of this paper is to propose a semi-automatic method to locate landslides based on very high spatial resolution (aerial and satellite) images and by using expert knowledge on landslides. This approach is based on (1) a calibration step which consists to translate qualitative indicators derived from expert knowledge (by a photo-interpretation technique) in quantitative in-dicators and (2) a validation step which allows testing the relevance of these inin-dicators to detect landslides by using an object-oriented method and by only using (aerial or satellite) images with different spatial, spectral and temporal resolutions. Results are (1) a formal and generic grid characterizing landslides and (2) the iden-tification of relevant criteria to extract landslides.
on the segmentation is flexible and can be specified by the user through the manipulation of different pa-rameters based on color and shape (compactness and smoothness) factors (Flanders et al. 2003). Different layers of the data can also be weighted as to their importance in segmentation operations (Tansey et al. 2008). The second step is the classification proc-ess of these regions based on examples (by a nearest neighbourhood algorithm) or on membership func-tions allowing users to develop an expert knowledge base (based on fuzzy logic) and to assign regions to certain classes. This fuzzy classification approach allows detecting classes that may contain member-ship ambiguities (Flanders et al. 2003).
Since recently, some studies used this new method to detect geomorphological units like alluvial mate-rials, sedimentary deposits, alluvial fans, fluvial ter-races, rock cliffs (Van Asselen & Seijmonsbergen 2006), potential sites of landslides or landslides (Molenaar 2005). In the segmentation process, sev-eral images, i.e. optical images (e.g. ASTER image - Argialas & Tzotsos 2006 - ortho photos - Molenaar 2005) or radar/lidar images (Van Asselen & Sei-jmonsbergen 2006) are combined with vector or car-tographic data in order to extract indicators (slope, elevation, distance to a river, roughness, presence of surface drainage, presence of cracks) about the ’re-gions’. These indicators are directly extracted from regions and are used to set up rule-based classifica-tions.
In this context, the objective of this paper is to propose a semi-automatic method to locate land-slides based on very high spatial resolution (aerial and satellite) images and by using an object-oriented image analysis method. The originality of the pro-posed approach is there is (1) a calibration step which consists to translate qualitative indicators de-rived from expert knowledge (by a photo-interpretation technique) in quantitative indicators and (2) a validation step which allows testing the relevance of these indicators to detect landslides with an object-oriented method and by only using optical images of different spatial, spectral and tem-poral resolutions.
The study area and the data source are firstly in-troduced. Then the methodology is explained and, finally, preliminary results are presented and dis-cussed, before conclusions and perspectives.
2 STUDY AREA AND DATA SOURCE
The study area is situated in the Barcelonnette basin (South French Alps). This basin extends over 200 km² and is drained from East to West by the Ubaye river. Various factors including lithology, tectonics, climate and the evolving landuse have
given rise to numerous slope movements of different kinds. The north-facing slope appears as the most sensitive slope of the basin: 10% of its surface is af-fected by landslides of different types, mainly trans-lational and rotational superficial slides (78.8%; Thiery 2007).
The calibration site is based on 156 active landslides of different types (i.e. translational slides, rotational slides, earthflows and rock-block slides) and of different sizes (i.e. from 1000 to 20000 m²) located on the north-facing slope. A test zone of 25 km² containing 73 landslides is used for the valida-tion and the evaluavalida-tion steps.
Two types of data source are used: aerial and sat-ellite images and vector data. Three ortho photos (1974 –infrared colour and 2000, 2004 – natural colour) of the basin (spatial resolution of 50 cm) are used to calibrate the method. The both ortho photos and a panchromatic SPOT 5 image (2.5 m spatial resolution) are tested to validate the proposed method. The vector data is a mapping of the ‘expert’ inventory of all landslides of the north-facing slope from 2007 (Thiery 2007). It is related to a database containing morphometric characteristics of the in-ventoried landslides.
3 METHODOLOGY
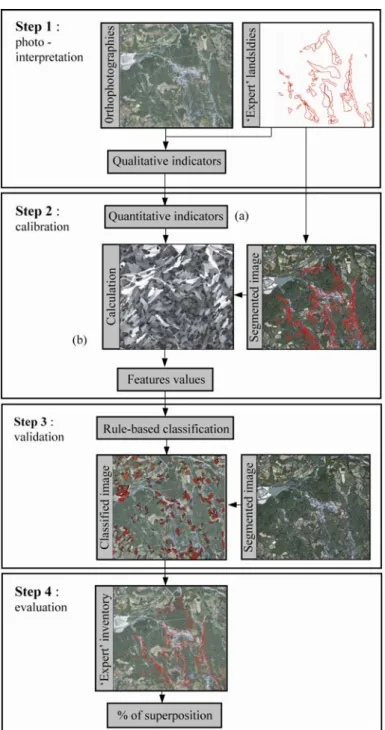
The proposed method is organized in four steps (fig. 1): (1) a photo-interpretation step where qua-litative landslides indicators are defined based on bibliographic researches and on a visual photo-interpretation technique, (2) a calibration step based on the identification of quantitative indicators and their calculation by using the huge toolbox available in the object-oriented image analysis software (De-finiens Professionnal1), (3) a validation step apply-ing rule-based classifications guided by the indica-tors calculated in step 2 (features), and (4) an evaluation step based on the expert mapping of landslides.
4 RESULTS AND DISCUSSION
Step 1 - Relevant indicators mentioned in the lite-rature allowing to detect the presence of landslides are identified e.g. landuse, vegetation density, tex-ture, presence of cracks, surface disturbance or scarp visibility (tab. 1). They are observed for the 156 landslides on the three ortho photos. It enables to propose a formal and replicable grid for detecting
1 Formerly known as eCognition, developed by Definiens
and describing landslides in four categories (corres-ponding to landslides’ landuse types).
Figure 1. Schematic representation of the methodology.
Step 2 - The more recent ortho photo (2004) is chosen to calibrate the indicators. The image is firstly segmented into homogeneous regions by tak-ing into account the outlined landslides. The scale, color and shape parameters are adjusted in order to be adapted to define ‘regions’ of the size and of the shape of the landslides indicated on the ‘expert’ map (tab. 2).
Table 2. Segmentation parameters.
__________________________________________________ Scale Color Shape Smoothness Compactness 160 0.1 0.9 0.9 0.1 __________________________________________________
Four main indicators are chosen, i.e. spectral, shape, texture and neighborhood characteristics
in-dicators, to translate qualitative criteria. A corres-pondence between these quantitative indicators and features proposed by the toolbox of the eCognition software is found (tab. 1). Main shape features are chosen to characterize the morphometric indicators (the compactness index is described by the shape in-dex, compactness and roundness features). Landuse and vegetation density description is given by the color of the observed object. Therefore, the main spectral features of the eCogntion software are re-tained to characterize these two indicators. The tex-ture of a landslide is related to the presence of cracks and/or ridges and to the surface disturbance. So, four main texture features are chosen to characterize these indicators. Finally, the main neighbourhood feature (mean difference to neighbour) is retained to represent the scarp and accumulation visibility be-cause it shows the degree of contrast between an ob-ject (the scarp or the accumulation zone) and its con-tiguous objects (the environment around the scarp or around the accumulation zone).
These features are then calculated for 50 repre-sentative ‘regions’ corresponding to 50 ‘expert’ landslides selected among the 156 observed landslides. Following a statistical analysis, relevant intervals of values are defined for each criterion. A knowledge base is then developed in an attempt to separate landslides from other landscape units.
Step 3 – A test zone on the 2004 ortho photo is used to validate the method. The same segmentation parameters as those used for the calibration step (step 2) are applied (tab. 1). The first classification hierarchy is based on spectral criteria and differen-ciates four types of landcover classes i.e. bare soil-black marl, grassland, bare soil-grassland-forest mixed and forest. For each class, a second classifica-tion hierarchy is developped by separating 'landslide area' from 'non-landslide area' according to their membership to other features (shape, texture and neighborhood).
The significance of these three features is tested by several combinations (tab. 3) giving seven know-ledge base introduced in the fuzzy classification ap-proach.
Table 3. Test protocol.
__________________________________________________ Criteria: Spectral Shape Texture Neighborhood __________________________________________________ Test 1 yes yes no no
Test 2 yes no yes no Test 3 yes yes yes no Test 4 yes no no yes Test 5 yes no yes yes Test 6 yes yes no yes Test 7 yes yes yes yes
__________________________________________________
Table 4 presents features values and the member-ship functions used in the rule-based classifications.
Table 1. Qualitative indicators used in the photo-interpretation grids and their correspondence in terms of quantitative indicators and features in the Definiens Professionnal software.
_________________________________________________________________________ Qualitative Quantitative Definiens Professionnal indicators indicators features
_________________________________________________________________________ Area
Area Length/width ratio Length Shape Shape index Compactness index Compactness
Roundness _________________________________________________________________________ Brightness
Landuse Spectral Spectral layers means Vegetation density Pixel ratios
Maximum difference index _________________________________________________________________________ Texture GLCM* contrast
Cracks Texture GLCM entropy Ridges GLCM mean Disturbance of the surface GLCM correlation _________________________________________________________________________ Scarp visibility Neighbourhood Mean difference to neighbour Accumulation zone visibility
_________________________________________________________________________ Watercourse proximity Topology Distance to
Road proximity
_________________________________________________________________________ * Grey Level Co-occurrence Matrix
Table 4. Range of values used in the rule-based classifications. __________________________________________________ Type of Criteria Range of Membership criteria values function __________________________________________________ Spectral Brightness Different ranges of values
Layers means and membership functions Pixel ratios for each type of Max. difference landuse
__________________________________________________ Shape Area [1000-20000] Length/width [0.5 – 5] Shape index [0.5 – 5] Compactness [0.5 – 3] Roundness [0 – 2.5] __________________________________________________ Texture GLCM contrast [20 – 380] GLCM entropy [1 – 10] GLCM mean [40 – 180] GLCM correlation [0.8 – 1] __________________________________________________ Neighbo- Mean difference to
urhood neighbour – layer 1 [-60 – 70] Mean difference to
neighbour – layer 2 [-60 – 70] Mean difference to
neighbour – layer 3 [-60 – 70]
__________________________________________________
Step 4 – The evaluation step consists in compa-ring the number and the area of landslides extracted by the semi-automatic method to the ‘expert’ landslides. A first evaluation is made on the 2004 or-tho photo to define the most adapted features com-binations (tests) for landslide detection. The best re-sults are obtained by test 1 based on shape criteria (15% of the ‘expert’ landslides identified) and test 4 based on neighborhood criteria (26% of the expert landslides identified). A maximum of 8% and a mean of 3% are found for the other tests.
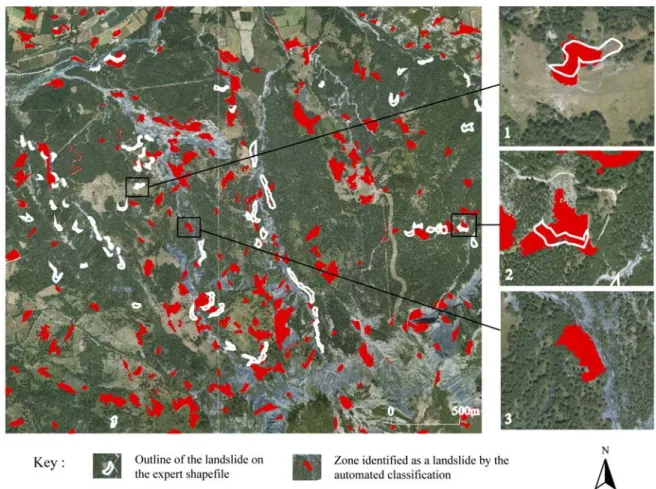
When the extracted landslides are overlaid to the ‘expert’ map, three cases are observed (fig. 2): (1) an underestimation of extracted surfaces, (2) an overestimation of extracted surfaces and (3) a crea-tion of surfaces which don’t correspond to any landslides.
For the landuse classification, classes with bare soil and black marls areas have a classification accu-racy of 3 to 7% versus 0 to 3% for the other classes.
For the landslide extraction, object-oriented clas-sifications largely overestimate the number of ‘ex-pert’ landslides. Whatever the test, no less than 96% of the ‘objects’ detected as landslides by the auto-matic classification do not correspond to ‘expert’ landslides. But when the landslides are extracted, most of them are underestimated in terms of area (tab. 5).
No specific pattern in the spatial distribution of the wrongly classified landslides was observed that can help to explain the errors.
Table 5. Results of the landslides detection on the 2004 ortho-photo.
__________________________________________________ Under- Over- Non Added estimated estimated identified landslides landslides landslides landslides
__________________________________________________ Test 1 10 1 62 407 Test 2 5 1 67 1153 Test 3 1 0 72 31 Test 4 18 1 54 2065 Test 5 2 0 71 1052 Test 6 2 1 70 67 Test 7 1 0 72 31 __________________________________________________
The second evaluation consists in applying the best combinations of features (test 1 and 4) on (a) an in-frared colour orthophotography (1974) and (b) on a VHRS image (2.5m Pan Spot), after finding a suit-able segmentation for the both images.
On the 1974 orthophotography, the number of landslides detected by the rule-based classifications is nearly the same as for the 2004 orthophotography with the test 4 . It is more overestimated with the test 1. This can be related to landuse changes between 1974 and 2004 or to the spectral differences between the natural colored photography and the infrared photography of 1974. On the panchromatic SPOT
im-age, landslide extraction appears as unsuitable de-spite of the adjustment of segmentation parameters. This is partly due to the too low spatial resolution of this image and to the too restrictive spectral resolu-tion.
These tests show that the segmentation of the data into 'regions' is of a great importance because if the initial segmentation does not respect the boundaries of the real-world objects of interest (landslides), the classification cannot provide meaningful results. Moreover, the spatial and spectral resolutions of the images have to be fine (around 1 m) to allow this ex-traction.
5 CONCLUSION AND PERSPECTIVES
This study has allowed to propose a formal and generic grid with qualitative indicators characteriz-ing landslides. The aim of this paper was to translate these indicators into quantitative criteria (features) and to integrate them in an object-oriented image classification. The proposed method is then a semi-automatic method based on expert knowledge. The analysis of a variety of parameters has allowed to define the best indicators (shape and neighbourhood) to be used to extract landslides from very high spa-tial resolution aerial images. Tests have also showed that the spatial and spectral resolutions are very relevant to detect this specific object.
To improve the proposed method, other quantita-tive criteria could be integrated as the topological re-lation to other objects (e.g. distance to a water-course). Other data (DTMs or lidar) could also be integrated in the object-oriented analysis to charac-terize the roughness of landslides.
Some tests are occurring in order to apply this method separating 'ablation' and 'accumulation' zones. The perspectives for the future are to apply the same method to the characterization of very large landslides (i.e. area > 100000m²) using a DTM lidar (e.g. automatic characterization of the ‘La Va-lette’ earthflow of the Barcelonnette basin).
AKNOWLEDGEMENTS
Thanks to Steven M. de Jong from the Utrecht University for critical reviewing of this paper.
REFERENCES
Alexander, D.E. 2008. A brief survey of GIS in mass-movement studies, with reflections on theory and methods.
Geomorphology, 94 (2008): 261-267.
Argialas, D.P. & Tzotsos, A. 2006. Automatic extraction of physiographic features and alluvial fans in Nevada, USA, from digital elevation models and satellite imagery through multiresolution segmentation and object-oriented classifica-tion. In Proc. of ASPRS 2006 Annual Conference, Reno,
Nevada, 1-5 May 2006.
Chang, K.T. & Liu, J.K. 2004. Landslide features interpreted by neural network method using a high-resolution satellite image and digital topographic data. In Geo-Imagery
Bridg-ing Continents; Proc. of 20th ISPRS Congress, Istanbul, 12-23 July 2004.
Delacourt, C., Allemand, P., Squarzoni, C., Picard, F., Rau-coules, D., Carnec, C. 2003. Potential and limitation of ERS-Differential SAR Interferometry for landslide studies in the French Alps and Pyrenees. In Proc. of FRINGE
2003.
Delacourt, C., Allemand, P., Casson, B., Vadon, H. 2004. Ve-locity field of the ‘‘La Clapière’’ landslide measured by the correlation of aerial and QuickBird satellite images.
Geo-physical Research Letters, 31 (2004), L15619.
Farina, P., Colombo, D., Fumagalli, A., Marks, F., Moretti, S. 2006. Permanent scatterers for landslide investigations: outcomes from the ESA-SLAM project. Engineering
Geol-ogy, 88 (2006): 200-217.
Flanders, D., Hall-Beyer, M., & Pereverzoff, J. 2003. Prelimi-nary evaluation of eCognition object-based software for cut block delineation and feature extraction. Canadian Journal
of Remote Sensing, 29: 441–452.
Geneletti, D., & Gorte, B. G. H. 2003. A method for object-oriented land cover classification combining Landsat TM data and aerial photographs. International Journal of
Re-mote Sensing, 24: 1273–1286.
Harayama, A., & Jaquet, J. M. (2004). Multi-source object-oriented classification of landcover using very high resolu-tion imagery and digital elevaresolu-tion model. Switzerland: UNEP.
Laboratoire Central des Ponts et Chaussées & Ministère de l’Aménagement du Territoire et de l’Environnement 1999.
L’utilisation de la photo-interprétation dans l’établissement des plans de prévention des risques liés aux mouvements de terrain. In Laboratoire Central des Ponts et
Chaussées (ed.).
Mantovani F., Soeters R., Van Westen C.J., 1996. Remote sensing techniques for landslide studies and hazard zona-tion in Europe. Geomorphology, 15 (1996): 213-225.
MATE & LCPC, Ministère de l’Aménagement du Territoire et de l’Environnement, Laboratoire Central des Ponts et Chaussées 1999. L’utilisation de la photo-interprétation dans l’établissement des plans de prévention des risques liés aux mouvements de terrain. Laboratoire Central des
Ponts et Chaussées.
McKean, J., Roering, J. 2004. Objective landslide detection and surface morphology mapping using high-resolution airborne laser altimetry. Geomorphology, 57 (2004): 331-351.
Metternicht G., Hurni L., Gogu R., 2005. Remote sensing of landslides : An analysis of the potential contribution to geo-spatial systems for hazard assessment in mountainous envi-ronments. Remote Sensing of Environment, 98 (2005): 284-303.
Molenaar, H. 2005. Automatic recognition of geomorphologic features. A process-based approach for the classification of landslides using remote-sensing data sources. Thesis,
IBED-Physical Geography, Section Computational Bio- and Physical Geography, Universiteit van Amsterdam.
Moretti, S., Catani, F., Bartolomei, A., Kukavicic, M., Tofani, V., Farina, P., Marks, F. 2005. Landslide hazard mapping at a basin scale using remote−sensing data and artificial neural networks. In Proc. of FRINGE 2005.
Squarzoni, C., Delacourt, C., Allemand, P. 2003. Nine years of spatial and temporal evolution of the La Valette landslide observed by SAR interferometry. Engineering Geology, 68 (2003): 53-66.
Tansey, K., Chambers, I., Anstee, A., Denniss, A., Lamb, A. 2008. Object-oriented classification of very high resolution airborne imagery for the extraction of hedgerows and field margin cover in Agricultural areas. Applied geography, 1-13.
Tarchi, D., Casagli, N., Fanti, R., Leva, D.D., Luzi, G., Pasuto, A., Pieraccini, M., Silvano, S. 2003. Landslide monitoring by using ground-based SAR interferometry: an example of application to the Tessina landslide in Italy. Engineering
Geology, 68 (2003): 15-30.
Thiery, Y. 2007. Susceptibilité aux « mouvements de versant » dans la Bassin de Barcelonnette (Alpes du Sud, France) : cartographie morphodynamique, analyse spatiale et modéli-sation probabiliste. Thèse de Doctorat, Université de
Caen/Basse-Normandie.
Van Asselen, S. & Seijmonsbergen, A.C. 2006. Expert-driven semi-automated geomorphological mapping for a moun-tainous area using a laser DTM. Geomorphology, 78 (2006): 309-320.