in
2011
with
funding
from
Boston
Library
Consortium
Member
Libraries
.M415
working paper
department
of
economics
THE
ECONOMIC
RETURNS
TO
SCHOOLING
IN
THE
WEST BANK
AND
GAZA
STRIP
Joshua
D. Angrist 95-5 Feb. 1995massachusetts
institute
of
technology
50
memorial
drive
Cambridge, mass.
02139
Joshua
D.Angrist 95-5 Feb. 1995 ijiASSACiHUSsrrrs,iwsT:ru re OFTECHN'OLOGYMAR
2
91995
LIBRARIESThe
Economic
Returns to Schooling in theWest
Bank
andGaza
StripBy
Joshua D. Angrist'
Revised: February 1995
This
research has beenmade
possibleby
grantsfrom
the Falk Institute forEconomic
research in Israel and theFord
Foundation. Special thanks to Zvi Eisenbach,Zeev
Krischer,and other staff
members
at the Israel Central Bureau of Statistics for arranging formy
use ofthe territories micro data.
Thanks
alsogo
toRon
Arbeli, Natalie Aflalo,Asher
Doron
andSamer
Haj Yehiaforoutstanding research assistance, and toMaggie
Eisenstadt, VictorLavy
andseminar participants at
Hebrew
University, theBank
of Israel, and Princeton University forhelpful discussion and
comments.
Two
anonymous
referees alsomade
helpfulcomments.
The
author bears sole responsibility for the content of this paper,
which
is a substantially revised version ofFalk Institute Discussion Paper 92.02, July 1992. This revisionwas
written while theauthorwas
visiting theMIT
Department of Economics.This paper offers a first look at micro data
from
theLabor
Force Surveysconducted in the
West Bank
and theGaza
Strip between 1981 and 1991.The
dataprovide evidenceofmajor changes in the
wage
distribution of workersfrom
the
West Bank
andGaza
inthe 1980s.One
ofthemost
important changesis thatbetween 1981-87
wage
differences between schooling groups fellby
well overone-half. This sharp reduction in
wage
differentialsby
schooling group isassociated with large increases in the size of the educated labor force.
At
thesame
time, the returns to schooling for IsraeliJews
were
stable.The
decline in returns to schooling for Palestinians is alsoapparent in panel data.These
resultsareconsistent with the notion that the returns to schooling in the territories
were
determined largely
by
theforcesofsupplyanddemand
ina segmented marketforskilled labor.
Joshua
D.
AngristDepartment
ofEconomics
H^rew
UniversityofJerusalemMediterranean Sea
were
capturedby
Israelfrom Jordan andEgypt
inJune 1967.The
economies of both theWest
Bank
andGaza
Stripgrew
rapidly after 1967, in large part as a consequence of significant labor market and product market integration with Israel (Metzer, 1992). Until1972, there
were no
institutions of higher education inthese territories. Beginning in 1972,new
local institutions ofhigher education began to open in theWest
Bank. Previously, Palestinianresidents of the territories had had to obtain their advanced schooling abroad. But
by
1986,there
were
20
institutions granting post high school degrees in the territories(Simon
1988).As
a consequence, in the early and
mid
1980s, the labor marketwas
flooded withnew
collegegraduates. This paper studies the impact of this dramatic influx of skilled workers
on
thedistribution of
wages
in the occupied territories.The
influx of Palestinian graduates provides a remarkable natural experiment withwhich
to study the impact of a dramatic increase in skilled labor
on
the returns to schooling in adeveloping country context. Moreover, the sudden increase in the
number
of Palestiniangraduates can be used to investigate whether the measured returns to schooling are a statistical
artifact attributable to individual heterogeneity that is correlated with school enrollment.
The
existenceofarelatively sophisticated and ongoing labor force survey in the territoriesmakes
this research possible. First, the TerritoriesLabor
Force Survey(TLFS)
uses a simplequestionnaire corresponding roughly to Current Population Survey
(CPS)
definitions of labormarketstatus, with arotation-group design thatcan be used toconstruct short panels.
The
latterfeature of the
TLFS
is important because panel data for developing countries is relatively rareand often of
low
quality (Ashenfelter, Deaton, and Solon 1985). Second, because productmarketsin Israel and the territories are integrated, changes in Israeli schooling differentials can
shocks
common
to thetwo
economies.Changes
inwage
differentialsandemployment
opportunitiesintheterritoriesareofespecialinterest because of recent political developments. If the declining price of skilled labor
was
really caused
by
a shift in skilled labor supply, then it is natural to askwhat
preventednew
investments in physical capital arising to
complement newly
cheap and abundanthuman
capital.Palestinians have long complained that
employment
opportunities for graduates and investmentopportunities forentrepreneurshave been deliberately limited
by
theIsraeli bureaucracy(JMCC
1992).
At
thesame
time, Israeli security forces haveacknowledged
that pooremployment
prospects for graduates are likely to have contributed to the atmosphere of frustration and
discontent culminating in the 1987 Palestinian Uprising
(Simon
1988.) Evidence ofa declinein the relative
wages
of well-educated workers provides evidence for the veracity of thePalestinian claims.
The
next section ofthepaperdescribesTLFS
data. Section II describesthe distribution ofschooling groupsin the Palestinian laborforce. Section IIIoutlinesatheoretical
framework
anddescribes
wage
differentialsby
schooling group. SectionIV
discusses evidenceon
schooling differentialsfrom
panel data and SectionV
interprets themain
findings asmovements
along astable
demand
curve for skilled workers. SectionVI
presentssome
comparisons to schooling coefficients for Israeli citizens.The
last section concludes.I.
LABOR
MARKET DATA
AND
LABOR FORCE
CHARACTERISTICS'
In 1967, theIsraeli CentralBureau ofStatistics
(CBS)
conducted apopulationCensus
intheWest Bank
andGaza
Strip. Since August 1968, the 1967 Census has been used as a sampling'Background material in this section is
drawn from
theCBS
serial for1989-90 (CBS,
frame (which is periodically updated) for quarteriy labor force surveys in the territories.
Because ofthe
TLFS
rotation group design, each surveyed household is interviewed four times.Households chosen for the survey are
randomly
divided into 4 rotation groups, each ofwhich
isinterviewed for2consecutivequarters, excludedfor
two
consecutivequarters, and interviewedagain for 2 consecutive quarters. Interviews for the
TLFS
are conductedby
local Palestinianenumerators
employed by
the Israeli Civil Administration in the territories.The
sample used here contains observationson
men
aged 18-64 interviewed in the years1981-91.
Men
constitutethebulk ofthePalestinianlaborforcebecauselabor forceparticipationrates for
women
arevery low, rangingbetween6-9
percentin the sampleperiod(CBS,
1991a).Basic descriptive statistics and sample sizes for the extract used here are reported in Table 1.
Roughly 30
to37
thousand interviewswere
conducted each year in about 7,500 householdsinterviewed 4 times each.
The
fraction ofthe sample residing in theGaza
strip fluctuates froma high of
27
percent in1981-86
to alow
of20
percent in 1988.The mean
age ofmen
in thesample is 33.
Approximatelyhalfofthe
men
inthe samplearewage
laborers, the remainderbeing mostlyself-employed (including
work
on
afamily farm orbusiness), unemployed, or in school.Wage
laborers constitute 2/3ofthe laborforce, withparticipation rates rangingfrom
72 to 82 percent.The
firaction ofmen
in the labor forcewho
were employed
in Israel and Jerusalem isshown
inthe last
column
of Table 1. This fraction ranges between37
and39
percent, including the 8-9percentofthe labor force
employed
in Jerusalem. Otherfiguresnotshown
in the table, indicate1991.^
The
fraction of the labor force with 13 ormore
years of schooling rosefrom
7 to 12 percent between 1981 and 1990.The
fraction with less than 12 years ofschooling fellfrom
81 percent to67
percent. Additional figures not reported in the tableshow
thatamong men
in the labor force with 13 ormore
years of schooling, the fractionemployed
aswage
and salaryworkersfellabout 10 percentagepoints during 1981-84 but
was
stableataround70
percentfrom1984 until the 1991
Gulf
war.The
usual typesof sampling and non-samplingerrors in labor forcesurveys are alsopresentin the
TLFS.
In addition, data collection after 1988became
more
difficult because of civildisturbances intheterritories. Because
TLFS
dataon
theterritorieswere
collectedby
anagencyofthe occupying
power
(the Israeli civil administration),TLFS
datamay
be less accurate thandata
from
comparable labor force surveys carried out elsewhere.' Moreover, although thereare
many
sensible patterns intheTLFS
data on laborforce status (e.g., seasonality; seeAngrist,1994), data
on
wages
are often poor even in the best circumstances.The
data appendixtherefore presents a brief comparison of
CBS
wage
data towage
datafrom
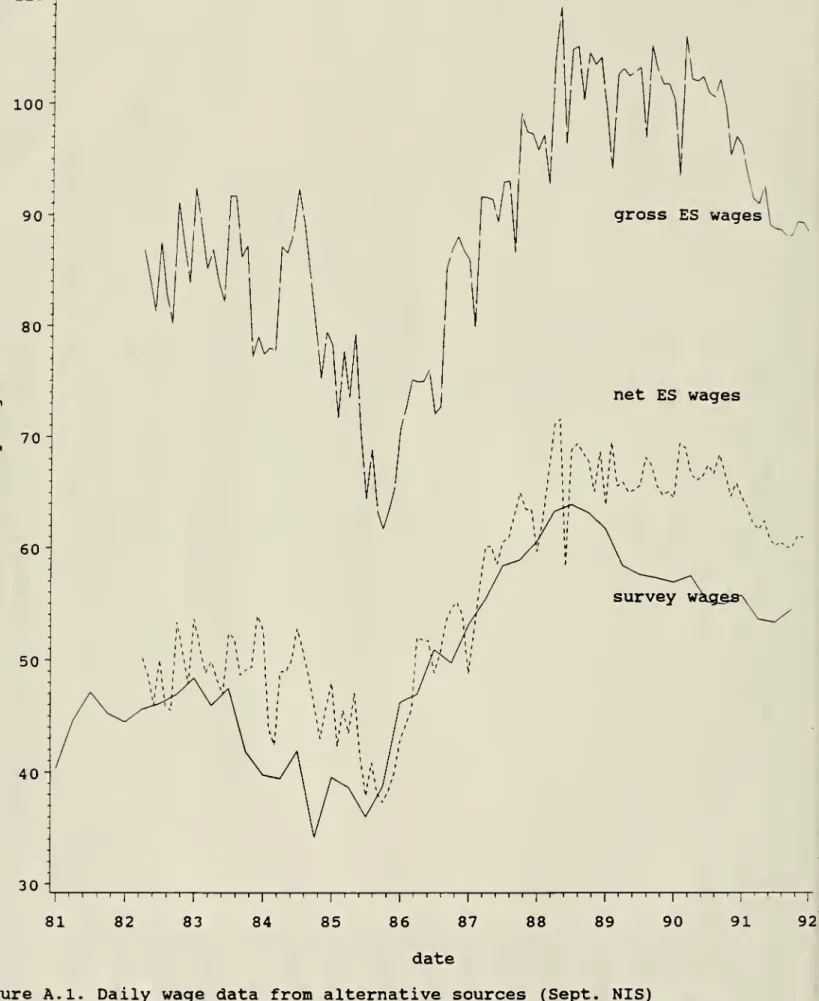
Palestinian andadministrative sources.
II.
SCHOOLING
GROUPS
IN
THE
LABOR FORCE
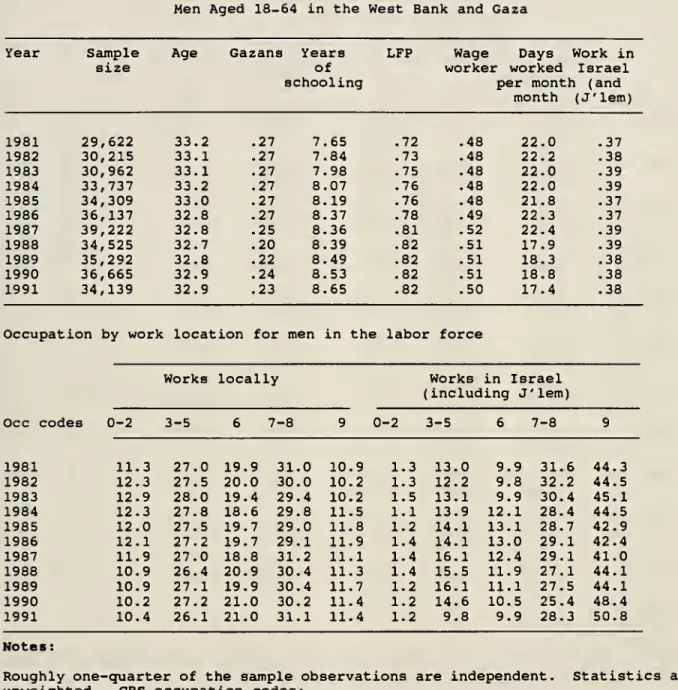
The
educatedPalestinianlabor forcegrew
substantially throughoutthe sampleperiod. Thisis
documented
in Figure 1,which
plotsthe log ofweighted countsoflabor forceparticipantsby
schooling group,
minus
thelog ofthe count in first quarter 1981. Thus, small differences along^The schooling question in the
TLFS
records the"number
ofyears of schooling (including the present year for those still enrolled) in all schools ever attended."'According to
CBS
(1991a), during the period ofunrest the fact thatsome
men
respond toquestions about days
worked by
reporting thenumber
of paidwork
days as opposed to thethe y-axis are approximately equal to percentage changes.
For
example, the figureshows
thatbetween 1982 and 1984 the
number
in the labor force with 13-15 years of schoolinggrew by
roughly
40
percent (.5-.1) while thenumber
in the labor force with 11 or fewer years ofschooling
grew by
only afew
percentage points.The
first university founded in the territorieswas
Bir Zeit in 1972, located north ofJerusalem in the
West
Bank. Subsequent growthin university enrollmentwas
rapid." Enrollmentin
West
Bank
andGaza
Strip universities doubled between1981-1985
(from 6,450 to 13,083students), and 6,600 university students graduated between 1981 and 1986 (Simon, 1988).
Substantial increases in the
number
ofgraduates are also recorded in datafrom
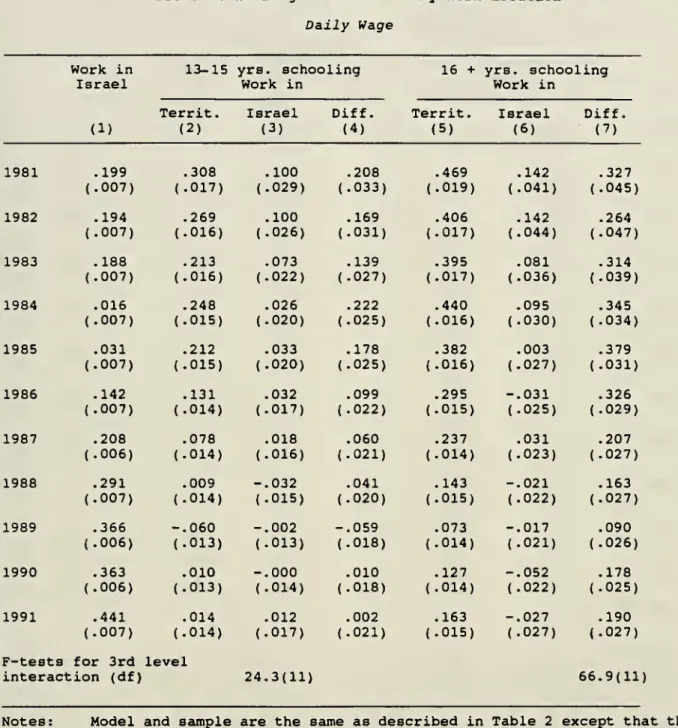
post-secondary vocational and technical schools in the territories (Al-Qiq, 1988).Many
of thenewly
educated labor force entrants did not find jobs. Figure 2 plotsunemployment
ratesby
schooling group.^ In 1981, theunemployment
rate forthelesseducatedwas
around 1 percent, whilemore
educated workerswere unemployed
atarateof 2-5 percent.But in 1985 the
unemployment
rate ofmale
labor force participants with 16 ormore
years ofschooling reached almost 16 percent, and the
unemployment
rate formen
with 13-15 years ofschooling group reached 13 percent. In contrast,
unemployment
rates formen
with 12 years ofschooling did not exceed 5 percent until late 1989. All groups experienced high
unemployment
rates during the Gulf
War.
The
next sectionshows
that the large differences inemployment
rates
by
schooling group are paralleledby
changes inwage
differentials."Universities in the territories are institutions that offer four-year
programs
leading to a Bachelor'sDegree. Beforeoffering afour-yearprogram, BirZeitwas
a two-yearjuniorcollege.^Workers are defined as
employed
iftheyworked one
ormore
hours in the last fullweek
beforethe interview, or
were
absent from work; they areunemployed
ifthey did notwork
andm.
THE
DISTRIBUTION
OF
WAGES
A. Theoretical
Framework
My
interpretation oftheempirical results in thispaperis motivatedby
a simple equilibriummodel
of workers intwo
skillgroupswho
canwork
inone oftwo
locations.*Suppose
the laborforce consists of
N
workers, includingN^
unskilled workers andN,
skilled workers, and letx
=
N,/(N,+Nu).Workers
supply daily laboreitherlocallyoras migrants in Israel.Demand
formigrants is
assumed
to be perfectly elastic ata migrant daily wage, w„,which
is thesame
forboth skill groups.
We
can therefore write the probability a skilledworker
works
locally as Pfj(Wn„w,J
and the probability an unskilledworker
works
locallyas p,u(Wm, w^J,where
w,,and w,u are local daily
wage
rates for skilled and unskilled workers.I also
assume
thedemand
forworkers in eachskill group dependsonlyon
the skill-group'swage
rateand aggregate earnings (though productdemand). Localdemand
functions for skilledand unskilled workers can therefore be written d,,(w,„y,) and d,u(w,u,y,),
where
y,=
WfsN,p,,+w,uNuP,u+w„(N-N,p,,-Nj),u) istotalearnings(assumingeveryone
works
somewhere).Local equilibrium
wages
andemployment
are determinedby
a system oftwo
equations, inwhich
w„
is a parameter:d,.(w,.,y,)
=
T[Np,,(w„,wj]
d,u(w,u,yf)
=
(l-x)[Np,„(w„,wj]
This simple
framework
allows us to predict the impact of a change inx
on
skilldifferentials.
Suppose
thatincome
effectson
localdemand
are negligible (as suggestedby
results in Angrist, 1994).
Then
we
have:(1) d//iw,./dT
=
t/(v„ -ej
<
0,dlnwjdir
=
-(l-Tr)/(ri^ -ej
>
0,where
tj,, and tj^u are local labordemand
elasticities with respect to localwage
rates and e„ and€uu are local supply elasticities with respect to local
wage
rates.These
relationships imply thatincreasing the fraction skilled in the labor force will decrease skill differentials.
If
income
effects are non-negligible, this conclusion must be modified to take account ofthefact thatchanging
wage
rates will shiftlabordemand.
Butincome
effectsareunlikely to belarge
enough
to dominate theown-
wage demand
and supply effects.Note
also that migrantwages
affect skill differentials solely throughincome
effects in local labordemand
and a laborsupply response, both of
which
are likely to be similar across skill groups. Allowing for amigrant
wage
response to changes in quantities is therefore unlikely to change the basicconclusion regarding skill differentials in this model.
The
assumed
absence ofan Israelidemand
for Palestinian skills accentuates the impact ofincreases in
x
on
skill differentials because suchdemand
would
make
the local supply ofskillsmore
elastic. In practice, the empirical resultsshow
that Israelisdo
pay apremium
forsome
Palestinian schooling groups, butit is
much
lessthan the localpremium.
Finally, notethatwage
compression in this
model
is aggravatedby
theassumed
absence of complementarity betweenskilledandunskilled labor and,
more
importantly, between laborandotherfactorsofproduction.The
impactofchangesint
is necessarily largerwhen
thedemand
for skilled labordoesnot shiftout in response to decreases in the cost of
human
capital.These
characteristics ofthe model,iftrue, increasethe likelihoodofsharply decliningschoolingdifferentialsin thefaceofincreases
B.
Wage
Differentialsby
Schoolinggroup
The
quarterly time series ofreal (September 1992 NIS) average daily and monthlywages
aregraphed in Figure3.
Average
realwages
declined between 1983 and 1985, and again attheend of the sample period. In contrast, the period 1985-88
was
one of exceptionally stronggrowth in real daily wages.
The
analysis ofschooling differentials begins with Figure 4,which
plots average log dailywages by
schooling groupafterremoving
periodeffects foreachquarterand ageeffects foreachyear.^
The
figureshows
substantial schooling premia fortwo
groups only:men
with 13-15years of schooling and
men
with 16 ormore
years of schooling.An
important feature ofthisfigure is the decline in schooling differentials since 1985.
Between
1981 and 1985,men
with13-15 years of schooling received an average 10-15 percent daily
wage
premium,
while thosewith 16 or
more
years of schooling received an average 25 percent dailywage
premium.
By
1987, however, the
wage premium
formen
with 13-15 yearsof schoolingwas
eliminated, andthe
premium
formen
with 16 ormore
years of schoolingwas
less than half the earlier level.Table 2
combines
features of the figures in a regression model. Coefficients reported inthe table are parameter estimates
from
the following equation:(2)
log(wJ
=
E, di,5^+
Ee,. (a^, •y^^^
+
E^, (b;, •y^y^
+ lA
+
«^i.,where
dj, is adummy
variablethat indicates whether observation i is observed in quarter q,and 5q, isa quarter-q effect in yeart; aj^ is a
dummy
variable that indicates age group c, yi,'Figure 4 plots residuals
from
the following regression: log(wH)=
E.AA
+
E,,, (a^e •yi0/3c
+
"h ,where
dj, is adummy
variable that indicates if observation i is in quarter t, 5t is a quartereffect, a^te is a
dummy
variable that indicates if observation i is in agegroup
c, y^ is adummy
variable that indicates ifobservation i is in year t, and^^
is an age effect in yearis a
dummy
variable thatindicates year t, and /S^, is an age effect in year t; bj^ is adummy
variable that indicates schooling group g and 7c, is a schooling effect in year t;
4
is adummy
variable that indicateswork
in Israel or Jerusalem and 0, is awork
location effect inyear t.
Age
groups indexedby
c are: age 25-34, age 35-44, age 45-54, age 55-64.Schooling groups indexed
by
g are: 13-15 years, and 16 ormore
years. Thisdummy
variableparameterization captures the most important
wage
differencesby
schooling group.*Additional covariates in the regression include sets ofannual effects for residence in the
Gaza
Strip, residence in a refugeecamp,
and residence in an urban area.The
dependentvariables are the log of daily
wages
and the log of monthly wages.The
sample excludes observations with reported realwages above
15,000 shekels/month
(about 6,000 dollars).Workers from
the territoriesemployed
in Israel are concentrated in semi-skilled andunskilled jobs, and in the Israeli construction and agriculture industries (See Table 1 and
Kleiman
1992,Semyonov
and Lewin-Epstein 1987).The
firstcolumn
ofTable 2shows
thatthedaily
wage premium
for working in Israel fellfrom
roughly 18 percent in 1981 to zero in1984.'
The
Israelwage premium
then rises steeply beginning in 1986. Dailywages
in Israelwere 37
percent higher than localwages by
1989, nearly doubling the 1987wage
differential.The
monthlywage premium
for working in Israelmoves
similarly.These
changes parallel thepatternofPalestinianabsences
from
work, andare consistentwithmovements
alongan inelastic*The high school
premium
(relative to those with lessthan 12 years ofschooling) averagedaround 5 percent for the years 1981-1985. It too declined sharply between 1984 and 1988.
'This decline is probably because of the 1983-84 recession and an inflation stabilization
program
in 1985,which
involvedwage
guidelines and price controls that led to a substantialerosion of real wages.
Wages
and prices in the territorieswere
less effectively controlled (Artstein and Sussman, 1990; Zakai, 1988).Israeli
demand
curve for Palestinian labor (Angrist, 1994).Columns
2 and 3show
that schooling differentials in dailywages
declined steadily until1989 and
became
negative formen
with 13-15 years of schooling in 1988-89. Althoughschooling differentials fell furtherin 1988, it is important to note that thesechanges began well beforethe beginning ofthe Palestinian uprising.
For
example, a 41 percentdailywage premium
for
men
with 16 ormore
years of schooling in 1981 fell to20
percentby
1986.'°Alternative explanations forthe decline in relative
wages
for the well-educated are relatedto political developments in the
Middle
East.Many
educated workers areemployed
locally inthe public sector as teachers. Jordan,
which
fundedsome
public sectoremployment
in theterritories, experienced
economic
growth ata rateof 10-11 percentper yearbetween 1976 and1982 (Zakai, 1988). But
economic
growth inJordan sloweddramatically in 1983, andtheflowoffinancial resources
from
Jordan and otherArab
states appears to have been reduced after thePLO
was
expelledfrom
Lebanon
in 1982.Another important factor in the Palestinian local
economy
is the repatriation of fundsby
Palestinians livingabroad, mostlyintheGulfStates.
Rough
estimatesbasedon
officialJordanian figures (Abu-Shukar, 1990) suggestthattheamount
ofincome
repatriateddeclinedby
15percentbetween 1984 and 1985.
A
related development is the reduction in opportunities for foreignemployment
facedby
Palestinians around 1982 (Gabriel and Sabatello, 1986; Shaban, 1993)."'*rhis finding is inconsistent with claims
by Shaban
(1993, p. 667) that access tothe Israelilabormarket thatled to a compression ofskill differentials in the territories.
The
Israeli marketwas opened
to Palestinians in October 1970. Althoughno
evidence has been presented for the1970s, Table 2
shows
that skill differentials remained substantial in the early 1980s."Out-migration fell sharply in 1982 and 1983 but remained positive throughout the 1980s
Finally, changes inthe
wage
distribution since 1988 areat leastpartly explainedby
thefact civildisorder, curfews, and strikes during the Palestinian uprising disrupted
economic
activity intheterritories
more
than in Israel.Although political and social factors mightexplain the decline in schooling differentials in
the local labor market, it is noteworthy that schooling differentials declined for workers
employed
in Israel as well as for thoseemployed
locally.'^ This isdocumented
in Table 3,which
reports annual schooling differentials separatelyby
work
location.The
coefficientsreported inTable 3 include
main
effects for working in Israel (includingJerusalem),schooling-group
dummy
variables, and the interaction of schooling-groupdummies
with adummy
thatindicates
working
in Israel or Jerusalem.For
example, between 1981 and 1987, thepremium
paid to workerswith 13-15 years ofschooling
who
were
employed
locallydeclinedfrom
31 to8percent.
At
thesame
time, thepremium
paid to similarlyeducated workersemployed
inIsrael fellfrom
10 to 2 percent. This is consistent with the supply-shift story in themodel
outlinedatthebeginning ofthissection, provided the
model
isaugmented
toallow foraninelastic Israelidemand
for Palestinian schooling.'^'^My working
paper (Angrist 1992)shows
that in the 1980s educated Palestinian workerswere
increasingly likely towork
in Israel, thoughon
averagemore
likely towork
locally.Overall, roughly 4 percent ofPalestinians
who
worked
in Israel had 13-15 years of schoolingand roughly 1.5 percent had 16 or
more
years.Among
workersemployed
in Jerusalem, 5.5percent had 13-15 years of schooling and 3 percent had 16 or
more
years ofschooling. In the extract used here, a total of over 6,200 workers with higher educationwere
notemployed
locally.
Over
75 percent of local workers with 13 ormore
years schoolingwere
inadministrative, managerial or clerical positions. In contrast, fewer than
42
percentofeducatedworkers
working
in Jerusalem or Israelwere
employed
in similar positions."This finding is inconsistent with those of
Al-Dweik
(1988),who
claimed that there is nopremium
for the schooling of Palestiniansemployed
in Israel. Moreover, the pattern of estimated returns to 13-15 years of schooling is similarwhen
men
who
work
in Jerusalem areA
final piece of circumstantial evidence for the supply-shift explanation of changes inschooling differentials between 1981-87 appears in Table 4. This table reports the coefficients
on
coarse occupationdummies
added to the basic specification reported in Table 2.The
occupation
mix by
work
location is reported in Table 1. Studies using data from developedcountries usuallyfind thatan importantpartofthereturns to schooling
work
through occupationeffects. Table4
shows
that this isalso true forPalestinian wage-workers because the schoolingcoefficients are smaller
when
occupationdummies
are added to the regressions. Moreover,beginningin 1984the patternofoccupationcoefficients appearsto reflecttheincreaseinthe size
of educatedcohortsina
manner
similar to the schoolingcoefficients.For
example, thepremium
(relative to the reference group of
manual
laborers) for being in a administrative or managerialjob fell
from
.32 to .12 between 1981-87 while thepremium
for skilled (blue-collar) labor fellfrom
.12 to .07.IV.
CONTROLLING FOR
INDIVIDUAL
HETEROGENEITY
The
findingspresented so farcouldbeexplainedby
achangeinthe qualityorfieldofstudyofgraduates, or
by
selection bias resulting from achanging relationshipbetween schooling andlabor force participation or out-migration.
To
provide evidenceon
the first point, Figure 5shows
thenumber
ofgraduatesfrom
four-year Bachelor'sDegree programs by
broad field ofstudy for the years
1975-90."
The
most popular fields are literature and humanities, although theproportion ofall graduates in thesefieldsremains roughly constantataround35-40
percent.were
employed
in Israel outside of Jerusalem received essentiallyno
return to schoolingthroughout the sample period.
'"•Data in the figure are derived
from
reports publishedby
The
Palestinian Institute forHigher Education (1991, and selected years), and
from
unpublished tables providedby
theStudents with degrees in science, engineering, and economics and
management
also constitute35-40
percent of the totalnumber
of graduates throughout the period of rapid growth inPalestinian higher education.
The
mix
ofgraduatesby
field appears fairly constant, but the largenumbers
ofhumanities graduates in recent yearsmay
have depressed the average returns to schooling ifemployment
opportunities for this group are especially limited. Repeated observations on individuals,
however, can help control for these or other composition and selection effects.
A. Panel Data
Households selected for enumeration in the
TLFS
are interviewed for a second time onequarter after the first interview, for a third time one year after the first interview, and for a
fourthtime
one
quarterafterthe thirdinterview.For
example,men
interviewed forthefirsttimein the first quarter of 1981 are also interviewed in the second quarter of 1981, and in the first
and second quarters of 1982.
The
TLFS
can therefore be used to construct a series of shortoverlapping panels. I
was
ableto match80-85
percent offirst-interview records to informationfrom
thesecond, third, and fourth interviews. Fordetails, see theappendixtomy
working paper(Angrist 1992).
Columns
1-3 of Table 5 report estimates of the following equation fit to the sample ofthird-interview responses separately foreach year:
(3) log(WiO
=
E, di,5^+
Xi^,.+
x^&^
+
ChT.+
fi.^,+
uk; t=
82, . . ., 91;where
j8„ and /Sj, are the parameters in a quadratic function ofpotential experience (Xjt), C;,is years of schooling, and f^ is a
dummy
that indicateswork
in Israel. 7, and 5, are thebetween schooling and earnings
was
parameterized as linear in schooling.'^ Equation (3)was
estimated withthree additional
dummy
variables foreach yearthatindicate residencein theGaza
Strip, in a refiigee
camp,
or in urban areas. These variables are added to control for regionaldifferences in
worker
characteristics other thanwork
location.Work-in-Israeland linearschooling coefficients for thethird-interview regression, reported
in
columns
1-2 of Table 5,show
thesame
patterns observed in Tables 2-3.The
Israelwage
premium
was
negative in 1984-85, but rose to anew
high in 1989.The
schooling coefficient declinedfrom
roughly 4 percent in 1984 to 2.1 percentin 1986, and dropped to zero during the Palestinian uprising.Column
3 of Table 5shows
a similar decline in the effect of potential experience (defined as ageminus
years of schoolingminus
5, and evaluated at themean
ofexperience and experience-squared).
Lagging equation (3) one year and adding individual effects gives the following equation
for first-time interviews,
which
occur in thesame
quarter one year earlier than third-timeinterviews:
(4) log(w,_,)
=
a;+
E, d^5^.,+
(Xrt-
l)^,,.,+
(Xh-
m^-,
+
e,7,_,+
i^.A-x
+
v.-ut
=
82, . . ., 91.Here
Iassume
that schooling is time-invariant, so that ej,=
€;,_, and X;,=
X;,.,+
1.Subtracting (4)
from
(3) and using these assumptions,we
have(5) log(WiO
-
log(w,_,)=
E, di,(5^-
5^_,)+
(/3„_,-
/S^,.,)+
x,(2/32._,+
^u
"
^u-.)+
Xtt^(j82,-
)82._,)+
e,(7.-
7,-i)+
W.
"
<?.-!)+
(h
-
fn-O^.-i+
(I'h"
Vh-,)-'^Becauselinearity islikelytobeapoor approximationtotheschooling-earningsrelationship
at the extremes, observations with less than 6 years of schooling and
more
than20
years of schooling are droppedfrom
the estimation sample.The
derivation of equation (5)makes
use of the fact that X;,^-
Xj,.,^=
2xit-
1. In the estimation, equation (5) includes the time-invariant region-of-residencedummies
included inequations(3) and (4)becausetime-invariant regressors are
assumed
tohavetime-varyingeffects.Itisimportant to note that equation (5) can be modified to allow forheterogeneous returns
to schooling as well as additive heterogeneity originating in the decision to
go
to school (thelatter is represented
by
«;). Define {y^—
7i,_,)=
y^ to be the individual-specific change inreturns to schooling.
For
example, the year-to-yearchangein returns to schoolingwould
differacross individuals if the returns to schooling differ
by
school quality orby
field of study.Replacing {y^
—
7^-1)by
7;, in (5), it is straightforward toshow
thatOLS
estimates of thedifferenced equation have expectation or probability limit equal to a weighted average of 7;.**
Thus, the reported estimates of(7,
—
7i_,) can be interpreted as estimates ofthis average.The
differenced estimates therefore answerthe question ofwhether (on average) specific individuals
experienced a year-to-year decline in the returns to schooling.
Columns
4-6
of Table 5 report estimates of 6^ and (0,-
0,_,).Column
4 reports thecoefficient
on
4
-
fj,_i in equation (5), which provides oneestimate of 0,.Column
5 reportsthe coefficient on 4,
which
provides an estimate of fl,—
5,_,.Columns
4 and 5 arecombined
to provide second estimate of 5, in
column
6. All threecolumns
show
evidence ofthesame
decline in theIsrael
wage premium
as observed incolumn
1, although the alternative estimatessuggest
somewhat
different timing.The
alternative estimates are not significantiy different in5 out of
9
comparisons (p<
.02), but the joint test ofcoefficient equality for the alternativeestimates of 5, leads to rejection of the null hypothesis.
"The
weightsare S-^/l^B-^where
6; isthe residualform
a regressionofschoolingon
all other covariates in the differenced equation.Column
7 reports the year-to-year change in schooling coefficients, estimated as thecoefficient
on
ej, in equation (5).Here
too, the coefficients indicate a change qualitatively similar to the changesinthe levels regression (column2).The
schoolingcoefficient isestimatedto havedeclined
by
roughly 1.1 percentage pointbetween 1984 and 1985, andby
1.3percentagepointsbetween 1985 and 1986, with further substantial declinesduring the Palestinian uprising.
The
results in Table 5 therefore support the claim that the decline in the average returns toschooling
was
experiencedby
individual Palestinian graduates.A
potentialproblem
withmy
interpretation ofthe panel results is that while the derivationofequation (5) assumesthat schooling is time-invariant, reported schoolingchanges between the
first and third interviews for roughly
30
percent of the sample.The
fact that the frequency distribution of schooling changes is nearly symmetric around zero suggests that the changes inreported schooling
from
interview to interview are at least partly attributable to mis-reportingor other typesof
measurement
error.The
observed decline in schoolingcoefficients, especially after 1987, could therefore be at least partly attributable to changes in dataquality.To
correct for possiblemeasurement
error in schooling variables, I tried an instrumentalvariables (TV) strategy using schooling levels reported atthe second interview as an instrument
for schooling variables in equations for third interview responses or first-third interview
differences.
A
statisticalmodel
justifying this approach is outlined inmy
working paper(Angrist, 1992). It turnsout that
IV
estimatesfrom
this procedurearevirtually identical totheOLS
estimates.""IV
estimation isbasedon
amodified specificationwhere
the potential experience quadraticis replaced
by
an age quadratic.Only
forone
year areIV
estimates different fromOLS
estimates, and for equations in levels as well as differences, the statistically significant contrast
inthe WestBankandthe GazaStrip 17
V.
THE
DEMAND
FOR
SKILLED
LABOR
Figures 6 and 7
show
the relationship between the log of average dailywages
and the logofcohort size (including
men
in the labor force plusmen
temporarily out ofthe labor force)by
quarter and
by
schooling group formen
who
reported their usualwork
location as being in theterritories, Israel or Jerusalem.
These
graphs are motivatedby
the theoreticalframework
laidout in the beginning of Section HI,
which
relates changes in schooling differentials to changesin the size of schooling groups. Averages in the figure
were computed
usingCBS
samplingweights.
The
data in Figure 6 are for 1981-87 only; the data in Figure7 are for 1988-91.The
figures plotthe residualsfrom regressionsoflog dailywages
andloglabor force countson
afullset ofquarterlyperiodeffectsandannual schooling-groupeffects.The
slopeofthelinedrawn
through the points in the figure is therefore an estimate of the parameter 0g in theequation
(6) /n(WgO
=
StdA +
S, bgTgt+
0g//i(LgO+
ug,where
g indexes schooling groups and Lgt is the sizeoftheschooling-group cohort.The
linedrawn
is for the 16 ormore
schooling group.For
the sample of quarterly observations for1981-87, <^g is equal to -.16 (standard error
=
.06, partial R^=
.21) formen
with 13-15 years of schooling, <^g is equal to -.25 (standard error=
.11, partial R^=
.16) formen
with 16 ormore
years of schooling, and 0j is equal to -.28 (standard error=
.07, partial R^=
.37) formen
with 12 or fewer years ofschooling.The
regressionlinein Figure6 appearsto accountforan important fractionofthevariancein
wage
differentials between 1981 and 1987. Thus, the figure for 1981-87 is consistent with7
show
that in the sample of quarterly observations for 1988-91 there is little relationshipbetween schooling-group size and
wage
differentials. This suggests that declines in relativewages
for educated workers after 1988 aremore
likely to be attributable to the disruption oflocal
economic
activity during the Palestinian uprising than to supply shifts.VI.
CHANGES
IN
THE
ISRAELI
WAGE
DISTRIBUTION
A
natural question raisedby
the findings presented so far iswhat was
happening to thewages
ofIsraelicitizens during the sampleperiod. Ifthe Palestinian experiencewas
not uniqueamong
groups under Israeli influence, thensome
of the decline in returns to schoolingamong
Palestinians could reflect
demand
shockscommon
to the Palestinian and Israeli economies.Table 6 presents estimates of
wage
equations for Jewish and non-Jewish Israeli citizens.'*The
data used to construct these estimates aredrawn from
the IsraeliIncome
Survey (IS) andaredescribed in the dataappendix. Briefly, the IS includes residentsofurban areasin outgoing
rotation groups
from
the IsraeliLabor
Force Survey (LPS).The
IS sampling frame includesabout
94
percent of the Jewish population but only40
percent of the non-Jewish population.This sample
may
notberepresentativeofthepopulationofnon-Jewishworkers.For
bothethnicgroups, the sample used here is restricted to
men
aged 18-59.Citizen
Arabs
in theIsraeli labor market have labor force characteristics closer to thoseofnon-citizen
Arabs
than to Israeli Jews.For
example, estimatesfrom
the 1983 Israeli Census,reported in Lewin-Epstein and
Semyonov
(1993, Tables 3.2 and 3.3),show
that30
percent ofArab
men
in the Israeli labor forcewere
self-employed and 12 percentwere employed
asagricultural workers. Both ofthese proportions are
much
loweramong
Jewish Israelis.The
'*Most non-Jewish Israelis are
Moslem
Arabs althoughsome
are Christian Arabs, Druze,distributionofeducationalattainment
among
Israeli Arabsisalsocloser to the distributionamong
noncitizen Arabs than to the distribution
among
Israeli Jews. In 1985, forexample, 25 percentofIsraeli
Jews
aged 15 and over had 13 ormore
years of schooling while only 8.5 percent ofIsraeli Arabs had 13 or
more
years ofschooling(CBS
1991b, Table 22.1). Finally, Census datashow
that, like Arabsfrom
the territories, Israeli Arabs have a high proportion (28 percent) ofemployment
in construction.The
wage
variableused to construct the estimates reported in Table 6 is the log ofweeklywage
and salary earnings.Columns
5 and 10 in the tableshow
average log weekly earnings along with standard deviations for Jewish and non-Jewish workers.Columns
4 and 9show
sample sizes for the subsamples with valid
wage
data.The
estimates in the table are basedon
samples of 2,489-3,189 observations for
Jews
but only 119-262 observations for non-Jews.Wages
of non-Jews are substantially lower and have less variance than thewages
of Jews.Columns
1-2 and 6-7 report schooling coefficientson
dummies
for 13-15 years and 16 ormore
years ofschooling in regressions that include quarterdummies,
dummies
for continentofbirth (forJews),
dummies
for 5-yearage groups, anddummies
forwork
location and region of residence.The work
locations and regions ofresidence are Jerusalem, Haifa, northern Israel,central Israel excluding Tel Aviv, and southern Israel. Tel
Aviv
is the reference location forboth sets of
dummies.
The
estimatesforJewishIsraelisshow
apatternofschoolingcoefficients thatisremarkablystable in the 1980s, and similar to the 1981 and 1982 coefficients for Palestinians.
The
weeklywage premium
for those with 13-15 yearsofschooling rangesfrom
.24 in 1981 to .29 in 1985,1982 (these estimates are
from
Table 2.)The
premium
forJews
with 16 ormore
years ofschooling ranges
from
.40 in 1982 to .45 in 1989.The
comparablepremium
for Palestinianswas
.41 in 1981 and .37 in 1982.The
returns tohigher education forJewish Israelisshow
a noticeable declinebetween 1989 and 1991.The
weeklywage premium
forworkers with 16ormore
years ofschooling fell from.45 to .37, and the
wage premium
for 13-15 years of schooling fellfrom
.23 to .18. Thesedeclinesprobably reflect the arrival of a
wave
ofrelatively skilled immigrantsfrom
theFormer
SovietUnion. This
wave
of immigration began inearnest in late 1989.The
resultsofreplacing the schoolingdummies
with years ofschoolingasalinear regressor, reported incolumn
3,show
a similar pattern. Per-year returnsare stablearound 6 percent between 1981 and 1988 (with a
slight dip in 1988), but
show
a sharp decline only between 1988-91.Estimated schooling
dummies
for non-Jewish Israeli citizens are reported incolumns
6-7.These
estimates are basedon
small samples and reflect considerable sampling variance, withsome
verylow
and very high estimates.The
resultsshow
a pattern of a steadily increasingpayoff to 13-15 years of schooling
from
1981-90.The
payoffto 16 ormore
years fellfrom
1981-85, as it did for Palestinians, but rose
from
1985-89, in contrast with continued declines for Palestinians over this period. Moreover, the conclusion that declining returnswere
notexperienced
by
non-Jewish Israeli citizens is reinforcedby
themuch
more
precisely estimatedlinearschoolingcoefficientsreportedin
column
8.The
linearschoolingcoefficients fornonJews
are virtually
unchanged from
1981-85. Schooling coefficients for non-Jewsdecline thereafter,but these declines are not sharp until 1990.
schooling
among
Palestinians,among
Israelicitizensunemployment
ratesarelowerfor themore
educated.
The
former pattern is typical ofless developed countries (for example, Kenya, seeTodaro, 1981), the latter
more
commonly
observed in wealthier countrieslike theUS
(Mincer,1991). Moreover, in the early 1980s
when
unemployment
among
educated Palestinianswas
growing worse, the situation foreducated Jewish Israelis improved.
For
example, Israeli Jewswith 13-15 years of schooling experienced a 1.6 percentage point lower
unemployment
rate in1981 than did Israeli
Jews
with 12 or fewer years of schooling.By
1985, the gap in favor of themore
educated hadgrown
to 3.9 percentage points.VII.
SUMMARY
AND
CONCLUSIONS
This paperprovides acase studyof
wages
inadeveloping regionwhen
thehighereducationsystem
expanded
rapidly. Palestinian studentswho
observedwage
premiaashigh as40
percentwhen
theymade
enrollment decisions endedup
earning less than20
percentmore
than high school graduateswhen
they entered the labor market. This suggests that contemporaneousschooling coefficients can be a poor indicator of the ultimate
economic
value of additionalschooling
when
largenumbers
ofnew
graduates enter the labor market.The
findings also have implications foreconomic
models ofeducation indevelopment. In a survey of returns to schooling worldwide, Psacharopoulos (1985, p. 592) writes, "Judgingfrom
past trends and the degree of underinvestment in education in developing countries, thefears that further educational expansion
would
lead tounemployed
graduates orwould
lowersocial rates of return are unfounded." Although the evidence presented here does not speak
directiy to the issue of social returns, it
would
appear that this viewwas
overly optimistic forlabor market for college graduates in the early 1970s, recent declinesin Palestinian enrollment
probably reflect the beginning ofa belated supply response to
low
returns to schooling. Thisresponseand therecentprospectofincreasing capital investment should eventuallyrestore
some
economic
value to schooling in the territories.Finally, it is worth noting that as an area under occupation, the labor market in the
territories has
many
unique features.For
example,economic
aspects of life in the territoriesduring the sample period include the lack of an effective private capital market or banking
system with the
power
tomake
loans (Shaban 1993.)These
limitations undoubtedly contributedto the declinein
economic
returns to schooling in the territories.The
social implicationsofthishuman
capital/physical capitalmismatch
would
appear to include a climate ofdisappointmentand political instability
which
culminated in large-scale civil unrest in 1988.The
consequencesofthis
mismatch
are all themore
impressivewhen
one
notes that themain
period ofdecliningskill differentials, 1985-1988,
was
one of exceptionally strong growth in realwages
for bothTable
1:Descriptive Statistics
Men Aged
18-64 in theWest Bank
andGaza
Year
Sample
size
Age
Gazans
Years
LFPWage
Days
Work
inof
worker
worked
Israel
schooling
per month
(andmonth
(J'lem) 33.2 .27 7.65 .72 .4822.0
.37 33.1 .27 7.84 .73 .48 22.2 .38 33.1 .27 7.98 .75 .4822.0
.39 33.2 .27 8.07 .76 .4822.0
.39 33.0 .27 8.19 .76 .48 21.8 .3732.8
.27 8.37 .78 .49 22.3 .37 32.8 .25 8.36 .81 .5222.4
.39 32.7 .20 8.39 .82 .51 17.9 .39 32.8 .22 8.49 .82 .51 18.3 .38 32.9 .24 8.53 .82 .51 18.8 .38 32.9 .23 8.65 .82 .50 17.4 .38 1981 1982 1983 1984 1985 1986 1987 1988 1989 1990 199129,622
30,215
30,962
33,737
34,309
36,137
39,222
34,525
35,292
36,665
34,139
Occupation by work location
formen
in thelabor
force
Works locally
Works
inIsrael
(including
J'lem)Occ
codes
0-2 3-5 6 7-8 9 0-2 3-5 6 7-8 9 1981 11.327.0
19.931.0
10.9 1.3 13.0 9.9 31.6 44.3 1982 12.3 27.520.0
30.0 10.2 1.3 12.2 9.8 32.2 44.5 1983 12.928.0
19.4 29.4 10.2 1.5 13.1 9.9 30.4 45.1 1984 12.327.8
18.6 29.8 11.5 1.1 13.9 12.128.4
44.5 1985 12.0 27.5 19.7 29.0 11.8 1.2 14.1 13.1 28.7 42.9 1986 12.1 27.2 19.7 29.1 11.9 1.4 14.1 13.0 29.142.4
1987 1988 11.9 10.9 OT O 1fi fl 31.2 30.4 11.1 11.3 1.4 1.4 16.1 15.5 12.4 11.9 29.1 27.141.0
44.126.4
20.9 1989 10.9 27.1 19.9 30.4 11.7 1.2 16.1 11.1 27.5 44.1 1990 10.2 27.2 21.0 30.2 11.4 1.2 14.6 10.525.4
48.4 1991 10.4 26.1 21.0 31.1 11.4 1.2 9.8 9.9 28.3 50.8Notes
:Roughly one-quarter
ofthe sample observations
areindependent,
unweighted.
CBS
occupation
codes:Statistics
are0-2
scientific,
academic,
professional,
technical,
administrative,
managerial
3-5
clerical,
sales,service
6
agricultural
7-8
skilled
worker
in industry, mining,construction,
transport
orother sector
Table
2:Wage
Determinants
DaiLy
wage
Monthly wage
Work
in 13-15 yrs 16+ yrsWork
in 13-15 yrsIsrael
schooling schooling
Israel
schooling
(inc. J'lem) (inc. J'lem)
(1) (2) (3) (4) (5) 16+ yrs
schooling
(6) 1981 .184 (.007) .251 (.015) .408 .017) .073 (.009) .296 .018) .462 (.021) 1982 .182 (.007) .218 .014) .368 .016) .064 .008) .269 (.017) .433 (.020) 1983 .171 (.007) .160 .013) .334 .015) .043 .008) .221 .016) .408 (.019) 1984-.011
(.007) .164 .012) .358 .014) -.133 .008) .212 (.015) .427 (.017) 1985 .004 (.006) .145 .012) .278 .014) -.116 .008) .190 .015) .334 (.017) 1986 .122 (.006) .088 .011) .204 .013) .001 .008) .116 .013) .258 (.016) 1987 .194 (.006) .050 .010) .178 .012) .066 .007) .062 .013) .205 (.015) 1988 .279 (.006) -.012 .010) .089 .013) .075 .008) .091 .013) .247 (.015) 1989 .368 (.006) -.033 .010) .048 .012) .204 .007) .085 .011) .223 (.015) 1990 .354 (.006) .004 .009) .076 .012) .174 .007) .128 .011) .239 (.014) 1991 .431 (.007) .011 .011) .107 .013) .251 .008) .119 .013) .258 (.016)Sample
171 ,691171,783
Notes:Sample
includes
men aged
18-64who
indicated
they
work
inthe West
Bank,Gaza
Strip,
Jerusalem or
Israel;with valid schooling variables,
excluding Gulf War
quarter
for 1991.Estimates
arecoefficients from
aregression
of logwages
ona full set of
quarterly-period effects,
annual
work-in-Israel effects,
annual
effects
for (13 £schooling
£ 15),(schooling
> 16) and (25 < age < 34) effects,(35 <
ages
s 44), (45 £ age £ 54)effects,
(55 £ age £ 64)effects,
annual
effects
forresidence
in arefugee
camp, anurban
area, andthe Gaza
Strip, anda
single
dummy
foremployment
inJerusalem.
Sample
weighted by
CBSsampling
weights.
Standard
errors
inparentheses.
Standard
errors
notcorrected
forTable
3:Schooling
Coefficients by Work Location
Daily Wage
Work
inIsrael
13-15 yrs.schooling
Work
in 16 + yrs.schooling
Work
in Territ.Israel
D (1) (2) (3)iff. Territ.
Israel
D(4) (5) (6) iff. (7) 1981 .199 (.007) .308 (.017) .100 (.029) .208 (.033) .469 (.019) .142 (•041) .327 (•045) 1982 .194 (.007) .269 (.016) .100 (.026) .169 (.031) .406 (.017) .142 .044) .264 (•047) 1983 .188 (.007) .213 (.016) .073 (.022) .139 (.027) .395 .017) .081 .036) .314 .039) 1984 .016 (.007) .248 .015) .026 .020) .222 (.025) .440 .016) .095 .030) .345 .034) 1985 .031 (.007) .212 .015) .033 .020) .178 .025) .382 .016) .003 .027) .379 .031) 1986 .142 (.007) .131 .014) .032 .017) .099 .022) .295 .015) -.031 .025) .326 .029) 1987 .208 (.006) .078 .014) .018 .016) .060 .021) .237 .014) .031 .023) .207 .027) 1988 .291 (.007) .009 .014) -.032 .015) .041 .020) .143 .015) -.021 .022) .163 .027) 1989 .366 (.006) -.060 .013) -.002 .013) -.059 .018) .073 .014) -.017 .021) .090 .026) 1990 .363 (.006) .010 .013) -.000 .014) .010 .018) .127 .014) -.052 .022) .178 .025) 1991 .441 (.007) .014 .014) .012 .017) .002 .021) .163 .015) -.027 .027) .190 .027)
F-tests
for 3rd leveinteraction
(df)5l
2<1.3(11) 6(i.9(ll)
Notes:
Model
andsample
arethe
same asdescribed
inTable
2except that
theschooling coefficients
areallowed to
differ by work
location.Column
1
shows
Work-in-Israel main effects.
Sample weighted by
CBSsampling
weights.
Standard errors
inparentheses.
Standard errors
notcorrected
Table
4:Occupation Effects
13-15 yrs 16+ yrs
Occupation
CociesSchooling schooling
admin.clerical
;0-2 3-5 (1) (2) (3) (4) igric. 6 (5)
skilled
7 (6)-.182
(.011) .105 (.008)-.163
(.011) .122 (.007)-.129
(.011) .089 (.007)-.202
(.010) .115 (.007)-.161
(.010) .100 (.007)-.154
(.010) .102 (.007)-.130
(.010) .070 (.007)-.133
(.009) .055 (.007)-.112
(.010) .067 (.007)-.104
(.009) .067 (.006)-.128
(.011) .083 (.007) 1981 .180 (.017) .335 (.020) .150 (.016) 1982 .106 (.016) .239 (.019) .232 .016) 1983 .115 (.015) .279 (.018) .115 .015) 1984 .038 [.014) .196 (.016) .315 .015) 1985 .030 .013) .149 (.016) .278 .015) 1986 .031 .012) .129 .015) .180 .014) 1987 C).016 .011) .125 .014) .121 .013) 1988 -.010 .011) .087 .014) .026 .014) 1989 .003 .010) .102 .013) -.074 .012) 1990 .009 .010) .085 .013) .009 .013) 1991 Sample: 171, .018 .012) 518 .118 .015) .004 .015)-.007
(.010)-.028
(.010)-.056
(.010) .015 (.009) .036 (.009)-.022
(.008)-.078
(.008)-.106
(.008)-.128
(.008)-.129
(.008)-.157
(.010) Notes:Scunple
includes men aged 18-64 who
indicated they work
inthe West
Bank,Gaza
Strip,
Jerusalem
or
Israel;with
valid
schooling
variables.
Estimates
arecoefficients
from the
same
model
reported
inTable
3,with the
addition
of 4occupation dummies.
The
occupation reference group
is 9(unskilled industrial
and
transportation workers).
Sample weighted by
CBSsampling weights.
Standard
errors
inparentheses.
Standard errors
notcorrected
forrepeat observations
onTable
5:First-Difference Estimates of the Daily Wage Equation
Levels
(3rd interview)Differences
(3rd-1st)Work
inYears
ofPotential
Work
inIsrael
schooling
exper. Israel[^j [tj
m
m
(1) (2) (3) (4)Work
inWork
in Israel Israel [^t'-e.-.] [«t'] (5) (6)Years
ofschooling
[7t-7t.i] (7) 1981 .281 .031) 1982 .214 (.019) .040 (.003) .276 (.024) .268 .031)-.013
(.023) .193 .031)-.001
(.003) 1983 .154 (.019) .032 .003) .185 .024) .171 .031)-.022
(.023) .250 .031) .0004 (.003) 1984-.008
(.018) .039 .003) .281 .023) .054 .030)-.196
(.022) .150 .029) .008 (.003) 1985-.048
(.017) .031 .003) .210 .022) .073 .029)-.078
(.021) .032 .027)-.011
(.003) 1986 .119 (.016) .021 .002) .172 .022) .105 .027) .072 (.020) .219 .025)-.013
(.003) 1987 .199 (.016) .026 .002) .192 .020) .264 .025) .045 (.019) .141 .024)-.008
(.003) 1988 .282 (.016) .011 .002) .136 .020) .227 .025) .087 (.019) .114 .028)-.008
(.003) 1989 .399 (.016) .003 .003) .126 .021) .198 .028) ,083 (.020) .300 .028)-.013
(.003) 1990 .347 (.015) .014 .002) .171 .019) .232 .027)-.067
(.018) .323 .028) .005 (.003) 1991 .429 (.017) .017 .003) .118 .023) .354 .029) .031 (.021) .002 (.003)Sample size
20,33:J 19,762Notes
to
Table
5: Seunpleincludes
men
aged
18-62with
earnings
inthe
firstinterview,
interviewed
forthe third time
in 1982 or later, andwho
reported
6-20years
ofschooling
atthe
third
interview.Coefficients
incolumns
1-3 areestimates from
aregression
of logdaily wages
on cjuarterlyperiod effects,
work-in-Israel dummies,
years
ofschooling,
potential experience quadratic,
dummies
for
Gaza
residence,
dummies
forresidence
in arefugee
camp, anddummies
forurban residence.
Coefficients
incolumns
4-6 arefrom
the
same
specification,
replacing the dependent
variable with the
change
in logdaily wages
from
thethird to the first interview,
andadding changes
inwork-in-Israel dummies
to thelist of
regressors.
The
potential
experience quadratic
isevaluated
atthe
mean
of
experience and experience-squared. Columns
4 and 6 arealternative estimates
of
the same
work-in-Israel coefficients.
Columns
5and
7report the change
inwork-in-Israel
andschooling coefficients.
Sample
notweighted by
CBSsampling
weight.
Four
out of 9 ofthe
alternative
estimates
of 5,were
significantly
60 "S o
5
to a e>o « N • m it m u « o •H u •Hu
a Xi u 10 •a m 3 01 •n C o a 00 c 0) -^1 IdCO
1 0) Id rH 1 E 3 "^ 0) r-( 0) O.N <J\ (u 10 (D u 0) c00 -H r-l m + u ^•^ \o Id t^ r^ 0) IT) m i-H u „-m^ 1 Id VO 1n
01 •-m-i-t >i c Id 0) in 0) Id E 3 0) I-t 01^
(a a (0 Id cm
rH n + u f^ VO Id rx 1 <-lm
n i-i u <Mk 1 IdiHn
01 ^w .H >i in o> T* Tf 00 rH^
U1n
in VO~
O
O
00 It) VO en*
r-lo
o
in1^ rHm
inn
VO PI CO CM inCN^
VO CMO >*(Ti inVOO H
r-(iHo
r^ «* -H VO0>O
VO 00in CN I-tiH VO VOo
o
t
00 VO t~m
rH CM I-t . 00 CO^
i-lvon
I-t 00o
r~ ff> «* 00 00VO i~ e^ inn
00in (^ PI • • iHn
• •in^i^ in^
—
in^—
vo^'in
m
CMO
00^
O
O
O
CN 00t«-n o
o
o
m
CN roo
o
o
CN VO CNO
r» CNO
o o
r~ Oi^
00 r- 00 '» t~ CN CN VO 0^ inr- r~(^ • • ino
• • CNO
• •O O
• •t
o» VD PI VOn
in in r-00 VO 00 c^ a> I-to^ CNO
• • CNO
CNo
• •O
O
m
o
CN 00 i-lo
inT
PIn
PI PIO
VO • • I-tVOn
VO • •^
VO[~ «^ r* -^ vO^-- vO>^ vO^-- \D
—
CNPI VO