HAL Id: hal-00317188
https://hal.archives-ouvertes.fr/hal-00317188
Submitted on 1 Jan 2003
HAL is a multi-disciplinary open access
archive for the deposit and dissemination of
sci-entific research documents, whether they are
pub-lished or not. The documents may come from
teaching and research institutions in France or
abroad, or from public or private research centers.
L’archive ouverte pluridisciplinaire HAL, est
destinée au dépôt et à la diffusion de documents
scientifiques de niveau recherche, publiés ou non,
émanant des établissements d’enseignement et de
recherche français ou étrangers, des laboratoires
publics ou privés.
Remote sensing of the proton aurora characteristics
from IMAGE-FUV
D. V. Bisikalo, V. I. Shematovich, J.-C. Gérard, M. Meurant, S. B. Mende, H.
U. Frey
To cite this version:
D. V. Bisikalo, V. I. Shematovich, J.-C. Gérard, M. Meurant, S. B. Mende, et al.. Remote sensing
of the proton aurora characteristics from IMAGE-FUV. Annales Geophysicae, European Geosciences
Union, 2003, 21 (11), pp.2165-2173. �hal-00317188�
Annales
Geophysicae
Remote sensing of the proton aurora characteristics from
IMAGE-FUV
D. V. Bisikalo1, V. I. Shematovich1, J.-C. G´erard2, M. Meurant2, S. B. Mende3, and H. U. Frey3 1Institute of Astronomy, RAS, Moscow, Russia
2LPAP, Universit´e de Li`ege, Belgium
3SSL, University of California, Berkeley, CA, USA
Received: 27 May 2002 – Revised: 2 April 2003 – Accepted: 17 April 2003
Abstract. The combination of simultaneous global images
of the north polar region obtained with the IMAGE-FUV imaging system makes it possible to globally map the proper-ties of the electron and proton auroral precipitation. The SI12 imager, which observes the Doppler-shifted Lyman-α emis-sion, provides a global snapshot of the proton aurora every 2 min. These images may be combined with those from the Wide-band Imaging Camera (WIC), to remotely characterize the proton precipitation in proton-dominated auroral struc-tures frequently observed in the afternoon and pre-midnight sectors at the equatorial edge of the auroral oval. It is shown that both the proton energy flux and the mean energy deter-mined by this method are in good agreement with coincident in situ measurement from low altitude satellites carrying pro-ton detectors, when taking into account the different spatial resolution of the two types of observations. Four proton-dominated cases are illustrated in this study. They belong to two categories of proton auroral features: (i) hydrogen arcs known to occur in the evening sector equatorward of the electron oval and (ii) detached proton arcs observed with IMAGE-FUV in the afternoon sector following changes in orientation of the interplanetary magnetic field. They are characterized by a proton flux of 0.5–2 mW m−2and a mean energy in the range 10–17 keV.
Key words. Magnetospheric physics (auroral phenomena;
energetic particles, precipitating; magnetopause, cusp, arid boundary layers)
1 Introduction
A major objective of the Far Ultra Violet instrument (FUV) on board the Imager for Magnetopause-to-Aurora Global Ex-ploration (IMAGE) mission is the observation of the global distribution of the electron and proton auroras in parallel with large-scale changes in the magnetosphere (Burch et al., Correspondence to: J.-C. G´erard
(JC.Gerard@ulg.ac.be)
2001; Mende et al., 2001). An important feature of the Far Ultraviolet imager is its capability to simultaneously image the aurora in three wavelength regions (Mende et al., 2000). The imagers obtain snapshots of the north polar region ap-proximately every 2 min: (i) the Wideband Imaging Cam-era (WIC) in the N2 Lyman-Birge-Hopfield (LBH) bands
in the passband 140–180 nm; (ii) a Spectrographic Imager (SI12) sensitive to the Doppler-shifted Ly-α emission around 121.8 nm; and (iii) a Spectrographic Imager (SI13), with a passband of ∼5 nm centered on the 135.6 nm OI doublet in-cluding some N2 LBH contribution. The integration period
to construct the images is ∼10 s for WIC and ∼5 s for the SI imagers.
FUV auroral emissions can be excited either by precipi-tating electrons and/or protons (Strickland et al., 1993; Hu-bert et al., 2001), with the exception of the hydrogen lines which are solely excited by energetic protons. As protons penetrate into the atmosphere, they are progressively slowed down by elastic and inelastic collisions with major neutral constituents. During some of these collisions, the proton captures an electron, leaving a fraction of the fast hydrogen atoms excited in the upper state of the Ly-α transition. Since the fast hydrogen atoms keep the energy of the protons on charge exchange, they bear the signature of the proton char-acteristics before the electron stripping collision. As the hy-drogen atoms move away (toward) from the observer, a pho-ton is emitted with a Doppler shift to the red (blue) side of the unshifted line center. The observed line profile is the result of the integration of the contributions of all velocity vectors projected on the line of sight. Other auroral emissions con-tain no direct information about the identity of the exciting particle-electron, proton or hydrogen atom. Nevertheless, an analysis of the emission from hydrogen atoms, together with secondary electron-induced emissions of oxygen and nitro-gen can be used to derive information about the precipitating protons.
Observations of proton aurora Balmer lines (Hα, Hβ)
made from the ground (Meinel, 1951; Eather, 1967; Wiens and Vallance-Jones, 1969; Vallance-Jones et al., 1982;
2166 D. V. Bisikalo et al.: Remote sensing of the proton aurora characteristics 0 10 20 30 40 50 Energy (keV) 0 2 4 6 8 10 12 Ly-α (kR)
Fig. 1. Variation of the Ly-α emission rate for a unit (1mW/m2) incident proton energy flux as a function of the mean initial energy of the protons. The curve was calculated for a kappa energy distri-bution and a nadir observation from outside the atmosphere.
Lorentzen et al., 1998; Synnes, 1998; Deehr and Lum-merzheim, 2001; Lummerzheim and Galand, 2001; Taka-hashi and Fukunishi, 2001, and references therein) were very useful in specifying the characteristics and morphology of proton precipitation. In situ rocket measurements related to proton aurora studies were also obtained (Miller and Shep-herd, 1969; Reasoner et al., 1968; Soraas et al., 1974). Ober-vations of auroral Ly-α emission from space was reported by Ishimoto et al. (1989).
Global proton precipitation patterns have been statistically described as a function of the Kp geomagnetic index based
on several years of ion energy spectra measurements by the Defense Meteorological Satellite Program (DMSP) satellites (Hardy et al., 1989). They indicate that the maximum energy flux occurs in C-shaped regions symmetric about a merid-ian running pre-noon to pre-midnight. In comparison to the DMSP statistical electron precipitation data (Hardy et al., 1985), the statistical proton oval is displaced equatorward of the electron oval in the afternoon and pre-midnight sec-tors, although some overlap is frequently observed. The re-sulting pattern of FUV emission was modeled by Hubert et al. (2001). They showed that the Ly-α emission presents a spatial distribution resembling that of the flux of proton pre-cipitation. However, the energy dependence of the efficiency of the emission introduces a nonlinear relationship between the energy flux and the resulting Ly-α emission rate. They also indicated that the ratio of the Ly-α to the N2LBH bands
becomes a less reliable indicator of the fraction of the pro-ton precipitation when the fraction of energetic electrons in-creases in the auroral beam.
Earlier studies of the morphology and dynamics of the proton aurora with SI12 images (Immel et al., 2002; Burch et al., 2002) have revealed the presence of detached subau-roral proton arcs in the afternoon and dusk sectors of the Northern Hemisphere under changing interplanetary mag-netic field (IMF) conditions. Time series of proton aurora
images have shown that when IMF Bz changes from
nega-tive to posinega-tive or when Byrotates from negative to positive,
the auroral oval contracts, leaving a separation of several de-grees between the latitude of the oval position and the sub-oval proton arc in the afternoon sector. Comparisons with measurements from particle detectors have shown that de-tached hydrogen arcs are excited by precipitation of protons with higher energies than the main auroral oval. Regions of detached proton precipitation had been observed in situ by Sanchez et al. (1993) and Gvozdevsky et al. (1997). The development of detached subauroral proton arcs in the af-ternoon and dusk sectors of the Northern Hemisphere under changing IMF conditions observed by IMAGE (Burch et al., 2002; Immel et al., 2002) appears consistent with these fea-tures. In the case of subauroral proton precipitation, a shift between the peaks of the SI12 and WIC signals is clearly ob-served, indicating a spatial separation between precipitating electrons and protons.
Forward modeling of Ly-α emission and the SI12 count rate produced at the magnetic footprint of proton precip-itation measured in situ has been reported by G´erard et al. (2001) and Burch et al. (2002). Comparison with the Ly-α emission extracted along the satellite track from SI12 images showed good agreement with the peak value at the center of the proton arc (G´erard et al., 2001), although the latitudinally integrated brightness may underestimate the observations by up to a factor of 2. Coumans et al. (2002) have shown that protons with energies above 30 keV, the upper limit of the DMSP and FAST particle detectors, may play a significant role in the excitation of the equatorward regions of the pro-ton aurora, particularly in the afternoon sector.
In this study, we describe a methodology allowing for the extraction of the parameters of proton precipitation using SI12 and WIC imaging of proton-dominated auroral regions and discuss sources of uncertainties and errors. We show that IMAGE-FUV global imaging may be used to map and re-motely determine proton precipitation flux and characteristic energy values consistent with in situ particle measurements.
2 Model description
The auroral proton Monte Carlo and electron transport codes described by G´erard et al. (2000) and Hubert et al. (2001) are used to calculate the emission rates of Ly-α and N2bands
excited by the interaction of auroral protons with the at-mosphere. Once a proton energy distribution at the top of the atmosphere has been adopted, the model calculates the emerging emission rates excited by the direct proton and H atoms’ impact, combined with the secondary electron popu-lation generated by ionization processes. Figure 1 illustrates the variation of the Ly-α auroral brightness for a nadir ob-servation from a high altitude spacecraft as a function of the proton mean energy. The adopted energy distribution is a kappa function with κ = 3.5 and an isotropic energy flux of 1 mW/m2at the top of the atmosphere. The kappa index was determined by fitting the average proton energy spectra
D. V. Bisikalo et al.: Remote sensing of the proton aurora characteristics 2167 0 10 20 30 40 50 Energy (keV) 0.0 0.5 1.0 1.5 2.0 LBH / Ly-α Figure 1
Fig. 2. Variation of the N2LBH bands/Ly-α intensity ratio as a
function of the mean initial energy of the protons. The curve was calculated for a kappa energy distribution and a nadir observation from outside the atmosphere.
given by Fig. 7 in Hardy et al. (1989) for Kp = 3 at four
different local times (Hubert et al., 2001). A value of 3.5 was adopted, as it provides a reasonably good fit to the data. The drop of the efficiency of the Ly-α excitation is a conse-quence of the increasing competition between excitation into the HI 2-s state and other processes, such as ionization of the target molecules. These values are close to those derived by Strickland et al. (1993) as discussed by G´erard et al. (2000, 2001).
Figure 2 shows the variation of the LBH/Ly-α ratio with the proton mean energy for a proton precipitation with a kappa (κ = 3.5) distribution for a nadir viewing geome-try. The increase of this ratio with the proton energy reflects primarily the drop in the Ly-α efficiency shown in Fig. 1. It also includes the radiative effect of the increasing proton energy, which lowers the altitude of energy deposition be-low ∼120 km. At these altitudes, the short wavelength LBH bands are gradually absorbed by the overlying O2 column
(Germany et al., 1997; Hubert et al., 2001). In this case, the MSIS-90 model atmosphere was used for the same solar and geomagnetic conditions as described in Hubert et al. (2001). These two curves can be combined as discussed below to characterize the precipitation in proton-dominated auroral arcs. For this purpose, the instrument response functions of the SI12 and WIC cameras must be taken into account. They were described by Mende et al. (2000) and G´erard et al. (2001). In-flight observations of hot stars were used to de-termine the absolute sensitivity with an accuracy estimated at 7% for SI12 and 10% for WIC cameras, respectively (Glad-stone et al., 2000). Daily observations of the same star fields provide the correcting factors to account for the time varia-tion of the sensitivity of the individual imagers. Uncertain-ties on excitation cross sections and numerical models are estimated to be on the order of 20%.
The sensitivity of the FUV instrumental efficiency curves to the neutral atmospheric composition was discussed by
14:49.0 14:49.2 14:49.4 14:49.6 14:49.8 14:50.0 UT 2 4 6 8 Energy flux (mW m -2 s -1)
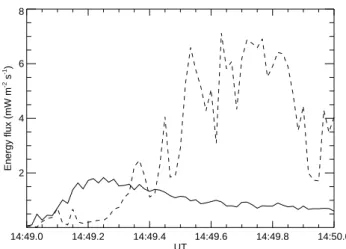
Fig. 3. Energy fluxes of auroral electrons (dashed line) and protons (solid line) measured along the DMSP F15 satellite orbit crossing a detached proton arc and the electron oval on 26 November 2000 at 14:49 UT.
Hubert et al. (2002), Coumans et al. (2002) and Meurant et al. (2003). The semiempirical MSIS-90 model (Hedin, 1991) was used in the transport models to obtain the tem-perature and neutral density profiles. However, composi-tional changes in the aurora (upwellings) can cause a local increase in the N2/O ratio (Hecht et al., 2000). Simulations
have shown that variations of the N2and O2densities result
in minor perturbations of the calculated WIC signal (Hubert et al., 2002). The increase in the O2density enhances the
ab-sorption of the short wavelength LBH emission and slightly decreases the column emission rate. For example, for elec-trons with a mean energy of 4 keV, a doubling of the N2and
O2densities compared to the MSIS density profile produces
a drop in the WIC signal by only 3%. An additional decrease in the O density by a factor of 2 produces a WIC efficiency drop of about 9%. Simulations with the Monte Carlo model also confirm that the SI12 count rate also responds only very moderately to composition changes. For example, for pro-tons with a kappa distribution with Ep = 3 keV, a depletion
of the O density by a factor of 2 compared to the MSIS den-sity profile produces a drop in the SI12 count rate by 10% (Coumans et al., 2002). An additional doubling of the N2and
O2densities results in a total efficiency drop by about 9%.
These perturbations must be considered as upper limits oc-curing in narrowly confined regions of strong auroral precip-itations (Hecht et al., 2000). Since the extent of the WIC and SI point spread functions are on the order of 150 × 150 km2 from spacecraft apogee, this source of uncertainty for the de-termination of the proton characteristics is likely to be small in comparison with the intrumental count noise and model uncertainties.
2168 D. V. Bisikalo et al.: Remote sensing of the proton aurora characteristics 0 10 20 30 40 50 Energy (keV) 10 20 30 40 50 WIC/SI12
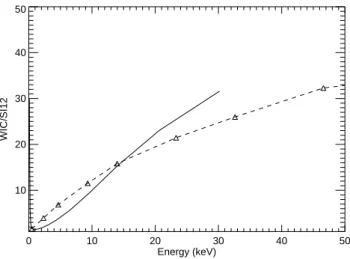
Fig. 4. Dependence of the WIC to SI12 count ratio on the mean proton energy (first efficiency curve). The solid line is for monoen-ergetic proton precipitation and the dashed line with triangles for a kappa-function distribution of the precipitating protons.
3 Determination of the proton flux parameters from FUV observations
An example of the displacement between the proton and electron auroral fluxes sometimes observed equatorward of the main auroral oval in the afternoon sector is illustrated in Fig. 3. It shows the time variation of the energy fluxes of auroral electrons and protons along the DMSP F15 satellite orbit. The spacecraft was moving poleward and successively crossed a proton arc and the main oval on 26 November 2000 between 14:49 and 14:50 UT.
The method applied to derive the proton characteristics from FUV and compare with in situ measurements is de-scribed below.
1. The WIC and SI12 count rates are extracted for the FUV pixel corresponding to the footprint at 120 km of the magnetic field line at the instantaneous DMSP position. To account for the motion of DMSP along its orbit dur-ing the 2 minutes between consecutive snapshots, the count rate from each individual FUV image is extracted along the footprint track of DMSP from the position one minute before to one minute after the central snapshot time. The appropriate FUV pixel from the snapshot is chosen to minimize the difference between the geo-graphic coordinates of the magnetic field line mapped from the DMSP satellite to 120 km and the position of the FUV pixel. The assumption that the proton precipi-tation did not significantly change over the 2-min period is verified by comparing the morphology and count rate observed with SI12 in consecutive images.
2. We assume that, at the maximum of proton precipitation (presumably observed as a maximum of SI12 signal), the dominating contribution to the WIC signal is due to protons and secondary electrons produced by proton
impact, with a negligible contribution from primary au-roral electrons.
3. From the FUV data we determine the minimum WIC/SI12 signal ratio corresponding to the proton-dominated arcs. The Monte Carlo proton and elec-tron auroral codes (G´erard et al., 2000; Hubert et al., 2001) are used to calculate the LBH/Ly-α intensity ra-tio emerging from the atmosphere and observed from a high altitude spacecraft such as IMAGE. This first ef-ficiency curve (Fig. 4) was obtained considering both the contribution of the protons and their secondary elec-trons to the total WIC signal. To estimate the uncertain-ties associated with the shape of the proton energy spec-trum, we have calculated the efficiency curve both for a monoenergetic and for a kappa (κ = 3.5) distribution. Using these efficiency curves and the WIC/SI12 signal ratio we determine the mean energy of the precipitating protons.
4. The mean proton energy can subsequently be used to estimate the value of the SI12 counts rate for the proton flux with this mean energy from the second efficiency curve (Fig. 5). This curve provides the dependence of the calculated SI12 counts on the mean proton energy for a unit flux precipitation of 1 mWm−2. As before,
this efficiency curve was calculated for monoenergetic (see Fig. 2 in G´erard et al., 2001) and kappa distribu-tions. In the monoenergetic case, the increase in the WIC/SI12 ratio at low energies (Fig. 4) stems from the faster drop in the SI12 signal compared to WIC with de-creasing energy. This effect reflects the different energy dependence of the relevant cross sections. Differences in the behavior of the WIC/SI12 curves for monoener-getic and kappa-function cases, as well as the quanti-tatively different behavior of SI12 (see Fig. 5) at low energies can be explained by the presence of a more ergetic tail (particles with energies higher than mean en-ergy) in kappa distributions.
The total energy flux of the auroral protons is obtained by dividing the observed SI12 signal by the calculated effi-ciency of Ly-α value of the signal. It is important to note that these efficiency curves were calculated for downward verti-cal viewing. For actual comparisons of the estimated proton flux parameters with in situ measurements, the view angle from nadir of the observation must be taken into account.
4 Validation of the method
To test the validity of the method of determination of the pro-ton flux parameters from the FUV SI12 and WIC images, comparisons of several in situ measurements were made dur-ing satellite overflights of proton-excited auroral structures.
0 10 20 30 40 50 Energy (keV) 10 20 30 40 SI12 (counts)
Fig. 5. Dependence of the calculated SI12 count rate (counts/pixel over 5 s integration period) on the mean proton energy for a unit (1 mW/m2) incident proton energy flux (second efficiency curve). The solid line is for monoenergetic proton precipitation and the dashed line with triangles for a kappa-function distribution.
Fig. 6. FUV SI12 observation of a proton auroral arc on 26 Novem-ber 2000. A background value of 4 counts was subtracted from the measurements. The vertical error bars correspond to a one-sigma standard deviation of the count rate.
4.1 DMSP satellite
The Defense Meteorological Satellite Program (DMSP) satellites are quasi-polar sun-synchronous satellites at a nom-inal altitude of 830 km with an orbital period of about 100 min. DMSP F15 carries the SSJ/4 auroral particle spec-trometers which measure the electron and ion particle fluxes between 30 eV and 30 keV. The detectors are oriented to-wards the zenith and provide energy spectra of electrons and ions every second in 20 logarithmically spaced energy chan-nels. The DMSP F15 satellite crossed the peak of a proton-excited structure on 26 November 2000, from 14:49:10 to 14:49:24 UT. At the peak of the proton emission, the mag-netic local time (MLT) was 20:35 and the magmag-netic latitude (MLAT) was 65◦. The IMAGE-FUV SI12 observations of this arc are presented in Fig. 6. They were made near
IM-Fig. 7. Ratio of the WIC to SI12 signals for the proton arc observed on 26 November 2000 with IMAGE-FUV.
AGE apogee as the other cases described in this study. The WIC/SI12 signal ratio is shown in Fig. 7. Close inspection of consecutive SI12 images during this period indicate that, in the proton arc sector, the maximum variation was approx-imately 10%. Figure 3 shows that the electrons contributed less than 15% of the total (proton + electron) energy flux at the center of the detached proton arc.
The signal background for WIC and SI12 was taken as 450 analog units (ADUs) and 4 counts, respectively. Following background subtraction, the ratio of WIC/SI12 signals at the peak of the proton flux is equal to 17.4 ± 2. According to the first efficiency curve (Fig. 4), the mean proton energy is esti-mated at 15.8±1.5 keV for monoenergetic and 16.2±1.7 keV for a kappa-function spectrum. The uncertainty given here only includes the propagated error due to the standard vari-ation of the instrumental count rate. These values compare well with the mean proton energy values derived from si-multaneous particle measurements on board DMSP 15 (Ta-ble 1). The values of the calculated SI12 counts per incident unit proton flux for the estimated mean proton energies are derived from the second efficiency curve and are equal to 18 counts for monoenergetic and to 21 counts for a kappa-function cases As may be seen in Fig. 6, the maximum value of the observed SI12 signal is equal to 33 ± 3 counts. Using the ratio of the observed and calculated values of SI12 counts and a view angle of 15◦from nadir for an emission at 120 km,
we finally infer a proton energy flux of 1.83 ± 0.1 mWm−2
and 1.6 ± 0.07 mWm−2for the spectra we considered. These estimates are within 12% of the measured in situ values of the proton energy flux (Fig. 3) which has a peak value of 1.8 mWm−2.
4.2 FAST satellite
Four electrostatic analyzers (ESAs) on board the FAST satel-lite probe all pitch angles in the spacecraft spin plane. The measured energy range is 3 eV to 25 keV for ions (Carlson
2170 D. V. Bisikalo et al.: Remote sensing of the proton aurora characteristics
Table 1. Energy flux and average energy of proton-dominated structures: comparison between IMAGE-FUV and in situ determinations
Date Spectrum E¯ (in situ) E¯ (FUV) Q
0(in situ) Q0(FUV)
keV keV mWm−2 mWm−2 26 nov 2000 (MLAT=65◦; M 15–17 15.8 ± 1.5 1.8 1.8 ± 0.1 MLT=20:35; Kp=3) κ 15–17 16.2 ± 1.7 1.8 1.6 ± 0.07 24 Jun 2000 (MLAT=60◦; M 9–10 10.7± 0.8 1.4 1.2 ± 0.06 MLT=22:00; Kp=4) κ 9–10 9.0 ± 0.9 1.4 1.0 ± 0.04 10 Nov 2000 (MLAT=64.3◦; M 10–11.5 11.4 ± 1.0 0.5 0.6 ± 0.04 MLT=16:36; Kp=4) κ 10–11.5 9.8 ± 1.2 0.5 0.5 ± 0.03 23 Jan 2001 (MLAT=66.2◦; M 15–17 16.4 ± 1.7 0.9 1.0 ± 0.07 MLT=16:29; Kp=3) κ 15–17 17.5 ± 2.1 0.9 0.9 ± 0.05 M – monoenergetic precipitation κ– kappa distribution 00:29.0 00:29.5 00:30.0 00:30.5 00:31.0 00:31.5 UT 0.5 1.0 1.5 2.0 2.5 Energy flux (mW m -2 s -1)
Fig. 8. Energy fluxes of auroral electrons (dashed line) and pro-tons (solid line) along the DMSP F13 satellite orbit while crossing a detached subauroral arc and the main oval on 10 November 2000.
et al., 1998). The spacecraft altitude is close to 4000 km. A measurement is made every second, corresponding to a spa-tial resolution of ∼10 km. FAST satellite orbit 15 226 flew over a proton arc structure (Frey et al., 2001) on 24 June 2000 at 06:17:00 UT (MLAT=60◦and MLT=22:00). The structure was relatively stable with less than 20% variation of the SI12 count rate during the arc crossing.
Following the same procedure as for DMSP, the WIC/SI12 ratio ∼10.9, and accordingly, the mean proton energy can be estimated between 10.7 ± 0.8 keV and 9.0 ± 0.9 keV for the monoenergetic and kappa-function cases, respectively. Starting from an observed SI12 signal of 72 counts and taking the view angle and the resulting brightening into account, the proton energy flux is estimated at 1.2 ±
0.06 mWm−2and 1.0 ± 0.04 mWm−2for the monoenergetic
and kappa-function spectra, respectively. These values are in fairly good agreement with the FAST measurements, giving a peak value of 1.4 mWm−2for the proton energy flux at a mean proton energy of ∼10 keV.
5 Spatial resolution
As discussed before, remote sensing determination of the characteristics of the auroral proton precipitation is essen-tially limited to cases when proton excitation of the N2LBH
bands measured by the WIC imager dominates over the pri-mary electron contribution. These conditions may be verified a priori when direct in situ measurements from a low altitude orbit are available. In other circumstances, both the MLT and MLAT locations and the relative displacement of the regions with high SI12/WIC ratios may be used as criteria, indicating proton-dominated regions.
The spatial resolution of the SI12 imager is much broader than the in situ particle measurements. For observations from IMAGE apogee (geocentric distance of 8.2 RE) it is on the
order of ∼150 km. Therefore, it cannot resolve the fine struc-ture of the proton aurora. The in situ particle flux observa-tions provide a much higher spatial resolution, better than 10 km for the DMSP satellites, allowing for the fine structure of the proton precipitation to be observed. In any case, the charge exchange process broadens the hydrogen emission to greater than 100 km (Deehr and Lummerzheim, 2001), even if the instrumental resolution was perfect. This process re-sults in the spreading of an initially confined beam. Con-sequently, the Ly-α emission is not expected to follow the high-resolution morphology of the proton source. This dilu-tion effect was modelled by Kozelov and Ivanov (1992), who investigated the H+-H beam spreading with a Monte Carlo
model. They showed that the radius of the beam encircling 80% of the energy flux strongly varies with altitude and max-imizes above the altitude of maximum energy deposition. It is typically 100–150 km wide for 1–10 keV protons.
Figure 8 illustrates the rapid changes in the proton pre-cipitation along the DMSP F13 satellite orbit on 10 Novem-ber 2000, crossing a subauroral detached arc at 00:29:30 UT (MLAT = 64.3◦and MLT = 16:36). Figure 9 shows that the
corresponding features of the fine structure are not seen in the SI12 image of this subauroral arc.
We now apply the method to the analysis of the FUV data along this orbit. From the WIC/SI12 ratio of ∼11.8, the mean proton energy can be estimated at 11.4 keV and 9.8 keV for the monoenergetic and kappa-function cases. With an observed SI12 signal of 12 counts and a FUV view angle of 35◦ from vertical, we determine a proton energy flux of
0.56 mWm−2and 0.47 mWm−2 for the monoenergetic and kappa-function spectra, respectively. These values are sig-nificantly less than the peak value of 2.25 mWm−2 of the observed in situ proton energy flux. The reason for this dis-agreement lies in the different spatial resolution of the FUV and DMSP measurements. If the DMSP flux data is aver-aged over 30 s, corresponding to the SI12 effective resolu-tion (Coumans et al., 2002), we obtain a value of the pro-ton energy flux of 0.53 mWm−2 and a mean energy ¯E =
10−11.5 keV. This time corresponds to a latitudinal variation of 1–2◦of magnetic latitude. Consequently, if the different resolutions between the calculated and measured parameters of the precipitating protons are accounted for, the measured average energy and fluxes are in very good agreement.
A similar fine structure was observed in a detached subau-roral arc on 23 January 2001 at 23:25:00 UT (MLAT=66.2◦ and MLT=16:29). The calculated values of the proton energy flux are 0.98 mWm−2 and 0.86 mWm−2 for the monoener-getic and kappa-function cases. The DMSP F13 satellite measurements give a peak value of 2.78 mWm−2, but once
averaged over ∼30 s the value is reduced to 0.9 mWm−2.
Application of the method described before gives a mean proton energy of 16.4 keV and 17.5 keV for the monoener-getic and kappa-function cases. The average DMSP energy is equal to ¯E =15 − 17 keV. In this case the comparison of the measured and calculated proton energy flux parameters also shows good agreement.
The occurence and characteristics of the subauroral de-tached proton arcs was discussed by Immel et al. (2002) and Burch et al. (2002). The DMSP overflight of 23 January 2001 followed a brightening of the dusk sector proton au-rora and a separation of the equatorward portion returning to a low value, following a By reversal from negative to
posi-tive. Immel et al. (2002) used FAST particle data obtained in the Southern Hemisphere to infer that the arc was exclusively excited by proton precipitation. Assuming a mean proton en-ergy of 20 keV, they inferred a proton flux of 1.2 mWm−2, in reasonably close agreement with our value of 0.9 mWm−2.
Fig. 9. FUV SI12 observation of a detached subauroral arc on 10 November 2000. The vertical error bars correspond to a one-sigma standard deviation of the count rate.
6 Discussion and conclusions
One of the goals of the FUV imaging system on board the IMAGE satellite is to remotely evaluate the parameters of the precipitating auroral protons and electrons. Spectra of the precipitating particles are generally characterized by the shape of their distribution, their mean energy and energy flux in addition to their pitch-angle distribution. Consequently, once a pitch-angle distribution and a functional distribution of the energy spectrum are selected, four unknowns must be determined from three FUV channels. It is generally neces-sary to assume the value of one of the parameters or to use some additional information (e.g. ground-based observations of auroral HI Balmer emission; in situ measurements of par-ticle fluxes; data from neutral atom imagers, etc.). For the two specific cases of a pure proton or electron aurora, the number of unknowns is less than the number of FUV sig-nals and, it is therefore possible to fully characterize the flux parameters once the shape is assumed to be known. It was shown in this study that this method allows one to correctly estimate the main two parameters of the proton precipitation in proton-dominated arcs.
To model and extract the data from IMAGE, we use kappa-functions with an upper boundary at 120 keV. The highest energies measured by the DMSP and FAST detectors are 30 and 25.2 keV, respectively. The mean proton energies and energy fluxes derived from in situ measurements may thus be underestimated due to the possible presence of electrons and mostly protons exceeding these limits (Coumans et al., 2002). Nevertheless, the comparisons presented in this study are reasonable, since the mean proton energies derived from FUV are substantially less than the detectors’ upper limits (Table 1).
As mentioned before, it was assumed that the proton pre-cipitation dominates over the electron component on the ba-sis of the observed WIC/SI12 ratio. Instead, if primary elec-trons also contribute to the WIC signal, the WIC/SI12 ratio
2172 D. V. Bisikalo et al.: Remote sensing of the proton aurora characteristics will be higher than for a pure proton-induced auroral
emis-sion. Figure 4 indicates that neglecting the electron contribu-tion will therefore lead to an overestimate of the mean pro-ton energy and a subsequent overestimate of the precipitated proton energy flux (Fig. 5). As an example, we take a proton arc characterized by a WIC/SI12 ratio of 12 and compare the proton flux and energy with a mixed proton-electron feature, where WIC/SI12 = 15, that is where 20% of the WIC signal is due to the presence of electrons. In the pure proton case, we derive for a kappa distribution a mean proton energy of 9.7 keV, to be compared with 13 keV (15% overstimate) in the electron-contaminated case. The energy flux is overesti-mated by 16% due to the presence of electrons in the auroral beam. For monoenergetic precipitation, the mean energy is overestimated by 17% and the flux by 18%.
Another important limitation of the method is the spatial resolution of the IMAGE SI12 camera. This limited spa-tial resolution does not allow one to infer the fine structure of the proton precipitation but can only provide spatially-averaged values. Application of our method to four cases of proton-dominated structures indicates that the average en-ergy flux is on the order of 0.5–2 mWm−2, with mean ener-gies above ∼10 keV. These values refer to two different cat-egories of proton aurora. One is the extended region located equatorward of the electron oval in the afternoon and pre-midnight sector during quiet and moderate conditions (cases 1 and 2 of Table 1), where the method applies in a straight-forward way. The second category corresponds to the de-tached proton auroral arcs recently discovered with the FUV imagers (cases 3 and 4). In this case, the method must be used with caution as a consequence of the limited FUV spa-tial resolution.
As discussed in Sect. 3, the comparison of the remotely determined proton precipitation characteristics with in situ measurements from a low altitude satellite requires auroral stability over several consecutive FUV images. However, the simultaneity of the WIC (10 s) and SI12 (5 s) snapshots is not a serious limitation for the remote determination of the auroral precipitation at the time of the individual FUV obser-vations.
Acknowledgements. J. C. G´erard is supported by the Belgian Fund for Scientific Research (FNRS). This work was also supported by grant RFBR 02-02-16087 and funded by the PRODEX programme of the European Space Agency (ESA) and the Belgian Fund for for Collective Fundamental Research (FRFC grant 2.4517.02). The IMAGE FUV investigation was funded by NASA through SWRI subcontract number NAS5-96020. We thank C. Carlson at U. C. Berkeley and CDA Web for use of the FAST data. The DMSP par-ticle detectors were designed by Dave Hardy of AFRL, and data obtained from JHU/APL. We thank Dave Hardy, Fred Rich, and Patrick Newell for its use.
Topical Editor D. Murtagh thanks two referees for their help in evaluating this paper.
References
Burch, J. L., Mende, S. B., Mitchell, D. G., Moore, T. E., Pollock, C. J., Reinisch, B. W., Sandel, B. R., Fuselier, S. A., Gallagher, D. L., Green, J. L., Perez, J. D., and Reiff, P. H.: Views of Earth’s Magnetosphere with the IMAGE Satellite, Science, 291, 619– 624, 2001.
Burch, J. L., Lewis, W. S., Immel, T. J., Anderson, P. C., Frey, H., Fuselier, S. A., G´erard, J. C., Mende, S. B., Mitchell, D. G., and Thomsen, M. F.: Interplanetary Magnetic flield control of afternoon sector detached auroral arcs, J. Geophys. Res., 107, 1251, 10.1020/2001JA007554, 2002.
Carlson, C. W., Pfaff, R. F., and Watszin, J. G.: The Fast Auroral SnapshoT (FAST) mission, Geophys. Res. Lett., 25, 2013–2016, 1998.
Coumans V., G´erard, J. C., Hubert, B., and Evans, D. S.: Electron and proton excitation of the FUV aurora : simul-taneous IMAGE and NOAA observations, J. Geophys. Res., 10.1029/2001JA009233, 2002.
Deehr, C. and Lummerzheim, D.: Ground-based observations of hydrogen emission in the auroral substorm, J. Geophys. Res., 106, 33–44, 2001.
Eather, R. H.: Auroral proton precipitation and hydrogen emissions, Rev. Geophys., 5, 207–218, 1967.
Frey, H. U., Mende, S. B., Carlson, C. W., G´erard, J. C., Hubert, B., Spann, J., Gladstone, R. G., and Immel, T. J.: The electron and proton aurora as seen by IMAGE-FUV and FAST, Geophys. Res. Lett., 28, 1135–1138, 2001.
G´erard J.-C., Hubert, B., Bisikalo, D. V., and Shematovich, V. I.: A model of the Lyman-α line profile in the proton aurora, J. Geo-phys. Res., 105, 15 795–15 805, 2000.
G´erard J.-C., Hubert, B., Meurant, M., Shematovich, V. I., Bisikalo, D. V., Frey, H. U., Mende, S. B., Gladstone, G. R., and Carlson, C. W.: Observation of the proton aurora with IMAGE FUV im-ager and simultaneous ion flux in situ measurements, J. Geophys. Res., 106, 28 939–28 948, 2001.
Germany, G. A., Parks, G. K., Brittnacher, M., Cumnock, J., Lum-merzheim, D., Spann, J. F., Chen, L., Richards, P. G., and Rich, F. J.: Remote determination of auroral energy characteristics dur-ing substorm activity, Geophys. Res. Lett., 24, 995–998, 1997. Gladstone, R. G., Mende, S., Frey, H., Geller, S., Immel, T.,
Lamp-ton, M., Spann, J., G´erard, J. C., Habraken, S., Renotte, E., Ja-mar, C., Rochus, P., and Lauche, H.: Stellar calibration of the WIC and SI imagers and the GEO photometer on IMAGE/FUV, EOS, Trans. AGU, 81(48), Fall Meet. Suppl., Abstract SM72A-06, 2000.
Gvozdevsky, B. B., Sergeev, V. A., and Mursula, K.: Long lasting energetic proton precipitation in the inner magnetosphere after substorms, J. Geophys. Res., 102, 24 333–24 338, 1997. Hardy, D. A., Gussenhoven, M. S., and Holeman, E.: A
statisti-cal model of auroral electron precipitation, J. Geophys. Res., 90, 4229–4248, 1985.
Hardy, D. A., Gussenhoven, M. S., and Brautigam, D.: A statistical model of auroral ion precipitation, J. Geophys. Res., 94, 370– 392, 1989.
Hedin, A. E.: Extension of the MSIS thermosphere model into the middle and lower atmosphere, J. Geophys. Res., 96, 1159–1172, 1991.
Hecht, J. H., McKenzie, D. L., Christensen, A. B., Strickland, D. J., Thayer, J. P., and Watermann, J.: Simultaneous observations of lower thermospheric composition change during moderate au-roral activity from Kangerlussuaq and Narsarsuaq, Greenland, J.
Geophys. Res., 105, 27 109–27 118, 2000.
Hubert B., G´erard, J.-C., Shematovich, V. I., Bisikalo, D. V. and Solomon, S. C.: The role of proton precipitation in the excitation of the auroral FUV emissions, J. Geophys. Res., 106, 21 475– 21 494, 2001.
Hubert B., G´erard, J. C., Evans, D. S., Meurant, M., Mende, S. B., Frey, H. U., and Immel, T. J.: Total electron and proton energy input during auroral substorms: Remote sensing with IMAGE-FUV, J. Geophys. Res., 107, 10.1029/2001JA009229, 2002. Immel, T. J., Mende, S. B., Frey, H. U., Peticolas, L. M., Carlson,
C. W., G´erard, J. C., Hubert, B., Fuselier, S., and Burch, J. L.: Precipitation of auroral protons in detached arcs, Geophys. Res. Lett., 29, 10.1029/2001GL03847, 2002.
Ishimoto, M., Meng, C. I., Romick, G. R., and Huffman, R. E.: Doppler shift of auroral Lyman α observed from a satellite, Geo-phys. Res. Lett., 16, 143–146, 1989.
Kozelov, B. V. and Ivanov, V. E.: Monte-Carlo calculation of proton-hydrogen atom transport in N2, Planet. Space Sci., 40,
1503–1511, 1992.
Lorentzen, D. A., Sigernes, F., and Deehr, C. S.: Modeling and observations of dayside auroral hydrogen emission Doppler pro-files, J. Geophys. Res., 103, 17 479–17 488, 1998.
Lummerzheim, D. and Galand, M.: The profile of the hydrogen Hβ emission line in proton aurora, J. Geophys. Res., 106, 23–31, 2001.
Meinel, A. B.: Doppler-shifted auroral hydrogen emission, Astro-phys. J., 113, 50–61, 1951.
Mende, S. B., Heetderks, H., Frey, H. U., Lampton, M., Geller, S. P., Habraken, S., Renotte, E., Jamar, C., Rochus, P., Spann, J., Fuselier, S. A., G´erard, J.-C., Gladstone, R., Murphree, S., and Cogger, L.: Far Ultraviolet Imaging from the IMAGE spacecraft. 1. System Design., Space Science Reviews, 91, 243–270, 2000. Mende, S. B., Frey, H. U., Lampton, M., G´erard, J. C., Hubert, B.,
Fuselier, S., Gladstone, G. R., and Burch, J. L.: Global obser-vations of proton and electron auroras in a substorm, Geophys. Res. Lett., 28, 1139–1142, 2001.
Meurant, M., G´erard, J. C., Hubert, B., Coumans, V., Shema-tovich, V. I., Bisikalo, D. V., Evans, D. S., Gladstone, G.R., and Mende, S. B.: Characterization of the auroral electron pre-cipitation energy during substorms from the IMAGE-FUV im-agers and application, J. Geophys. Res., 108(A6), 1247, doi: 10.1029/2002JA009685, 2003.
Miller, J. R. and Shepherd, G. G.: Rocket measurements of Hβ production in a hydrogen aurora, J. Geophys. Res., 74, 4987– 5003, 1969.
Reasoner, D. L., Eather, R. H., and O’Brien, B. J.: Detection of al-pha particles in auroral phenomena, J. Geophys. Res., 73, 4185– 4198, 1968.
Sanchez, E. R., Mauk, B. H., Newell, P. T., and Meng, C.-I.: Low-altitude observation of the evolution of substorm injection boundary, J. Geophys. Res., 98, 5815–5838, 1993.
Soraas, F., Lindalen, H. R., Maseide, K., Egeland, A., Sten, T. A., and Evans, D. S.: Proton precipitation and the Hβ emission in a postbreakup auroral glow, J. Geophys. Res., 79, 1851–1859, 1974.
Strickland, D. J., Daniell Jr., R. E., Jasperse, J. R. and Basu, B.: Transport-theoretic model for the electron-proton-hydrogen atom aurora, 2, Model results, J. Geophys. Res., 98, 21 533– 21 548, 1993.
Synnes, S. A., Soraas, F., and Hansen, J. P.: Monte-Carlo simula-tions of proton aurora, J. Atmos. Sol. Terr. Phys., 60, 1695–1705, 1998.
Takahashi, Y. and Fukunishi, H. : The dynamics of the proton au-rora in auau-roral breakup events, J. Geophys. Res., 106, 45–63, 2001.
Vallance-Jones, A., Creutzberg, F., Gattinger, R. L., and Harris, F. R.: Auroral studies with a chain of meridian-scanning pho-tometers, 1, Observations of proton and electron aurora in mag-netospheric substorms, J. Geophys. Res., 87, 4489–4503, 1982. Wiens, R. H. and Vallance-Jones, A.: Studies of auroral hydrogen
emissions in West Central Canada, III. Proton and electron auro-ral ovals, Can. J. Phys., 47, 1493–1502, 1969.