HAL Id: hal-01176630
https://hal.archives-ouvertes.fr/hal-01176630
Preprint submitted on 16 Jul 2015
HAL is a multi-disciplinary open access
archive for the deposit and dissemination of
sci-entific research documents, whether they are
pub-lished or not. The documents may come from
teaching and research institutions in France or
abroad, or from public or private research centers.
L’archive ouverte pluridisciplinaire HAL, est
destinée au dépôt et à la diffusion de documents
scientifiques de niveau recherche, publiés ou non,
émanant des établissements d’enseignement et de
recherche français ou étrangers, des laboratoires
publics ou privés.
An ’expert approach’ to enhance GIS training: the case
study of land-use suitability mapping
R Balzarini, P-A Davoine
To cite this version:
R Balzarini, P-A Davoine. An ’expert approach’ to enhance GIS training: the case study of land-use
suitability mapping. 2015. �hal-01176630�
1
An ‘expert approach’ to enhance GIS training: the case study
of land-use suitability mapping
R. Balzarini,*,and P-A.Davoine**Laboratoire d'Informatique de Grenoble, 681 rue de la Passerelle 38400 Saint Martin d'Hères, France
{Raffaella.Balzarini,Paule-Annick.Davoine}@imag.fr
Abstract. To enhance the learning and teaching of geographic information systems in
higher-education Earth sciences, we present results from a research which identified the strategies and concepts that underlie the suitability-mapping process. The analysis of common practices in mapping and GIS environmental projects led our attention to a particular kind of mapping: GIS-bases land-use suitability mapping, with multi cri-teria spatial analysis method. This method has a professionalizing nature since it sup-ports the debate on territorial choices that involve decision making. Indeed, from a pedagogical point of view, this method, allows a progressive and comprehensive ap-proach to the use of GIS. Based on the expert-novice continuum apap-proach, this study focuses on two dimensions: a cognitive dimension, which explores and compares the way of thinking of experienced and novice users when solving site location problems with GIS; and on an instructional dimension, which identifies and integrate the expert methods in the resolution strategies of learners.
Keywords: suitability mapping, cognitive processes, expert-novice continuum,
quan-titative-based qualitative data analysis, educational scaffolding.
1.
Introduction
Deal with environmental issues and renewal of technology and knowledge, geosciences professions have been changing their practices including new technologies and new profi-ciencies of geomatics sciences. The use of Geographic Information Systems (GIS) is the most significant example of these changes.
Once standardized and integrated into information systems, geological knowledge process converges to the decision making. The geologist must know how to design a model and how to make it comprehensible for policy makers, who often are not non-specialists. Meet the needs of the decision maker leads the geologist to open up to new skills in GIS as the the integration of new data sources or the processing of different analytical methods. In the geosciences, geographic information systems are especially useful in two areas: digitization and suitability-vulnerability mapping.
The GIS development in geosciences is now undeniable, whether it is from the standpoint of professional activities or from the point of view of required competences. It clearly ap-pears that the acquisition of GIS know-how which is essential to the field of geosciences must be handled by a comprehensive training.
From an educational point of view, our approach is based on a case study. To limit the scope of our study, it was necessary to perform an analysis of the practices of mapping and GIS in the areas of Geosciences and Environmental Engineering. It was also necessary to make relevant choices in a professional, educational and societal perspective. For these reasons we choose land-use suitability mapping because this method involves a progressive and comprehensive approach to the use of GIS, it has a professionalizing nature, as it is
2
common practice in environmental projects. Finally, it supports the debate on territorial choices that involve decision making.Our purpose is to examine which cognitive processes underlie the visual thinking, strate-gies, and cartographic skills required by multi criteria spatial analysis (MCSA) tasks [18]. Our purpose is also to examine how the cognitive processes evolve in going from a novice to an expert. Understanding the transition from novice to expert is a prerequisite for devel-oping effective learning environments for students at all levels [24].
This research is based on a quantitative-based qualitative approach to analyzing verbal data. The main goal is to understand how to represent the knowledge used in the pertinent cogni-tive processes. In quantifying the qualitacogni-tive data, the researcher searches the data for pat-terns and trends and then categorizes these according to codes or concept indicators [9]. In this paper we first present the cognitive dimension linked to our case study, the method-ology adopted to design experiments ; then we show the preliminary results and the didacti-cal scaffolding that help students acquire expertise in suitability mapping.
2.
Expert-novice continuum: some cognitive models
The cognitive sciences have a rich research tradition that has examined expertise across a variety of fields, compared the characteristics of experts and novices, and considered how expertise is acquired. Abstract thinking skills, problem-solving strategies, storage and recall of a wide array of information, and ability to work flexibly within a domain of knowledge all exemplify what it means to be an expert [24].
We rely on MacEachren’s map schemata as structures for representing and organizing con-cepts that link together cognitive processing of map-derived information, the roles of knowledge, experience, practice, and training on the part of map readers [17]. There are significant differences in schemata available to domain specialist versus novices, so apply-ing appropriate schemata requires learnapply-ing and practice [17].
In a map-reading task where the map corresponds to a known landscape, experts might be expected to encode it not just as separate “chunks,” but within an overall template that incorporates the relationships between the groups of objects viewed [15]. For the experi-enced map reader, an extensive vocabulary exists that defines and labels complex entities [17].
Specifically, experts may be (1) focusing on the distinctive features of a display to establish how it may differ from the norm, (2) identifying what is familiar and typical and that there-fore requires minimal processing, and (3) spatial-feature matching either the geometric or symbolic information on the map with geographic-feature matching in the landscape being represented [7]. Another main strategy for approaching spatial-problem solving was high-lighted by Crampton [17]: experts used active self-analysis and error-prevention with pro-gressive repetition to focus in on a solution.
The study of expertise can be used to improve instruction to develop the visualization skills and schemas necessary for parsing complex spatial information.
3.
Case study: semantics and cognition in suitability mapping
Making suitability maps implies applying a cognitive process that involves the representa-tion, interpretarepresenta-tion, and (mathematical) treatment of geographic data and requires a deep knowledge of GIS.
Land-use-suitability problems are often solved with multi-criteria spatial analysis (MCSA) methods. These methods combine various criteria to obtain a map that indicates areas that are more or less apt to solve a location problem. The decision analyst must make various choices that lead to a host of cartographic issues: the standardization method for each crite-rion, criterion layers, decision rules, and weights for relative importance [18].
3
The process of making suitability maps involves overcoming conceptual obstacles, which we summarize here.We first consider the mathematical procedures (i.e., the GIS-MCSA approaches), including weighted summation and Boolean operations. These are easy to implement within the GIS environment by using map-algebra operations and cartographic modeling. The principle of the method is also easy to understand and intuitively appealing to decision makers. Howev-er, GIS implementations of the weighted-summation procedures are often used without a full understanding of the assumptions underlying this approach. In addition, the method is often applied without complete insight into the meanings of two critical elements of the weighted-summation model: the weights assigned to attribute maps and the procedures for deriving commensurate attribute maps [19].
For perceptual organization and categorization related to functional-representation concepts of map syntactic, we rely on Tversky and Hemenay’s basic-level‘s categories theory [26]. These basic-level categories, including events as well as objects, are categories for which we can form a single image. Categorization is strongly linked to data classification for choropleth maps [17]. The map resulting from MCSA is a choropleth: it displays quantities (plethos) relative to areas (Khore) via a graduated color scale. There are both mathematical and graphical issues to solve when making choropleth maps. Implementing such a map depends primarily on the choice of discretization method; that is, how to divide the statisti-cal series to map into classes or intervals [3]. In this map, all map units falling into a partic-ular category are depicted with identical symbols; this perspective is based on the ac-ceptance that, in classical categories, any element must be as representative of the category as any other element. The cartographic concept of a choropleth map is based on the classi-cal theory of categorization being “correct.” The understanding derived from choropleth maps depends on how categories are interpreted by users [17].
To interpret and use suitability maps, we rely on Marr’s visual map processing [20] and MacEachren’s perceptual organization, categorization, and judgment [17]. Human vision is good at extracting shapes from a visual scene, assessing depths and relative size, and notic-ing movement. A key feature is that the visual system should emphasize contrast more than absolute illumination and higher acuity for color hues than for color value. Thus color value and saturation can be ordered whereas hue cannot. A second key is the system’s ability to group the elements that neurological image processing renders into “objects.”
Continuing in terms of interpretation, another feature of land-use-suitability mapping is that it must be “checked” repeatedly throughout the process: its validity is determined by its correlation with the representation of the actual terrain. Indeed, suitability maps are often superimposed (draped) over base maps, 3D model of terrain, virtual globes, or maps with administrative boundaries. Our study is particularly concerned with superpositions with relief, which are created by shading on DEM. Their interpretation and reading is then linked to the perception of depth of a two-dimensional (2D) or three-dimensional (3D) scene: for that we rely on the taxonomy of depth cues provided by Kraak [16] and particu-larly on the “pictorial” cues that are related to the object’s structure and the way the struc-ture organizes visual input. By using shading and/or color and shadow, many cartographers create an effective plan-view relief representation that suggests depth in a non-perspective approach.
One last specific characteristic of suitability maps concerns their use for decision making. As Jankowski and Nyerges showed [10], maps play only a limited support role in various stages of the decision process and a reduction of cognitive complexity is needed.
These theoretical aspects are treated in our approach, which strives to highlight the key differences between experts and novices in interpreting a suitability map.
4
4.
Methodology
4.1. Goals of current study
Conceptualization and visualization of suitability maps involves a complex interaction of skills and mental schemas. The purpose of this study is to assess the mental schemas that underlie the suitability-mapping resolution process. Schema is a hierarchical knowledge structure that includes declarative knowledge of objects, facts, strategies, constraints and procedural operators for solving the problem [22].
Specifically, our study addresses one main question: what operations and concepts are used by experts and students when solving suitability-map problems?
To compare expert and novice performance, we state on Chi’s definition [22]: “expertise can be understood from an information-processing perspective by focusing on the role of knowledge, its content, and the cognitive processes that bring that knowledge to bear dur-ing problem solvdur-ing”. We rely on Chi’s relative methods approach [10]. This relative ap-proach involves comparing more- to less-experienced participants and assumes that exper-tise is a level of proficiency that novices can achieve. The advantage of this approach is that it can uncover the structures and processes of performing the task, and not merely the ways that experts can excel. The goal is to understand how we can enable a less skilled or experi-enced persons to become more skilled since the assumption is that expertise can be attained by a majority of students.
4.2. Experimental protocol
In order to bring answers to our research question, we built up an experimental protocol which included:
1. The design of a GIS learning sequence. To favor authentic learning [21], students were asked to solve a typical site-location problem and work in genuine professional situations. They had to perform a feasibility study and locate suitable sites for a ski re-sort in the southern French Alps. The GIS approach used to solve the problem is based on multi-criteria methods and requires tools for spatial analysis. More precisely, it in-volves analyzing environmental criteria, making surface analysis calculations, data conversion, reclassifying data and creating suitability models. Fig. 1 shows the global solving problem approach.
MCSA Processing Mapping Solution Fig. 1 A comprehensive approach to the ski resort site- location problem.
The learning sequence took 17 hours and was divided into five sessions of three hours and one session of two hours over a period of two weeks. In order to limit the amount of data collected from the observations of subjects’ resolution strategies, we selected some particu-lar activities. For all the resolution process applied to the site location problem, we retained four fundamental tasks:
5
T0 = Data standardization and classificationT1 = Weighted Sum T2= Map Analysis T3= Site Choice
These tasks have been chosen based on the preliminary analysis of Balzarini’s MCSA activity survey [2] and on literature indicators [6], [19] which show that, for the entire resolution process, these 4 tasks are conceptually and strategically more complex. The design team included two researchers, observers, and two teachers, student tutors. 2. The participants. We conducted our survey with two third-year-undergraduate student
populations, each well distinct and composed of GIS and MCSA novices. 15 students were majoring in geosciences (i.e., geologists); 50 were engineers specializing in environmental science. The students worked in groups; we analyzed three groups of geologists and three groups of engineers.
We decided to observe the group activity for two main reasons: 1) group work is supported by the principles of active learning, (Problmem-Based Learning) that we adopted to design the learning sequence; 2) in the specific case of the decision making , « groups enrich solu-tion processes, since they will typically explore a wider range of alternatives and entertain alternative hypotheses more often than individual decision-makers, and make interpersonal requests for explanations, which then leads to co-construction of knowledge» [1]. When different criteria are used and different weights are allocated, choices have to be negotiated among the group members . The group's interactions reflect the reasoning strategies or misconceptions underlying these choices [1].
Three specialists participated in the experiment as experts: a geophysicist, a cartographer, and a GIS engineer. The geophysicist has long been interested in integrating GIS in Geoscience, as a tool for research support and professional tool for consulting. His critical and investigative approach brings a scientific approach to the use of GIS in environmental issues. The cartographer is specialized in topography, spatial imaging, photogrammetry, remote sensing, and perfectly mastered ArcGIS. The GIS engineer manages GIS project, has a considerable mastery of geographic information and spatial analysis capabilities of ArcGIS, that she adapts to multiple projects. None of the three experts was a specialist in MCSA: we were interested in their problem-solving approach.
They were questioned individually at their work place and were asked to complete a prede-signed activity (“contrived tasks”) [24]. The approach used by an expert to perform a task gives invaluable insight into how experts reason. Both the experts and the students were given the same suitability map task.
The analysis of the novice groups and individual expert’s activities should allow us to identify the elements that characterize reasoning. These elements can be associated with mental structures, schemes. We can get 'collective' schemes, from reasoning groups, which are comparable among groups. Concurrently, ‘individual’ schemes, from experiments with experts, may represent reference strategies for novices.
3. The data collection. To understand how an apprentice learns a trade, one possibility is to observe the learner in context. We collected three types of data from the main 4 tasks of the learning sequence and from the expert’s contrived task:
verbal data: students’ verbal interactions during key moments of decision making (audio and video records) and experts’ “thinking-aloud” protocols (video records); three open-ended questionnairessubmitted to students at three crucial moments of the
resolution process and to the experts at the end of their contrived task. They allow to collect knowledge just after the action. The collection was individual to have a wide responses panel. The direct purpose of the questionnaires was to highlight general themes, responses families, representative of conceptual contents mobilized by the subjects.
productions: maps made by students or experts. Maps’ quality was assessed on the basis of an evaluation grid after indications of Cauvin [8] on perception, reading and
6
the map construction rules. The objective of this analysis was to outline correlations between solving strategies and success (or not) suitability map.4. The material. The GIS used was ArcGIS 10.0. Recorders and cameras were used to record subjects’ activities. Questionnaires were Word file.
5.
Analysis and main Results
5.1 Verbal data
For each expert, we analyzed three hours of recordings; for each of the six student groups we analyzed 2.5 hours of recordings.
Our approach relies on Chi’s method of quantifying a qualitative analysis of verbal data [9]. Verbal analysis is a methodology for quantifying the subjective or qualitative coding of the contents of verbal utterances. Instead of representing the ideal knowledge, the goal of the method here is to attempt to figure out what a learner knows (on the basis of what a learner says, does, or manifests in some way, such as pointing or gesturing) and how that knowledge influences the way the learner reasons and solves problems, whether correctly or incorrectly. In our case study, knowledge was represented over the practical application of spatial analysis concepts and cartographic design.
The method of coding and analyzing verbal data consists of the following main steps: 1. Reduce or sample the protocols, that is, reduce data by selecting a particular activity; 2. Segment the reduced or sampled protocols;
3. Develop or choose a coding scheme (taxonomic categories scheme); 4. Operationalize evidence in the coded protocols;
5. Depict the mapped formalism;
6. Seek pattern(s) in the mapped formalism; 7. Interpret the pattern(s) and its (their) validity; 8. Create interrater reliability.
We present hereafter as we have adapted these instructions to our survey.
Once the corpus to be coded was decided, we then had to segment the verbal utterances to identify the unit of analysis. The defining cut can occur at many points, revealing units of varying granularity, such as a proposition, a sentence, an idea, an interchange as in conver-sational dialogue, or an episode. In the segment protocols we searched for verbatim, tags or keywords, such as “mountain” or “valley”, “ski resorts” or “names of localities”, “green, red” “threshold %” and so on, in order to to form semantic groups which design conceptual categories.
The coding scheme we developed is a taxonomic categories scheme. The units of analysis are organized on a taxonomy founded on the characterization of tasks, actions, operations, and conceptual objects: tasks (see Fig. 2) are divided into actions, each action is character-ized by one or more operations, and each operation is charactercharacter-ized by one or more concep-tual objects. Each element of the taxonomy is defined as follows:
- task: main steps in procedures [11];
- action: rules in decision-making procedures [11];
- operation: is a map algebraic operation which accepts one or more variables as input and generates a single variable as output. In this case, the variables involved are not merely numbers but layers [25];
- controls – of errors - : identifying an inappropriate choice from an ensemble of com-peting options. Detecting an error means that the performer has perceived some unde-sirable consequence of his or her action [23];
- object: describe the temporary grouping of a collection of visual features together with other links to verbal-propositional information. [14].
7
Fig.2. The taxonomic scheme
We developed our formalism in an interactive bottom-up and top-down process: categories were derived from the subjects’ explanations and interactions and were enhanced by some theoretical background.
An excerpt of segmentation of the units of analysis in the corpus is shown in Fig.3. Action 1 has one operation (1.1) and one object (A1), action 2 has two operations (2.1 and 2.2), operation 2.1 has an object (A1), and operation 2.2 has three objects (A1, R1, G1).
8
Qualitative analysis of verbal data led us toa taxonomic categories scheme, composed by. ActionsAll the actions stemming from solution processes for experts and students were indexed. In all, 30 actions were identified; each characterized by one or more operations. Control op-erations were of particular interest to us, so we present them briefly below.
Control operations
We categorized control errors based on Ohlsson’s Theory of Learning from Error: “suitabil-ity mapping is a sequential-choice task characterized by sequential“suitabil-ity, multiplic“suitabil-ity, and effect orientation. Sequentiality means that the solution to the task requires a sequence of relatively discrete actions. Multiplicity means that each action occurs in the context of an ensemble of competing option. The relevant actions are effect oriented. What does it mean to commit an error in a sequential-choice task? It is an action that is not on the path to the intended goal. This action is inappropriate or useless in a specific context and it involves environmental effects, called error signal. Since knowledge guides the action, to correct an error is to improve future performance by revising the faulty knowledge structure.” [23]. We summarize hereunder the three control-error categories that we defined:
1. Verification: operations that validate or anticipate a choice; for example, by comparing the same zone on several maps or different zones that have the same type of terrain, or by verifying the algebraic results in the legend. Some examples of quote are “I sum the two, that way that in 2 will be the good one” [e1].
2. Diagnostic: operations that lead to recognition of sources of error; for example, the inappropriate use of a function or a request, the inappropriate definition of the thresh-old of classes, or the incorrect attribution of weighting to the criteria. Some examples of quotes are “I made a mistake when I wrote … wait, I’ll do it one more time. I put pa-rentheses around the expression … I don’t remember if it’s AND or OR” [e1].
3. Correction: operations allowing intervention to correct the error; for example, by modi-fying the function, the expression, the order of the classes, or the hierarchy of the crite-ria. Some examples of quotes are “I remain persuaded that we have to redo the classi-fication from 1 to 9 for each, because we’re not working on the same values” [e3]. Objects
We established a set of codes that fit a taxonomic categories scheme specific to land-use suitable mapping.
Our taxonomy is composed of five categories, each representing a conceptual object. Each object is defined by descriptors (sub-categories) that are assigned a code. Specifically: 1. The algebraic object, which encompasses all the verbal elements pertinent for
render-ing the Geographic Information data in mathematical form. This object has six de-scriptors. An example of quotes for the Thresholds descriptor is “What scale for the classes, I don’t remember any more … 1, 2, 3? I’ll make a hierarchy” [e1].
2. The color object, which encompasses all the verbal elements related to the variable of visual color. This object has five variations. An example of quotes for the Contrast de-scriptors is“Which map is the clearest? There it’s the clearest, a lot of blue jumps out, the other is more fuzzy but there is less blue” [e3].
3. The orographic object, which encompasses all the verbal elements related to the geo-morphological description of the terrain. This object has five variations. An example of quotes for the Specialized nomenclature descriptor is “I don’t think it would be good to cross a red zone, that means you’re crossing a talweg; a valley” [g3].
4. The geographic-feature object, which encompasses all the expressions related to the geographic elements of the region being analyzed. This object has six variations. An example of quotes for Drainage network descriptor is “Because you’re next to water there, you can put in pumps” [g5].
9
5. The analyzed-suitable areas object, which encompasses all the expressions related to observing one or more zones with the goal of evaluating capability. This evaluation consists of six types of observations. An example of quotes for the observation which demands more information is “There we’re on quite a few green zones, it’s hard, we’d have to make a mask again with higher-value zones and then compare with the screen slope and the protected areas” [e1].The full taxonomic scheme of the conceptual objects is presented in Table1.
10
Quantitative analysis of verbal data led us to seek pattern(s) in the mapped formalism. The quantitative analysis included counting the instances of objects, control operations, and actions based on presence, absence, recurrence, or comparison between experts and stu-dents. A synthesis of the instances for experts, geologist students and engineer students is presented in Fig.4.Fig. 4. Summary of variable instances for the four main tasks.
As an example of our quantitative approach, we comment in detail the first task, where data are standardized and classified (T0). We find in general that the experts use more actions and objects than the students. For example, the action of exclusion by thresholds (T01), which corresponds to creating masks and selecting which data to treat (chunking theory), is used by all three experts but by none of the students (T01Experts = 5 occurrences and T01Students = 0 occurrences). See Fig. 5.
11
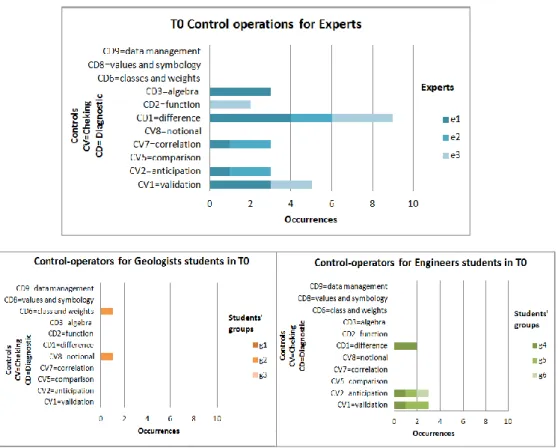
In addition, control operations (and in particular those of verification and diagnostic, CV = 11 and CD = 14, respectively) undertaken at this point by the experts are more important than those undertaken by the students (CExperts = 37, CGeologists = 4, and CEngineers = 12 for the engineers). See Fig. 6.Fig. 6. Occurrences of T0 control operations for experts and for students.
Thus, the experts put controls in place very early in the problem-solving process. In this phase of data preparation, the experts use more objects than do the students; in particular the algebraic object (AEx = 45, AGeol = 11, AEng = 39) and the geographic object (GEx = 9, GGeol = 0, GEng = 3). See Fig. 7.
12
In the phase where weights and weighted sums are allocated for the criteria (T1), the stu-dents undertake more control operations than the experts because they spend more time correcting mistakes.In T2, we find that the experts use visual-effect tools to improve the analysis (zoom, trans-parence) (T22 Experts = 2, T22students = 0). They also use control actions such as verifica-tion with the relief and detecverifica-tion of threshold effects. These acverifica-tions are less used by the students.
In T3, one or more sites are chosen by the experts with respect to controls. The choice is based especially on the addition of information and the detection of know zones (T32Experts = 3 and T32 students = 1).
In order to create an interrater reliability two coders worked on the data (the first author of this paper and an independent coder), each making a complete analysis of the data. Each disagreement between the coders was considered and reanalyzed in the segment protocol. The rate of agreement between the coders was 87.8%.
By way of conclusion for the verbal analysis, the Chi’s quantitative-based qualitative ap-proach [9] allowed us to identify some components of mental schemas (particularly objects and operations) undertaken by the experts and students when solving a suitability land-use problem. However, to go further in profiling the resolution strategies, we needed to analyze the quality of the suitability maps made by the experts and the students.
5.2 Quality map analysis
The aim of this analysis is to validate a map, wich means to evaluate the responses given to the requests, to identify the qualities it has and compare them with the qualities being asked to have. In our case study, it is to assess whether the suitability map allows making decisions (advocating a site for ski ressort).
The analysis of suitability maps made by experts and students is based on an assessment grid for semiotic qualities. The evaluation grid was designed from the instructions of Cauvin [5]. The qualities of a map can be classified into two broad categories:
- the “core“ ones, which are more related to the construction of the map: adequacy for its intended purpose, simplicity, accuracy, reliability;
- the “graphics“ ones, which are more related to the perception of the map: readability, selectivity, aesthetics [5].
All the quality criteria listed above have been judged according to a so-called categorical scaling method [5]. Staggering for our evaluation was from 0 to 3, respectively, from the lack of criterion (0) to the clearly identified criterion (3). The assessment grids were used for 3 maps made by the experts and 6 maps made by the students’ groups, and they were completed by three examiners, experts in the field, a geomatics researcher, a research pro-fessor in geography and a cartographer engineer. The final score is the sum of the notes given by examiners; based on the scores obtained, a ranking could be established.The ma-ximum score that a map could get was 63 (7 criteria x 3 value of score x 3 examiners). Table 2 shows 3maps: the best, the average and the worst ones, from maps’ evaluation. The three maps represent the same content as they provide a response to the ski resort location problem. Expert (e2) obtained the maximal score: his map meets the criteria of readability, selectivity and aesthetics in an almost optimal evaluation (notes 2/3 or 3/3). Reliability criteria and accuracy have received lower notes (1/3). This bears out precautions taken by the expert who said he needed more information to finalize his results. The map made by students ‘group (g2) received the lower score: this map is is totally unreadable, it does not meet any aesthetic criteria and it is unusable.
13
Table 2. Samples from maps’ evaluation.
User Total score Maps
Expert (e2) 47/63 Engineer’s group (g4) 31/63 Geologist’s group (g2)° 2/63
By way of conclusion for the map quality analysis, the categorical scaling method allowed us to classify the maps according to their level of success. The interest now is to associate the map qualities with the solving processes we have identified through the components of reasoning.
6. Discussion on problem-solving strategies for land-use suitability
mapping
The association between the map quality and the cognitive components is an indication of causes and effects about strategies carried out. It is, for example, to observe that one group who carried out a good suitability good map has mobilized some elements of cognitive process, and another group who carried out an unusable map has mobilized other cognitive elements.
Looking for differences and similarities in the occurrences of cognitive components helps to draw, the outline of 'winning' or 'failing' solving strategies. 'Winning' strategies
Site
sélec-tionné
14
correspond to the sequence of actions and operations that lead to the realization of a suitability map supporting decision-making.The objective here is to discuss how the mobilized cognitive elements lead relevant results or not.
The analysis of the experts’ activity showed that they develop their procedures for land-use suitability mapping according to the main paradigms of multi-criteria spatial analysis methods, as prescribed by the specialized literature [19].
However, three approaches which are not specifically mentioned in the specialized literature MCSA, emerge from the analysis of behavior. These are: 1) an initial qualitative analysis of the problem, the utilization of heuristics ("rules of thumb") 2) excluding ‘useless' data in the early stages of the resolution process in order to create “masks“(Action T01 in our case study) 3) activating error checks operations (verification, diagnosis, correction) throughout the procedure.
From a “Goal, Situation, Action“ perspective [23] the map is the result of a series of actions and choices (process) carried out in response to a spatial problem. Two experts have implemented procedures, choices, activated patterns whose outcome was a proper and useful cartographic solution. These strategies called 'winning' show in two of the three experts as among certain groups of students, procedures which led to usable suitability maps. 'Winning' strategies may constitute a kind of framework for modeling learning situa-tions that help students to evolve their cognitive schemas.
In summary of the analysis of the experts’ activity during the land-use suitability mapping, we recognize some fundamental cognitive traits, specific to expertise, and synthesized by Petcovic and Libarkin [24] from the works of Bransford [4] Hmelo-Silver [12] and Chi. [8], namely:
- categorization of the problem
- recognition of patterns in information due to familiarity with subject - knowledge that is interrelated (called"chunking")
- skills in metacognition, the ability to self-monitor understanding and make deci-sions based on what is and is not understood (back-tracking strategies)
- flexible thought processes
The analysis of maps quality and reasoning processes in students shows that the two pro-files (geologists and engineers) differ from approaches expert essentially on two points: nor geologists neither engineers do their multi-criteria analysis starting with setting the validity thresholds of the problem, they do not reduce data or make masks; they mobilize, in general, very few control operations during the procedure.
However, between the two groups, engineers typically show attitudes closer to experts’ approaches.
We observed that the engineers groups get to break the problem, even if the granularity level is not the same as that observed in expert. They carry out many mathematical objects, because it seems that all their reflection requires mathematization: eg, criteria are discussed and treated on mathematical issues (values and thresholds) and rarely on thematic issues (features, relevance, justification, correlations with other criteria). Also, they rely on a 'trial and error' process: they check out many actions because they are unable to define the initial requirements of the problem [23]. Especially during the phases of weighted sums and map visual analysis, they review the requirements of the situation that were poorly defined at the beginning of the procedure.For engineering students the mobilization of many different conceptual objects resulted in suitability maps whose quality is quite satisfactory: among the three maps presented by the three groups of engineers, map (g6) obtained a high quality assessment, close to those of the first two experts.
The analysis of geologist students’ activity shows overall fewer actions on the entire proce-dure than engineer students.Particularly in the initial phase of the problem categorozation, where experts analyze every possible condition of the problem, geologist students focus on the definition of a predominant criterion (altitude or slope). Then they build their entire analysis around this predominant criterion. In the initial phase of the problem they activate
15
very few control operations. The consequence of this shortcoming is that they lying around errors and inconsistencies in the successive phases.The large number of controls made during the weighted sums and visual analysis phases can be explained by the presence of errors resulting from the inappropriate definition of the problem. Paradoxically, it is in the last phase, the site choice, that geologist students activa-te the largest number of occurrences of conceptual objects. They seem to unlock all the strategies (thematic, mathematics and visual) in order to provide a final answer to the prob-lem. Despite this, two of the three maps produced by geologist students led to disappointing results.
In general, the identification of gaps in different subjects provides a better understand of how and where certain errors have occurred. Conversely, the identification of common patterns in successful procedures, whether in actions, controls or conceptual objects, validates, at least summarily, invariants, inferences and rules necessary to a successful resolution of the problem.
7. Conclusion
The preliminary results of our study reveal the differences in strategies (i.e., the series of actions and operations) employed by experts and by students and track the paths taken to solve the problem. We extract from our data a model consisting of five categories of con-ceptual objects required to solve the problem. Finally, we proposed a model consisting of three categories of control operations. The differences between experts and novices are thus described at the level of concepts, operations, and controls.
The field of GIS education should consider how expertise is related to teaching and learn-ing. Some operations or methods of execution as well as concepts that experts use and that may be absent in the strategies that students use suggest that a different type of pedagogical scaffolding should be provided. We suggest the following exemples:
methodological scaffolding which essentially aims to develop skills in the use of algebraic concepts. Examples of practices could be to define problem condition and create raster mask as “partitioning”, to make extensive work on classification methods of spatial data: more time should be devoted to test different methods, changes in thresholds should be displayed on the map and a criterion (optional) should be classified with all methods to discuss validity and limits;
thematic scaffolding which essentially aims to provide rules and notions of semiotics in cartography (use of colors). One way to make students aware of the importance of semiotic rules would be to ask them to assess the quality of some maps realized by other students, according to an evaluation grid. Discrepancies in the assessments would open the discussion about the importance and the impact of semiotic on knowledge. Thus students should try to make location site decisions with maps of poor quality. strategic scaffolding which aims to suggest controlling for conflicts, errors, or
anoma-lies (threshold effect). One of the main educational challenge is how to stimulate control operations in students. One specific suggestion is to create a exchange situation of map production at the key stages of the procedure (eg, reclassification, weighting, aggregation). "Working with data made by others" should encourage students not only to carefully control the ranking methods, the classes’ thresholds, etc, but also to argue, discuss and negotiate any changes.
technical scaffolding which aims to master visual-effect tools and to enhance visual analysis through the use of orographic and geographic concepts (relief, transparency,) in GIS. Recognition of geomorphology can be improved by the use of virtual globes such as Google Earth or ArcGlobe proposed by ArcGIS. The realistic imaging and visualization tools (zoom, flight simulator ..) provided by virtual globes are now an in-dispensable asset to confirm (or not) the results of spatial analysis.
16
We are currently testing some of these scaffoldings. In conclusion, strategies that help stu-dents acquire expertise in problem solving require explicitly teaching expert strategies, using of real-world problems, and organizing collaborative groups to encourage metacogni-tion [24].References
1. Armstrong, M. P et Densham, P. J.: Cartographic support for locational problem‐solving by groups. International Journal of Geographical Information Science, 22:7,721-749, (2008) 2. Balzarini, R., Davoine, P-A., Ney, M. GIS in Geosciences Training: an experience in
peda-gogical-engineering. In Proceedings of International Cartographic Conference, Paris, (2011) 3. Béguin, M, Pumain, D. : La représentation des données géographiques. Armand Colin, Paris
(2007)
4. Bransford, J.D., et Al. editors: How People Learn: Brain, Mind, Experience, and School. National Research Council, National Academy Press, Washington, D.C. (2000)
5. Cauvin, C.: Cartographie thématique. Hermès Science Publications, (2007)
6. Chakhar, S. «Cartographie décisionnelle multicritère : formalisation et implémentation ». These. LAMSADE, Paris- Dauphine, (2006)
7. Chang KT, Lenzen T, Antes J The effect of experience on reading topographic relief infor-mation: analyses of performance and eye movements. The Cartographic Journal, 22:88–94, (1985)
8. Chi, M.T.H. Categorization and Representation Physics Problems by Experts and Novices. Cognitive Science 5, 121-152, (1981)
9. Chi, T.H.M.: Quantifying Qualitative Analyses of Verbal Data: A Practical Guide. The Journal of the Learning Sciences 6(3):271–315, (1997)
10. Chi, T.H.M.: Two Approaches to the Study of Experts ‘Characteristics. In K.A. Ericsson, N. Charness, P. Feltovich, & R. Hoffman (Eds.), Cambridge Handbook of Expertise and Expert Performance. (pp. 121-30), Cambridge University Press. (2006)
11. Eastman, J.R.: Idrisi for Windows, Version 2.0: Tutorial Exercises, Graduate School of Ge-ography—Clark University, Worcester, MA. (1997)
12. Hmelo-Silver, C.E.: Problem-based learning: What and how do students learn? Educational Psychology Review, 16:235–266, (2004)
13. Jankowski, P., Nyerges, T.: GIS-supported collaborative decision making: results of an ex-periment. Annals of the Association of American Geographer 91(1):48–70, (2001)
14. Kahneman, D., Triesman, A., Gibbs, B. J.: The reviewing of object files: Object specific in-tegration of information. Cognitive Psychology, 24, 175-219, (1992)
15. Kent, R., Chang, P.: Expertise in a Map Reading Task: The Role of Schemas in the Proces-sing of Topographical Relief Information. Proceedings of the 30th Annual Meeting of the
Cognitive Science Society, Washington (2008)
16. Kraak, M.J.: Computer-assisted cartographical Three-Dimensional Imaging Techniques. Delft: Delft University Press (1988)
17. MacEachren AM How maps work: representation visualization and design. New York: Guilford Press (1995)
18. Malzcewski, J.: GIS-based land-use suitability: a critical overview. Progress in Planning, 62:3–65, (2004)
19. Malzcewski, J.: GIS-based multi criteria decision analysis: a survey of the literature. Inter-national Journal of Geographic Information Science, 20(7): 703–726, (2006)
20. Marr, D.: Vision: The philosophy and the approach. Issues in Cognitive Modeling. London: Erlbaum (1985),
21. Newell, A., Simon, H.A.: Human problem solving. Englewood Cliffs, NJ: Prentice Hall (1972)
22. Nokes, T., Schunn, C., Chi, M.T.H. : Problem solving and human expertise. In P. Peterson, E. Baker, & B. McGaw (Eds.), International Encyclopedia of Education (3rd Edition) (pp. 265-272). Oxford: Elsevier (2010)
23.
Ohlsson, S.: Learning from Performance Errors. Psychological Review, 241–262, (1996) 24. Petcovic, H.L., Libarkin, J.C.: Research in Science Education: The Expert-Novice17
25. Tomlin, C.D. :Map algebra: one perspective. Landscape and Urban Planning 30 3-I 2, (1994)
26. Tversky, B., Hemeway, K.: Objects, parts and categories. Journal of Experimental Psychol-ogy: General, 113(2), 169-191, (1984)