HAL Id: hal-02761956
https://hal.inrae.fr/hal-02761956
Submitted on 4 Jun 2020HAL is a multi-disciplinary open access archive for the deposit and dissemination of sci-entific research documents, whether they are pub-lished or not. The documents may come from teaching and research institutions in France or abroad, or from public or private research centers.
L’archive ouverte pluridisciplinaire HAL, est destinée au dépôt et à la diffusion de documents scientifiques de niveau recherche, publiés ou non, émanant des établissements d’enseignement et de recherche français ou étrangers, des laboratoires publics ou privés.
Rainfall distribution modelling on a 3-D plant
architecture: application to banana tree
Celine Bassette, François Bussière
To cite this version:
Celine Bassette, François Bussière. Rainfall distribution modelling on a 3-D plant architecture: ap-plication to banana tree. 4. International workshop on functional-structural plants models, Jun 2004, Montpellier, France. �hal-02761956�
Rainfall distribution modelling on a 3-D plant architecture: Application to
banana tree
C. Bassette, F. Bussière
Institut National de Recherche Agronomique, Unité Agropédoclimatiqe, Duclos 97 170 Petit-Bourg, Guadeloupe FWI
([email protected]; [email protected])
Introduction
Because of rainfall interception by plants, rainfall distribution is greatly modified at the soil surface inducing pollution risks by leaching of agrochemicals. Historically, studies on rainfall interception modelling did not deal with these heterogeneous processes.
Rainfall interception models were developed to evaluate interception losses in large forests using either empirical (Helvey and Patric, 1965) or analytical approaches (Gash, 1979) and did not account for spatial distribution of plant organs. In the last decade, many studies were devoted to 3-D models in order to simulate plant architecture and functioning. Models were used to simulate plant growth (Godin et al., 1999; Prunsinkiewicz et al., 1997) and plant development as controlled by climatic variables (Fournier and Andrieu, 1999; Lewis, 1999). In order to model interactions with plant microenvironment and substance transfers within plants, geometrical or spatial representation into voxels were used to simulate plant organs and a topological approach was developed to account for organ connections (Godin, 1999). Recently, three dimensional (3-D) rainfall interception modelling became necessary to predict pollution risks due to the leaching of agrochemicals on the plant canopy or at the soil surface (Bussière et al., 2002) and to study disease propagation within the canopy during rainfall interception (Saint-Jean et al., 2003).
The DROP model was developed to simulate water flows on the plant and to predict location of preferential pathways using geometrical and topological information on the plant, obtained from 3-D digitizing (Bussière et al., 2002). DROP was applied to banana trees as pollution risks were particularly high in banana plantations. The aim of this paper was to present the model and its evaluation, then to discuss the effect of the plant architecture on water distribution below the plant, by simulating plant development and interactions with other plants.
Description of the DROP model
The DROP (Distribution of Rainfall On Plant) model, comprising two modules, simulated water flows on a plant. The first module DROP-TRI provided the 3-D representation of the plant as a set of triangles from digitized data and the second module, DROP-INT, simulated rainfall interception and transfers on these triangles according to leaf properties and plant topology. The model provided a 2-D map of water distribution below the plant at the soil surface. Initially applied to maize, it was adapted to banana trees that presented more complex leaf shapes.
The plant architecture description
The 3-D coordinates of the plant were recorded using an ultra sonic digitizer GP8-3D (Science Accessory Corporation. Stratford, CT, USA) (Moulia and Sinoquet, 1993). In order to simulate leaves as sets of triangles, points of the leaf outlines were recorded on both edges of the limb and on the midrib.
The DROP-TRI module created the triangles by projecting the points of each edge of the limbs on the midrib. The two series of points on the edges and their projections on the midrib determined two sets of triangle. Because of the shape of banana leaves, specific procedures were developed to account for the ends and tears of the limb. (Bassette and Bussière, 2004).
C. Bassette et al.
SESSION 4–ORAL PRESENTATIONS 160
The simulation of water flows within the canopy
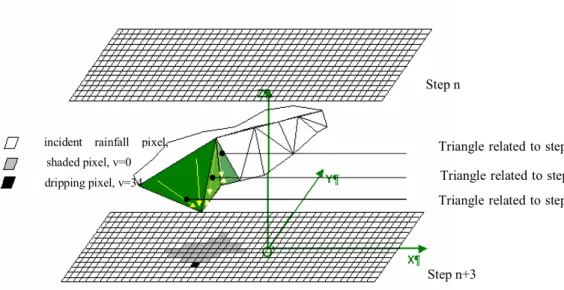
Water flows on a leaf were simulated as transfers between triangles according to the topology and the height of their lowest summit. When water flowed to the lowest point of a set of connected triangles, it dripped down to another leaf or to the soil. Rainfall and drippings were assumed to fall vertically. A discretized grid of water volumes was used to simulate rainfall interception and transmission (Figure 1). Leaves were projected vertically onto the grid. Incident rainfall was represented above the plant by the grid of pixels (v=1) that was sequentially updated below each triangle. The values of all the pixels intercepting water on a triangle were added to the value of the pixel related to its lower summit (v=34) and were set to zero (v=0). The rainfall interception algorithm consisted in applying these rules from the highest to the lowest leaf triangle. The grid at the last step represented the distribution of rainfall and the canopy projection at the soil surface. The model can be set to provide a 2-D map of water distributions that could directly be compared with experiments.
Experiments
In order to evaluate the model, experiments were performed using potted banana trees under a rainfall simulator (Deltalab, Voreppe, France). Plant structures were recorded by 3-D digitization. The 2-D water distribution below the plant was recorded using a horizontal grid of juxtaposed collectors and a ring collector for stemflow. Water volumes were measured by weighing each collector.
Results and Discussion
Plant architecture and leaf area simulation
The DROP-TRI model provided a qualitatively good representation of the plant architecture (Figure 2) and predicted area of complex shape of leaf correctly (homogeneous and torn leaves) as shown in Figure 3.
Step n
incident rainfall pixel, shaded pixel, v=0 dripping pixel, v=34
Step n+3
Triangle related to step Triangle related to step Triangle related to step
Figure 1 : Rules of water flows between triangles and simulation of water transfers as changes in the discretized grid.
Simulation of the 3-D distribution of water flows
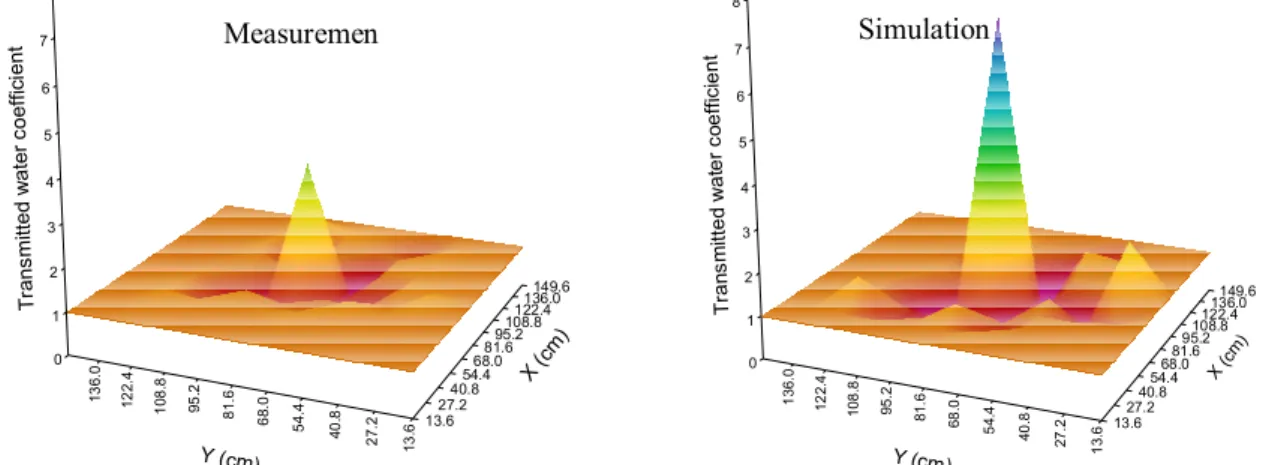
We compared simulations and measurements for 9 banana trees on grids of collectors of 13.6 × 13.6 cm each (i.e. 1233 collectors). The model provided reasonable results as the Pearson test between simulation and measurement gave a correlation coefficient of 0.863. However simulated transmission coefficients were overestimated by a mean factor of 1.57.
Figure 4 presented for a single plant, the comparison between simulated and measured maps of transmitted water coefficients. Transmitted water coefficients greater and less than 1 defined a dripping and shaded area respectively. The model predicted the location of most dripping and shaded areas well. The overestimation of transmission coefficients could be partly due to the weak modelling of interception features like splash, storage and evaporation, not yet included in DROP-INT.
Effect of leaf area and mutual masking of leaves on water distribution
The effect of plant development on the distribution of rainfall below the plant was evaluated by simulating 5 successive stages of leaf apparition: 4, 5, 7, 9 and 10 leaves. The leaf area index (LAI) was evaluated at each stage for a soil surface of 5.52 m² that corresponded to normal field plant density. Either stemflow or maximum dripping increased with plant growth as a 75% increase of LAI induced a 65% and a 63.8% increase of stemflow and maximum dripping respectively (Table 1). The maximum dripping coefficient remained the same for LAI of 0.13, 0.2 and 0.24, inducing that this dripping point was not affected by leaves above leaf 7. However the stemflow increased exponentially with LAI as all the leaves contributed to it.
Figure 2: Comparison of the architecture of a banana tree. (a) Plant picture during digitising, (b) rendered with the Pov-Ray® software after triangulation by DROP-TRI.
Figure 3: Simulated Leaf Area (LAs) as a function of Measured LA (LAm) for 9 banana trees. First bisectrix: dashed line. Regression: continuous line. 1:1 y = 1.0101x + 4.3573 R2 = 0.9468 n=72 0 500 1000 1500 2000 2500 3000 3500 4000 0 1000 2000 3000 4000 LAm (cm²) LA s (c m ²) Homogeneous leaves Torn leaves ( ) b) ( 0 1 2 3 4 5 6 7 8 13.627.2 40.854.4 68.081.6 95.2108.8 122.4136.0 149.6 13 .6 27. 2 40 .8 54 .4 68 .0 81. 6 95. 2 108 .8 12 2. 4 1 36. 0 T ra ns mi tt e d w a te r co e ff ic ie n t X (c m) Y (cm) 0 1 2 3 4 5 6 7 8 13.627.2 40.854.4 68.081.6 95.2108.8 122.4136.0 149.6 13 .6 27 .2 40 .8 54 .4 68 .0 81 .6 95 .2 10 8. 8 12 2. 4 13 6. 0 T ra ns m itt ed w at er c oe ffi ci en t X (c m) Y (cm)
Figure 4: Comparison of measured and simulated transmitted water coefficients below a banana tree.
C. Bassette et al.
SESSION 4–ORAL PRESENTATIONS 162
Table 1: Architectural and rainfall parameters for a banana tree according to leaf apparition.
Simulation Measurement
LAI 0.06 0.08 0.13 0.2 0.24 0.23
Number of leaves 4 5 7 9 10 10
Total leaf surface (m²) 0.33 0.43 0.71 1.12 1.32 1.27 Intercepting surfaces
(m²)
0.29 0.39 0.55 0.8 0.91 ___ Stemflow coefficient 5.07 6.21 7.21 11.6 14.83 9.3
Dripping max coefficient 1.26 1.68 3.48 3.48 3.48 1.83
Effect of plant interactions on water distribution
The model was used to simulate the effect of a neighbouring banana tree (Bana2, LAI=1.8), on the water distribution below another banana tree (Bana1,LAI=1.7)). Transmitted water coefficients were evaluated on a 8.16 m² grid of 20 × 20 cm cells below Bana1 alone (Figure 5a) and below Bana1 affected by Bana2 (Figure 5b). 23.3% and 25.2% of Bana1 leaf area were protected from rainfall in case (a) and (b) respectively.
Interactions with another banana tree led to a modification of water distribution under Bana1 (260<y<400). Leaf 8 of Bana1 was masked by Bana2 inducing a 2.5% decrease of Bana1 leaf area intercepting water area and a 1.6% increase of shaded area under Bana1. This produced 18.25% and 13.23% decreases of the mean transmitted water coefficient for the whole intercepting area and for intercepting area below Bana1. In both cases, 14 drippings points were observed under Bana1. However, the most important dripping point of Bana1 (3.58 at X=220 and Y=380, Figure 5a) disappeared as it was masked by the leaf of Bana2 and the stemflow of Bana2 took place on an area previously protected by Bana1 (7.95 at X=220 and Y=400, Figure 5b).
Conclusion
We presented the DROP model simulating plant architecture as well as spatial and quantitative distributions of rainfall. It was used to assess the effect of leaf apparition and a neighbouring plant on the rainfall distribution below banana trees. Comparison with measurements showed that the model was suitable for 3-D plant representation and predicted reasonably well dripping locations and water volumes below the plants. Rainfall distribution strongly depended on plant architecture as leaf apparition and mutual masking within the foliage both affected rainfall distribution below the plants.
Figure 5: Vertical projection of two banana trees (Bana1 and Bana2) on a grid of collectors simulated by DROP and 3-D distribution of water below Bana1. (a) Bana1 alone. (b) Bana1 with interaction of Bana2.
-1 0 1 2 3 4 5 6 7 8 9 10 11 12 140160 180200 220240 260280 300320 340360 80 100 120 140 16 0 180 20 0 220 240 260 280 30 0 320 340 36 0 380 T ra ns m itt e d w a te r co e ffi ci e nt X ( cm ) Y (cm) -1 0 1 2 3 4 5 6 7 8 9 10 11 12 140160 180200 220240 260280 300320 340360 80 10 0 12 0 14 0 16 0 18 0 20 0 22 0 24 0 26 0 28 0 30 0 32 0 34 0 36 0 38 0 T ra ns m itt ed w at er c oe ffi ci en t X (c m) Y (cm) (b) Bana2 Bana1 (a) Bana1 Leaf 8
Although the specific triangulation developed for banana trees was accurate, stemflow and drippings were systematically overestimated by the model. Recent experiments have shown that splash and storage greatly varied according to drop diameter, drop kinetic energy and leaf inclination. These processes must be considered in the canopy because of multiple inclinations of the limb surfaces and various interceptions related to incident rainfall and the origins of drippings into the foliage. Thus, introducing in DROP-INT these actual interception processes according to drop parameters and leaf inclinations should improve model accuracy. Although data resulting from 3-D digitizing were used as inputs of the DROP model, other sources of geometrical data could be used for modelling of rainfall interception by plants.
References
Bassette, C. and Bussière, F., 2004. A detailed 3D modelling of the banana architecture: sensitivity analysis for the simulation of canopy and rainfall interception parameters. Agricultural and Forest Meteorology(submitted).
Bussière, F., Solmon, F. and Fouéré, A., 2002. Implementation and evaluation of DROP, a model for the simulation of rainfall distribution below plants described in 3D. Agronomie, 22: 93-103. Fournier, C. and Andrieu, B., 1999. ADEL-maize: an L-system based model for the integration of
growth processes from the organ to the canopy. Application to regulation of morphogenesis by light availability. Agronomie, 19(3-4): 313-327.
Gash, J.H.C., 1979. An analytical model of rainfall interception by forests. Quart. J. R. Met. Soc., 105: 43-55.
Godin, C., 1999. Representing and encoding plant architecture: A review. Ann. For. Sci., 57: 413-438. Godin, C., Costes, E. and Sinoquet, H., 1999. A method for describing plant architecture which
integrates topology and geometry. Annals of Botany, 84(3): 343-357.
Helvey, J.D. and Patric, J.H., 1965. Canopy and litter interception of rainfall by hardwoods of eastern United States. Water Resour. Res., 1(2): 193-206.
Lewis, P., 1999. Three-dimensional plant modelling for remote sensing simulation studies using the Botanical Plant Modelling System. Agronomie, 19(3-4): 185-210.
Moulia, B. and Sinoquet, H., 1993. Three-dimensional digitizing systems for plant canopy geometrical structure : a review. In: C. Varlet-Grancher, R. Bonhomme and H. Sinoquet (Editors), Crop structure and light microclimate. Science Update. INRA, Paris, pp. 183-194. Prunsinkiewicz, P., Hammel, M., Hannan, J. and Mech, R., 1997. L-Systems : from theory to visual
models of plants. In: M. MT (Editor), Plants to ecosystems. Advances in computational life sciences series. CSIRO, Melbourne.
Saint-Jean, S., Chelle, M. and Huber, L., 2003. Modelling water transfer by rain-splash in a 3D canopy using Monte Carlo integration. Agricultural and Forest Meteorology(In Press).