REVIEW
Dynamics of dendritic cell
–T cell interactions: a role
in T cell outcome
Stéphanie HuguesReceived: 15 December 2009 / Accepted: 28 May 2010 / Published online: 6 July 2010 # Springer-Verlag 2010
Abstract Antigen-specific dendritic cells (DC)–T cell encounters occur in lymph nodes (LNs) and are essential for the induction of both priming and tolerance. In both cases, T cells are rapidly activated and proliferate. Howev-er, the subsequent outcome of T cell activation depends on the modulation of different DC- and T cell-intrinsic signals. Recent advances in two-photon (2P) microscopy have furthered our understanding regarding the complex chore-ography of DCs and T cells in intact LNs, and established differences in the dynamics of DC–T cell contacts during priming and tolerance induction. The mechanisms that favour DC–T cell encounters, as well as the contribution of the frequency and the duration of such encounters in dictating the T cell response, are discussed in this review. Keywords Dendritic cells . T cells . Dynamic interactions . Priming . Tolerance . Lymph node
Introduction
To be activated, naïve T cells need to interact physically with DCs, the most potent antigen (Ag)-presenting cells (APCs). These events occur in specialised secondary lymphoid organs, including the lymph nodes (LNs), spleen and Peyer’s patches. The establishment of a cellular contact between a T cell and a DC is required for Ag recognition and occurs through T cell receptor (TCR) interactions with
peptide–major histocompatibility (MHC) complexes pres-ent on the DC surface (called signal 1). Furthermore, T cell–DC contacts involve the engagement of different receptor–ligand including those of costimulatory and adhesion molecules (called signal 2), and the secretion of mediators (called signal 3). The integration of the three signals modulates the outcome of T cell activation. Productive activation of naïve T cells by DCs results in their clonal expansion and differentiation into effector and memory T cells. Because they present self-Ags to naïve T cells in LNs, DCs are involved in the maintenance of peripheral T cell tolerance. The activation state of the DCs that present the self-Ags determines the outcome of T cell activation: resting DCs induce T cell clonal deletion or unresponsiveness, whereas activated DCs induce T cell priming [1–6]. Alternatively, Ag presentation by resting DCs might also result in the development of regulatory T cells (Tregs) that suppress CD4+ T cell responses [7]. Whether directly via Treg interaction [8] or through the uptake of apoptotic cell debris [9] keeps DCs under a tolerogenic state, or if, indeed, DCs are tolerogenic by default until they become activated, remains to be determined.
The impact of DC–T cell contact duration on the outcome of T cell activation has been debated for several years. In vitro, multiple sequential DC–T cell contacts in three-dimensional matrices are adequate for efficient T cell priming induction [10]. However, co-cultures of DCs and T cells demonstrated that prolonged contacts (lasting for several hours) sufficed to induce efficient T cell priming [11,12] and correlated with DC maturation [13]. Since 2002, 2P microscopy of LNs cultured ex vivo and intravital microscopy of LNs have provided insight into the nature of DC–T cell interactions. Presented in this review are the major findings obtained by visualising DC and T cell dynamics during the induction of
This article is published as part of the Special Issue on Immunoimaging of immune system function.
S. Hugues (*)
Department of Pathology, University of Geneva Medical School, Geneva, Switzerland
either T cell tolerance or T cell priming, that have furthered our current understanding of the contribution of in vivo T cell–DC contact dynamics to the outcome of T cell responses.
Imaging immune cell dynamics in situ
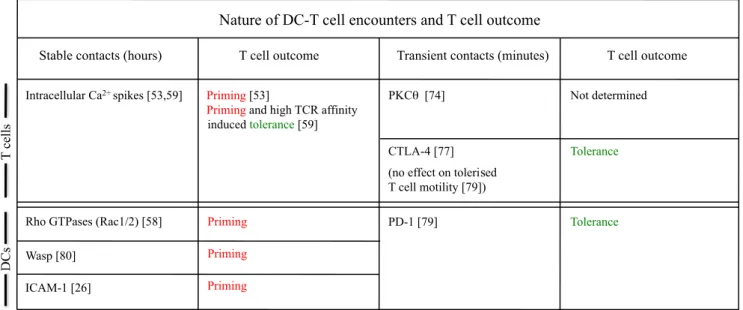
Recent advances in the field of 2P microscopy facilitate the analysis and understanding of DC migration behaviour as well as the nature of their interactions with other immune cells, in particular, during the initiation of T cell immune responses. This technique, which enables the visualisation of fluorescently labelled cells within intact tissues, has been used in several laboratories to study DC and T cell migratory patterns within LNs of mice, particularly after priming with Ag-loaded DCs [14–17]. The 2P microscopy consists in the optical sectioning of intact tissues and organs either as ex vivo explants or directly in vivo within surgically exposed preparations. The precise technology of 2P microscopy has been the subject of excellent recent reviews by Cahalan et al. and Germain et al. [18,19]. Briefly, it involves the near-simultaneous absorption of energy from two photons each contributing to half the required energy. Consequently, near-infrared wavelengths of light can be used, allowing a deeper penetration into organs. Importantly, the excitation is confined to the focal spot, considerably reducing photo-damage and photobleaching in other planes, and thus allowing long-lasting imaging of tissues. The third advan-tage of the 2P microscopy technology is the possibility to obtain a four-dimensional dynamic visualisation of cell migratory paths in situ by using an optical sectioning to scan a three-dimensional volume of tissue (x, y and z) over time. The fluorescence signal is recorded at successive focal planes, and this process is repeated every 10–30 s for several hours. Based on these acquisitions, computer analyses provide various parameters that define cell migratory characteristics: the duration of contacts (minutes or hours), the mean velocity (μm min−1), the arrest
coefficient (measures the time a cell remains arrested), the confinement ratio (the maximal distance over the total distance, reflecting whether a cell migrates in a retrained area) and the frequency of cell encounters (Fig. 1). These parameters provide information on the contribution of soluble and membrane molecules in promoting either T cell go or T cell stop, or in confining T cell migration to a restricted area, furthering our understanding on the stability of interactions between cells [20].
Herein are described several studies performed using ex vivo LN explants and in vivo surgically exposed LNs. Several in vivo studies [15,16,21–24] have confirmed the migratory characteristics of lymphocytes in LN explant preparations [16]. Thus, although lymph and blood flows are disrupted,
motility of lymphocytes in explanted LNs accurately reflects their true in vivo behaviour.
Dendritic cells in lymph nodes
DCs are members of the innate immune system that are highly specialised for the uptake, processing and presenta-tion of Ags and thus are termed professional APCs. DCs capture Ags in the periphery, migrate to secondary lymphoid organs such as draining (d)LNs, in order to initiate Ag-specific immune responses by activation of naïve T cells. The two main DC subpopulations are the conventional DCs (cDCs), which can be further subdivided into different subtypes, and the plasmacytoid DCs (pDCs). While the latter DCs have been implicated as key factors in immune responses against viruses by producing large amounts of type I interferon [25], their real-time behaviour in situ has not been studied to date. Therefore, the focus here will be on the migratory characteristics and dynamics of cDCs, and, unless specifically compared to pDCs, will be refered to as“DCs”.
In peripheral tissues including skin, gastrointestinal and respiratory tracks, immature DCs are ideally positioned to encounter both self- and foreign Ags [26]. Steady-state (naïve) DCs migrate continuously from tissues to LN whereas the migration of maturing DCs that up-regulate MHC, costimulatory and adhesion molecules, is triggered by foreign Ags coupled to danger signals. In both situations, DCs migrate from the periphery via afferent lymphatic vessels to dLNs, entering via the subcapsular sinus, and localise to the T cell area, or paracortex. Steady-state and Langerhans-derived DCs populate the entire diffuse cortex of the LN whereas newly immigrated dermal DCs localise to the cortical ridge, adjacent to reticular conduits for efficient Ag capture and also near high endothelial venules (HEVs) to favour encounters with incoming T cells. LN-resident DCs are in close contact with fibroblastic reticular cells (FRCs) that surround reticular conduits [21].
DC migratory characteristics in lymph nodes
The network of steady-state DCs in LNs has been visualised intravitally in excellent studies where transgenic (Tg) mice express the yellow fluorescent protein (YFP) under the control of the CD11c promoter [22]. CD11c-YFP Tg mice revealed that while sessile, resident DCs actively project their dendrites to scan for highly motile T cells. This elegant model is useful to analyse DC behaviour in un-manipulated settings. However, the tight network of LN-resident DCs makes the analysis of individual DC–T cell interactions difficult.
Migratory DCs stemming from the periphery via the lymph (migrating DCs) have been visualised in both explanted LNs [16,27,28] and LNs in vivo [15,21,29]. The approach relies on the use of either splenic or bone marrow-derived DCs that are labelled with a vital dye or that express a fluorescent protein. DCs are loaded in vitro with one or more antigenic peptides, and subcutaneously injected in the presence of DC adjuvants (e.g. LPS, CD40 antibodies). Migrating DCs appear in the LN paracortex in the vicinity of HEVs by 12– 20 h post-injection [15, 23], and express elevated levels of MHC and costimulatory molecules [14]. At that time, these DCs are motile, with mean velocities of approximately 6μm min−1, and continually scan T cells with actively probing dendrites [14,15]. Forty-eight hours post-injection, migrating DCs lose their motility, integrate the network of LN-resident DCs and die rapidly [22]. Another experimental setup labels endogenous cutaneous migrating DCs by the subcutaneous injection of the CFSE (carboxy-fluoroscein succinimidyl ester), together with DC adjuvants [23]. Skin DCs subse-quently travel to reach LNs, where they exhibit a slow motility (mean velocity=3μm min−1).
One limitation of in situ DCs imaging is that the different DC subsets and their activation states [30] in LNs are not distinguishable, rendering difficult analysis of specific DC subset functions. A perfect illustration of this limitation is the fact that migratory DCs transfer Ags to a LN-resident DC population for efficient CTL priming [31,
32], making the identification of Ag-presenting DCs and thus the analysis of their dynamic interactions with naïve T cells impossible.
Antigen-presenting DCs
To allow DCs to present Ags to naïve T cells and to follow the dynamics of both cells during induction of Ag-specific T cell responses, exogenous splenic DC can be incubated with one or several peptides prior to subcutaneous injection. Another possibility is to load endogenous migrating DCs with the Ag by co-injecting Ag subcutaneously with DC adjuvant and a vital dye [33]. Finally, the coupling of an Ag to an antibody directed against the DC-specific endocytic receptor DEC205 can be used to selectively target Ags to DEC205+ DCs [2,
Contact duration (h) Condition 1 Condition 2 Maximal distance Total distance Confinement ratio : 0.6 0.4 0.2 0.0 Condition 1 Condition 2 0 5 15 25 35 45 55 65 75 85 95 fraction Arrest coefficient (%) Vmean ( m.min -1) Confinement ratio 0 0.2 0.4 0.6 0.8 1 Condition 1 Condition 2 A B C D
Fig. 1 Different parameters define T cell migratory characteristics. LN images are acquired using 2P microscopy, and data are obtained after automated or manual cell tracking. T cells in conditions 1 and 2 are compared. a Contact duration with DCs. b Arrest coefficient: proportion of time each cell’s instantaneous velocity is less than a
fixed value. c T cell (red) migrating among the DC network (green). Confinement ratio (the maximal distance over the total distance) is closed to 0 when a cell migrates in a retrained area, and closed to 1 when a cell migrates straight forward. d The Vmean (μm min−1) is represented as a function of the confinement ratio
24,34]. The advantage of the latter system is that DCs can be loaded with an Ag without inducing their maturation, thus allowing the study of dynamic interactions with T cells under resting conditions, a situation described to induce T cell tolerance [2, 3]. The drawback of this approach is the delivery of the Ag to a large fraction of LN-resident DCs following injection of Ag-DEC205 conjugates which does not fit to a physiological process.
Another possibility is to directly visualise Ags and their subsequent capture by DCs. Following intravenous infusion of DQ Ovalbumin (DQ-OVA), a fluorochrome-labelled auto-quenched substitute of OVA that becomes fluorescent upon proteolytic digestion, it is possible to visualise the processing of OVA by splenic DCs, as well as its presentation to T cells [35]. Furthermore, the backcross of non-obese diabetic (NOD) mice with transgenic mice expressing the green fluorescent protein (GFP) under the mouse insulin 1 promoter allows the imaging of the capture and the presentation of GPF+islet Ags by DCs in pancreatic draining LNs [36]. An alternative solution is the use of fluorescent pathogens such as recombinant GFP-expressing viruses [37] or DsRed-expressing Leishmania major parasites [38] to analyse interactions between T cells and pathogen-infected cells. Finally, since DCs preferentially endocytosed quantum dots (QDs), these fluorescent nanoparticles can be conjugated to Ags and used as an efficient nanoparticle-based Ag delivery system [39].
Plasmacytoid DCs
The in vivo behaviour of the second main subset of DCs, the pDCs, has not been studied to date. The pDCs can be found in the blood and lymphoid organs. After activation through their toll-like receptors (TLRs) 7 and 9, pDCs secrete type I interferons, indicating an important function for this DC subset in antiviral immunity [40]. However, pDCs express MHC-I and MHC-II molecules and undergo a maturation process similar to that of cDCs [41]. Furthermore, like cDCs, pDCs internalise, process and present Ags to CD4+ T cells, and cross-present Ags to CD8+ T cells [42–45]. Thus, this particular DC subset may participate in T cell activation and induce either T cell immunity or T cell tolerance. However, it remains unclear if pDCs function as APCs or instead regulate T cell activation induced by other APCs.
In contrast to cDCs that had been shown to use the afferent lymphatic pathway to enter LNs, pDCs were shown to migrate into LNs from the circulation by direct transmigration across HEVs [46]. In a mouse model of tolerance to cardiac allografts, pDCs are recruited around HEVs in LNs [47]. A similar phenomenon is seen during the development of experimental autoimmune encephalomyelitis (EAE), the mouse model for multiple sclerosis (MS) (unpublished data from our laboratory).
Thus, pDCs, through their potential to directly present Ags to naïve T cells, are likely to influence T cell behaviour in LNs. To date, one publication describes that immature pDCs establish transient Ag-specific interactions with naïve T cells whereas mature pDCs (stimulated with CpG) interact for longer periods with T cells [48]. This study provided for the first time insights on the ability of pDCs to establish stable contacts with T cells, with respect to their maturation state. However, most experiments were per-formed in vitro, and the only in vivo experiments showing pDC–T cell contact dynamics were not correlated with T cell outcome (priming or tolerance). Future work will further address this issue. To this end, the use of transgenic mice expressing the diphteria toxin receptor under the CD11c promoter (CD11c-DTR mice) may prove useful, since treatment of CD11c-DTR mice with the toxin selectively eliminates cDCs whereas pDCs are left intact [44]. An alternative would be to target specifically pDCs with an Ag by using conjugates between the Ag and antibodies directed against the pDC-specific receptor PDCA-1 [44].
T cells in lymph nodes
T cells enter LN via HEVs and, in absence of Ag, move in a stop-and-go manner, with arrests in their migration. Their mean velocity is approximately 15μm min−1, reaching peak velocities up to 30μm min−1[23,49]. Tracking single cells revealed that T cells apparently move in random directions through the three dimensions in the diffuse cortex [23]. High T cell motility is, however, mainly constrained to the paracortical area of the LN that is located 150–200 μm under the LN capsule. Chemokines such as the CCR7 ligands CCL21 and CCL19 are present in high concentration and significantly enhance T cell motility and numbers to this area [50,51]. Along with chemokines, T cell migration in LNs is also highly influenced by the complex architecture of this organ. LNs are composed of distinct compartments and structures that are organised around a non-hematopoietic cell backbone [52,53]. Fibroblastic reticular cells (FRCs) are the major constituents of the backbone structure of the T cell zone [54]. The contribution of FRCs to T cell migratory behaviour was elegantly addressed by generating bone marrow chimeric GFP mice harbouring unlabeled immune cells, thus allowing the visualisation of GFP+ FRCs. This study reveals that the FRC network regulates not only naïve T cell access to the paracortex but also supports and defines the limits of T cell movements within this domain [21]. The authors further confirmed previously described observations [23] that T cells crawl in an amoeboid manner and simultaneously interact with as well as crawl over the reticular fibre network [21]. In vitro studies further suggest
that T cells exhibit two distinct crawling modes that differ in their speed and surface scanning potential and that the transition between the two modes is regulated by the activity of the myosin IIA, together with adhesion molecules [55]. Other data suggest that septins tune actomyosin forces act during motility and regulate T cell trafficking in confined tissues [56]. Thus, T cells adapt their migratory properties to scan large numbers of DCs and, at the same time, to decelerate and arrest rapidly in case of productive encounter. Whether these T cell motile and adhesive properties that are suited toward alternative requirements for immune surveil-lance exist in vivo remains to be determined.
Taken together, these studies suggest that T cells entering LNs diffuse rapidly to the deep paracortex and migrate actively in this confined area in search for DCs presenting cognate antigenic peptide-MHC complexes.
DC–T cell encounters in situ and T cell outcome In absence of antigen
Interactions between T cells and Ag-presenting DCs occur in secondary lymphoid tissues including the LNs, spleen and Peyer’s patches, after which activated T cells egress to migrate into peripheral tissues. Many 2P studies investigated how T cells scan for their cognate peptide-MHC in order to become activated [19,20,57]. Such experiments have demonstrated that naïve T cells migrate rapidly along stromal networks enmeshed with DCs in LN T cell zone [21], leading to 500–
5′000 T cells contacting one DC per hour in the absence of Ag [14,23]. This prediction fits well with the requirement for the initiation of an immune response where the encounter between rare presenting DCs and a low frequency of Ag-specific T cells occurs. When naïve T cells encounter DCs in absence of Ag, a few-minute contact is established. These non Ag-specific interactions failed to induce Ca2+signalling in T cells [58,59] but are likely to be functionally important. Indeed, naïve CD4+ T cell migrating in an environment deprived of MHC-II molecules demonstrate a progressive and profound defect in motility [60]. In the absence of Ag presentation by DCs to naïve T cells, some non-random chemokine-driven DC–T cell interactions occur. In vitro experiments suggested that T cell-zone chemokines such as CCL21 are bound to the surface of LN-resident DCs and help T cells to optimise Ag-specific contacts with DCs [61]. Whether this mechanism is important in DC–T cell inter-actions in vivo is not known. In vivo, naïve CD8+ T cells interact approximately threefold more frequently with DCs already engaged in Ag-specific interaction with either CD4+ [62, 63] or CD8+ [27] T cells. These preferential Ag-independent interactions rely on the expression of the CC-chemokine receptor 5 (CCR5) [27, 63] by naïve CD8+ T
cells that migrate towards CCR5 ligands (CC-chemokine ligand 3 (CCL3) and CCL4) that are likely to be produced locally by mature DCs engaged in Ag-specific contacts with T cells. Thus, CCR5 ligands guide naïve CD8+T cells to the sites of Ag-specific T cell–DC interactions, probably favour-ing T cell encounters with the most competent DCs, since this recruitment results in increased CD8+T cell responses. Dynamics of DC–T cell interactions during T cell priming After introduction of an Ag in inflammatory conditions, the DCs that enter LNs migrate with a mean velocity of 2–6 μm/min [14,
15, 17, 23] and rapidly extend and retract dynamically their dendrites, enabling DCs to scan a distance >60μm min−1 [23, 64]. Recent studies have shown that DC–T cell
interactions in LNs during the priming of both CD8+ and CD4+naïve T cells follow a complex choreography [14–16,
24,28,34]. Several studies agree on a three-phase model of DC–T cell interactions during the course of an immune response. Within the first few hours following their entry into LNs, naïve T cells establish brief contacts (<5 min) with cognate peptide-MHC complexes presenting DCs. Thus, Ag presentation by DCs only slightly increases DC–T cell contact duration. The second phase occurs approximately 10 h following T cell entry into the LN and is characterised by a dramatic change in T cell behaviour: T cell velocities decrease and T cells undergo arrest on Ag-presenting DCs, resulting in stable DC–T cell interactions lasting between 2 and 24 h depending on the studies. At this time, T cells also up-regulate at their cell surface activation markers [15,16]. Finally, after 30 h, most clusters dissociate, and the T cells exhibit a swarming behaviour, in which they regain some degree of motility and appear to migrate within a localised area. T cell velocities again increase to levels similar to that of early time points, and interactions with DCs regain their transient nature. This final phase correlates with T cell proliferation (Fig.2).
These descriptive findings raise fundamental questions: Is there a role for the three phases of DC–Tcell contact dynamics in the outcome of T cell activation? What are the molecular mechanisms that lead to variations in contact duration? Which events are essential to induce the transition from the differing phases?
During the first phase of transient interactions, T cells are likely to receive an activation signal and up-regulate the early activation marker CD69 [15,34,65]. One possibility is that T cells integrate additional signals delivered during this first phase of transient interactions to reach a threshold and become qualitatively competent to establish long-lasting contacts with T cells and enter the second phase. Alterna-tively, DCs may require a sum of accumulated brief contacts to become sufficiently activated and competent to stabilise interactions with T cells. While observed by many
laborato-ries, others have failed to see this initial phase of brief DC–T cell contacts and described T cell arrests on DCs as early as 1 h after T cell entry in LNs [24,59] and possibly with the first DC encountered [66]. As DC–T cell cluster formation
was shown to be dependent on the dose of Ag [33], abundance of the latter may explain the variability observed during the initial interaction phase.
Whether the second phase, the“T cell stop” that occurs between 1 and 20 h after initiation of the T cell response, is required for efficient priming is still debated. The formation of stable DC–T cell contact is highly dependent on the numbers [14, 67] and the quality [65] of peptide-MHC complexes. The immunological synapse (IS) is an organ-ised structure at the site of APC–T cell interaction believed to promote signalling delivered by TCR and costimulatory molecules. In vitro studies suggest that the arrest of T cells on DCs is a prerequisite for the formation of the IS [68,69], which is considered important for signal integration and the asymmetric cell division of activated T cells [11, 70,71]. Furthermore, in vitro stimulated naïve T cells can integrate TCR signalling that is sustained for hours [72–76]. In intact LNs, T cells involved in long-lasting contacts with DCs continue to receive signals for 6 h, demonstrating that such sustained TCR stimulation occurs in vivo [29].
What are the requirements for T cell arrests? Studies on T cell hydridomas and thymocytes have suggested that Ca2+ signalling is an important component of the ‘T cell stop’ signal in vitro and in vivo [77,78]. Two intravital studies have shown that sustained increases in intracellular Ca2+ spikes occur after Ag-specific contacts with DCs and
control T cell deceleration in the DC network [59, 65]. Other studies showed that during T cell stimulation by APCs in vitro, T cell chemokine receptors are recruited to and sequestrated at the IS. Consequently, T cells become insensitive to chemokine gradients and thus establish stable contacts with APCs, resulting in enhanced T cell activation [79]. Intracellular T cell signalling molecules were also shown to be involved in the control of DC–T cell contact dynamics. The protein kinase C-theta (PKCθ) promotes the establishment of brief interactions with DC by favouring a periodic destabilisation of the IS [80]. In contrast, IS reformation is driven by Wiscott Aldrich Syndrome protein (WASp) as indicated by the observation that WASp-deficient T cells are unable to reform immunological synapse after migration, unless PKCθ is inhibited [80]. Whether this balanced regulation between PKCθ and WASp occurs in T cells in vivo after DC encounters and regulates DC–T cell contact duration dynamics in LNs remains to be determined. Thus, not only signalling molecules but also factors involved in the regulation of cytoskeletal reorganisation contribute to DC–T cell contact duration. In an in vitro system, ezrin–radixin–moesin proteins involved in actin cytoskeleton organisation are rapidly inactivated after Ag recognition, resulting in decreased cellular rigidity promoting the formation of stable DC–T cell conjugates [81]. The expression of the negative regulator of T cell function cytotoxic lymphocyte antigen-4 (CTLA-4, CD152) [82] increases basal T cell motility and overrides Ag-specific T cell arrest on DCs in vivo [83]. CTLA-4 is a well-known inhibitory coreceptor
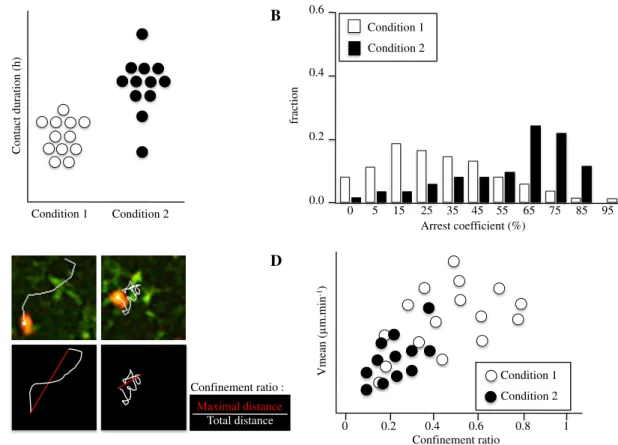
Activated DC < 10 h or non-existent 10-30 h > 30 h T cell proliferation Priming Tolerance Pathogen Steady-state Resting DC
Fig. 2 Different steps in DC–T cell contact dynamics during priming and tolerance induction [14–16,26, 32]. In LNs, incoming naïve T cells establish first transient (<5 min) Ag-specific contacts with DCs. Transition towards stable interactions, lasting for hours, occurs during priming, but not tolerance induction. Following this step of T cell arrests, T cells proliferate, regain motility and interact transiently with
DCs. Note that one study described a T cell arrest on DCs in both priming and tolerance induction [23]. A second study from the same laboratory described two pathways of induction of T cell tolerance, depending on the avidity of the TCR, that involve or do not involve stable DC–T cell contacts [59]
on T cells induced upon activation which counteracts costimulation by APC proteins CD80 and CD86 delivered to CD28 on the T cell. These authors purified CTLA-4+and CTLA-4− preactivated T cells to demonstrate that the CTLA-4+ population does not establish long-lasting con-tacts with Ag-presenting DC, resulting in impaired cytokine production and T cell proliferation when compared to CTLA-4− T cells. In vitro however, CTLA-4 deficient T cells are resistant to a stop signal induced by anti-CD3 [84]. It is difficult to explain the discrepancies between those studies but it was recently shown that in a model of tolerance toward pancreatic islet self-Ags, CTLA-4 block-ade in vivo neither alters tolerised T cell mobility nor favours the establishment of a stable contact with Ag-presenting DC [85]. On the other hand, in this study, the blockade of PD-L1 (programmed death ligand 1), a ligand for PD-1, leads to impaired T cell motility, enhancement of stable DC–T cell interactions and development of autoim-mune diabetes.
Despite these molecular changes in T cells following Ag recognition, some studies suggest that DC maturation governs DC–T cell contact stability. De-synchronisation of DC and T cell activation states during ongoing T cell responses demonstrated that the kinetics of DC activation control contact duration with T cells [34]. DC cytoskeleton is an important player in the stabilisation of interactions. Upon maturation and upon under the control of the Rho GTPases Rac1 and Rac2, DCs adapt their cytoskeletal activity to optimise the encounters and to stabilise interactions with naïve T cells in vitro but also in vivo [64]. Furthermore, imaging of DC–T cell interactions in LNs showed that cytoskeletal alterations in WASp-deficient DCs cause a reduction in the ability to form and stabilise conjugates with naïve CD8+ T lymphocytes [86]. Adhesion molecules are also involved. Intercellular Adhesion Molecule-1 (ICAM-1), when associated with TCR ligands on planar lipid membranes, is sufficient to induce T cell arrest and polarisation [87]. In vivo, the kinetics of the establishment of long-lasting DC–T cell contacts correlate with the up-regulation of ICAM-1 on the DC surface [28]. Most importantly, T cell arrest on DC was abolished after T cell transfer and priming induction in ICAM-1 deficient mice, and ICAM-1 deficient DCs establish only brief interactions with T cells during priming induction. Priming in the absence of ICAM-1 further results in impaired ability of activated T cells to produce IFN-γ and to differentiate into memory T cells [28]. One possibility is that during the brief (min) DC–T
cell interactions observed in the absence of ICAM-1, receptor polarisation and effective cytokine secretion through the intercellular space fail to occur. Consistent with this scenario, a recent study showed that ICAM-1-dependent stable DC–T cell contacts and the resulting
initial asymmetrical division affected IFNγ secretion by effector CTLs [88]. Whether or not the priming of CD8+T cells in ICAM-1-deficient mice resulted in the induction of tolerance was less clear.
Following the phase of stable DC–T cell contacts lasting for hours, T cells detach from DCs become more dynamic and establish sequential brief contacts with DCs. What are the signals for the termination of long-lasting DC–T cell contacts? A possibility is that T cells have the ability to down-modulate peptide-MHC complexes on APC [89]. It was reported that injection of an antibody directed against MHC-II molecules promotes the dissociation of established DC–T cell contacts [29], suggesting that T cells detach from the DCs when the amount of peptide-MHC complexes is too low. By contrast, the resumption of T cell mobility as well as the termination of stable contacts occur in a model where reinjection of the Ag does not prolong the phase of T cell arrests [34], telling that decreased Ag presentation by DC does not account for the phase three. The in vivo encounter of DCs from phase three with T cells from phase two does not restore stable DC–T cell interactions, suggesting that activation state of DCs controls contact duration [34]. Accordingly, ICAM-1 is down-regulated at DC surface during this late phase [28], suggesting that the abrogation of long-lasting contacts could be the result of variation in the expression of adhesion molecules by DCs. A last hypothesis is that the chemokine environment, which is dramatically modified during ongoing responses, provides“go” signals to T cells when productive DC–T cell interactions are over. In any case, the impact on T cell responses of these late brief DC–T cell encounters that could occur after T cells have been activated and have undergone cell division [66,90] is controversial. Depending on the studies, DC–T cell re-encounters favour either enhanced [66] or impaired [91] T cell effector functions. Dynamics of DC–T cell interactions during T cell tolerance Peripheral tolerance complements central tolerance as an indispensable mechanism to control autoreactive T cells that have escaped negative selection in the thymus [92]. Recent studies have shown that DCs play a central role in maintaining peripheral T cell tolerance. Ag targeting imma-ture LN-resident DCs, by either DC-specific antibodies [93] or DC-specific promoters [6,94], results in the induction of tolerance to the corresponding Ag. Upon DC activation, Ag targeting to DCs under the same conditions results in the induction of effective T cell responses (priming). Therefore, the activation state of the DCs when encountering Ag-specific naïve T cells determines the functional outcome (priming versus tolerance) of the immune response to that Ag.
A series of recent studies has established a correlation between stable long-lasting DC–T cell contacts and
effec-tive T cell priming on one hand, and brief interactions and the induction of tolerogenic T cell responses on the other hand [95] (Fig.2). Studies selectively targeting Ag to DCs via the endocytic receptor DEC205 showed that in the absence of adjuvant, LN-resident DCs only establish brief Ag-specific interactions (min) with naïve CD8+T cell [34]. Consequently, after being transiently activated, Ag-specific CD8+ T cells are clonally deleted, resulting in T cell tolerance towards the Ag [2, 34]. After DC activation by lipopolysaccharides (LPS) or CD40 antibodies, Ag-specific DC–CD8+
T cell interactions are significantly prolonged (>5 h), and effective priming was observed [34]. Another study using the same mode of Ag delivery to DC demonstrates that CD4+ T cells perform similar arrest in response to priming and tolerising conditions but become motile sooner during tolerisation (at 18 h) compared with priming (at 24 h) [24]. Under other conditions, by comparing for the first time CD4+ T cell behaviour in mucosal and systemic lymphoid organs during the induc-tion of oral priming or oral tolerance, larger and more stable DC–T cell clusters were observed in the priming situation [96]. Similarly, transient DC–T cell contacts prevail when lung-derived DC presents airway-delivered Ag under steady-state conditions in bronchial LNs, and subsequently induce Ag-specific T cell tolerance [97]. In contrast, large DC–T cell interaction clusters as well as long-lasting stable DC–T cell contacts correlate with the development of respiratory immunity [97]. In addition, the presence of high numbers of regulatory T cells (Treg) has been correlated with a decreased stability of DC–CD4+
T cell interactions. This study demonstrated a marked arrest of activated Ag-specific CD4+ T cells interacting with
Ag-loaded DCs in the absence of Ag-specific Treg. T cell arrest was however significantly diminished in the presence of Treg [98]. Similar suppressive effect of Treg on the formation of stable clusters of diabetogenic T cells with DCs in isolated pancreatic LNs was reported in a second study [36]. Recently, it was demonstrated that stable DC–T cell contacts may occur during T cell tolerance induction and that this event was dependent on the avidity of the TCR for peptide-MHC complexes expressed by DCs [65]. T cell tolerance was induced by steady-state DCs presenting high-, medium- or low-potency peptide-MHC complexes varying by only one single amino acid substitution in the antigenic peptide. All three peptides induce early and transient T cell activation, followed by induction of anergic T cells. In contrast, only “high-potency” peptide-MHC complexes lead to T cell arrest and long-lasting DC–T cell interactions. Finally, as describes above, the disruption of PD-1–PDL-1 interactions enhances the stability of contacts between tolerised T cells and Ag-presenting DCs, resulting in a breakdown of tolerance and development of autoimmunity [85]. In this model in contrast, disruption of CTLA-4–B7 interactions has no effect on the migratory characteristics of tolerised T cells, and consequently does not reverse tolerance.
Thus, in vivo studies demonstrated that the dynamic interactions of both CD4+ and CD8+ naïve T cells with mature DCs and resting DC are different during priming and tolerance induction, respectively. Contacts in the course of T cell priming are more stable than under tolerogenic conditions (Table 1). This difference is, however, more pronounced for CD8+ T cells than for CD4+ T cells. Whether this difference is model dependent or due to
Table 1 Molecules and pathways involved in the duration of DC–T cell interactions by 2P microscopy experiments
intrinsic differences in the behaviour of T cell subsets remains to be determined. Nevertheless, these in vivo studies suggest that although priming seems to result from individual long-lasting DC–T cell interactions, the induc-tion of tolerance might result from multiple brief signals delivered by different DCs. A prediction for this model is that few fully mature DCs presenting Ag is sufficient for priming induction, whereas tolerance induction would require presentation of Ag by elevated numbers of steady-state DCs. This hypothesis is consistent with the fact that a continuous pool of self-Ags is likely to be presented by high numbers of steady-state DCs whereas early events, for example the pathogen invasion of a specific tissue, very low numbers of DCs will capture, process and present pathogen-derived Ags to naïve T cells in LNs draining the site of infection. Because of their efficient ability to scan DCs [14, 33], it is likely that T cells will find the rare mature DCs presenting the pathogenic Ags. As these encounters are infrequent, they need to be productive in order to induce an efficient T cell priming response.
Concluding remarks
The 2P imaging allows the visualisation of immune cell dynamics in real-time and deep within intact tissues. In vivo imaging of cells in LNs has revealed the specific ability of these organs to promote Ag specific DC–T cell encounters. LNs first confine both DC and naïve T cells in a restricted area, and strategically position these cells to favour optimal scanning of DC by T cells. Second, both DCs and T cells, by respectively probing T cells with their dendrites and by rapidly scanning a high number of DCs, adapt their migratory properties to optimise DC–T cell encounters. Finally, there is clear evidence that the T cell activation outcome will be influenced by both DC–T cell contact duration and the frequency of DC–T cell encounters. Studies presented here reveal the importance of stable DC–T cell interactions during which effective Ca2+ signalling can take place, allowing efficient T cell proliferation and differentiation into cytokine producing cells in vivo. Most studies have failed to observe establishment of long-lasting DC–T cell interactions during tolerance induction. Because T cell arrest is a prerequisite for the formation of IS, the absence of stable DC–T cell contacts suggests that synapse formation is dispensable for the induction of tolerance in vivo. Using genetically deficient mice, several molecules involved in the stabilisation or interruption of DC–T cell interactions have been identified, and a causal relationship between contact stability and T cell outcome has been established. Future investigations using the 2P technology will aim at detecting the in vivo signalling molecules, as well as gene signatures, that are differentially regulated in T cells during priming and tolerance induction.
Furthermore, the comparison of primed and tolerised T cell behaviour upon Ag re-challenge will dictate future investigations as these events govern the breakdown of self-tolerance during autoimmunity or the efficient re-sponse of vaccinated individuals to invading pathogens. A new study has just demonstrated that following Ag re-challenge, primed and tolerised T cells exhibit different patterns of contact dynamics with DCs [99]. Thus, primed and tolerised T cells show distinct behaviour before and after secondary Ag-encounter. However, further work is needed to identify the molecular mechanisms involved in this process and how it can be manipulated for therapeutic interventions.
Acknowledgements The author thanks W. Ferlin, C. Ody and W. Reith for the critical reading of this manuscript. This work is supported by the Swiss National Science Foundation (grant 310030–127042).
References
1. Adler AJ, Marsh DW, Yochum GS, Guzzo JL, Nigam A, Nelson WG, Pardoll DM (1998) CD4+ T cell tolerance to parenchymal self-antigens requires presentation by bone marrow-derived antigen-presenting cells. J Exp Med 187:1555–1564
2. Bonifaz L, Bonnyay D, Mahnke K, Rivera M, Nussenzweig MC, Steinman RM (2002) Efficient targeting of protein antigen to the dendritic cell receptor DEC-205 in the steady state leads to antigen presentation on major histocompatibility complex class I products and peripheral CD8+ T cell tolerance. J Exp Med 196:1627–1638
3. Hawiger D, Inaba K, Dorsett Y, Guo M, Mahnke K, Rivera M, Ravetch JV, Steinman RM, Nussenzweig MC (2001) Dendritic cells induce peripheral T cell unresponsiveness under steady state conditions in vivo. J Exp Med 194:769–779
4. Hernandez J, Aung S, Redmond WL, Sherman LA (2001) Phenotypic and functional analysis of CD8(+) T cells undergoing peripheral deletion in response to cross-presentation of self-antigen. J Exp Med 194:707–717
5. Liu K, Iyoda T, Saternus M, Kimura Y, Inaba K, Steinman RM (2002) Immune tolerance after delivery of dying cells to dendritic cells in situ. J Exp Med 196:1091–1097
6. Probst HC, Lagnel J, Kollias G, van den Broek M (2003) Inducible transgenic mice reveal resting dendritic cells as potent inducers of CD8+ T cell tolerance. Immunity 18:713–720 7. Sakaguchi S (2004) Naturally arising CD4+ regulatory T cells for
immunologic self-tolerance and negative control of immune responses. Annu Rev Immunol 22:531–562
8. Misra N, Bayry J, Lacroix-Desmazes S, Kazatchkine MD, Kaveri SV (2004) Cutting edge: human CD4+CD25+ T cells restrain the maturation and antigen-presenting function of dendritic cells. J Immunol 172:4676–4680
9. Albert ML (2004) Death-defying immunity: do apoptotic cells influence antigen processing and presentation? Nat Rev Immunol 4:223–231
10. Gunzer M, Schafer A, Borgmann S, Grabbe S, Zanker KS, Brocker EB, Kampgen E, Friedl P (2000) Antigen presentation in extracellular matrix: interactions of T cells with dendritic cells are dynamic, short lived, and sequential. Immunity 13:323–332 11. Iezzi G, Karjalainen K, Lanzavecchia A (1998) The duration of
antigenic stimulation determines the fate of naive and effector T cells. Immunity 8:89–95
12. van Stipdonk MJ, Lemmens EE, Schoenberger SP (2001) Naive CTLs require a single brief period of antigenic stimulation for clonal expansion and differentiation. Nat Immunol 2:423–429 13. Benvenuti F, Lagaudriere-Gesbert C, Grandjean I, Jancic C, Hivroz
C, Trautmann A, Lantz O, Amigorena S (2004) Dendritic cell maturation controls adhesion, synapse formation, and the duration of the interactions with naive T lymphocytes. J Immunol 172:292–301 14. Bousso P, Robey E (2003) Dynamics of CD8+ T cell priming by
dendritic cells in intact lymph nodes. Nat Immunol 4:579–585 15. Mempel TR, Henrickson SE, Von Andrian UH (2004) T-cell
priming by dendritic cells in lymph nodes occurs in three distinct phases. Nature 427:154–159
16. Miller MJ, Wei SH, Parker I, Cahalan MD (2002) Two-photon imaging of lymphocyte motility and antigen response in intact lymph node. Science 296:1869–1873
17. Stoll S, Delon J, Brotz TM, Germain RN (2002) Dynamic imaging of T cell–dendritic cell interactions in lymph nodes. Science 296:1873– 1876
18. Cahalan MD, Parker I, Wei SH, Miller MJ (2002) Two-photon tissue imaging: seeing the immune system in a fresh light. Nat Rev Immunol 2:872–880
19. Germain RN, Miller MJ, Dustin ML, Nussenzweig MC (2006) Dynamic imaging of the immune system: progress, pitfalls and promise. Nat Rev Immunol 6:497–507
20. Bousso P (2008) T-cell activation by dendritic cells in the lymph node: lessons from the movies. Nat Rev Immunol 8:675–684 21. Bajenoff M, Egen JG, Koo LY, Laugier JP, Brau F, Glaichenhaus N,
Germain RN (2006) Stromal cell networks regulate lymphocyte entry, migration, and territoriality in lymph nodes. Immunity 25:989–1001 22. Lindquist RL, Shakhar G, Dudziak D, Wardemann H, Eisenreich
T, Dustin ML, Nussenzweig MC (2004) Visualizing dendritic cell networks in vivo. Nat Immunol 5:1243–1250
23. Miller MJ, Hejazi AS, Wei SH, Cahalan MD, Parker I (2004) T cell repertoire scanning is promoted by dynamic dendritic cell behavior and random T cell motility in the lymph node. Proc Natl Acad Sci USA 101:998–1003
24. Shakhar G, Lindquist RL, Skokos D, Dudziak D, Huang JH, Nussenzweig MC, Dustin ML (2005) Stable T cell–dendritic cell interactions precede the development of both tolerance and immunity in vivo. Nat Immunol 6:707–714
25. Liu YJ (2005) IPC: professional type 1 interferon-producing cells and plasmacytoid dendritic cell precursors. Annu Rev Immunol 23:275–306
26. Cavanagh LL, Weninger W (2008) Dendritic cell behaviour in vivo: lessons learned from intravital two-photon microscopy. Immunol Cell Biol 86:428–438
27. Hugues S, Scholer A, Boissonnas A, Nussbaum A, Combadiere C, Amigorena S, Fetler L (2007) Dynamic imaging of chemokine-dependent CD8+ T cell help for CD8+ T cell responses. Nat Immunol 8:921–930
28. Scholer A, Hugues S, Boissonnas A, Fetler L, Amigorena S (2008) Intercellular adhesion molecule-1-dependent stable inter-actions between T cells and dendritic cells determine CD8+ T cell memory. Immunity 28:258–270
29. Celli S, Lemaitre F, Bousso P (2007) Real-time manipulation of T cell– dendritic cell interactions in vivo reveals the importance of prolonged contacts for CD4+ T cell activation. Immunity 27:625–634
30. Shortman K, Naik SH (2007) Steady-state and inflammatory dendritic-cell development. Nat Rev Immunol 7:19–30
31. Allan RS, Waithman J, Bedoui S, Jones CM, Villadangos JA, Zhan Y, Lew AM, Shortman K, Heath WR, Carbone FR (2006) Migratory dendritic cells transfer antigen to a lymph node-resident dendritic cell population for efficient CTL priming. Immunity 25:153–162 32. Carbone FR, Belz GT, Heath WR (2004) Transfer of antigen
between migrating and lymph node-resident DCs in peripheral T-cell tolerance and immunity. Trends Immunol 25:655–658
33. Miller MJ, Safrina O, Parker I, Cahalan MD (2004) Imaging the single cell dynamics of CD4+ T cell activation by dendritic cells in lymph nodes. J Exp Med 200:847–856
34. Hugues S, Fetler L, Bonifaz L, Helft J, Amblard F, Amigorena S (2004) Distinct T cell dynamics in lymph nodes during the induction of tolerance and immunity. Nat Immunol 5:1235– 1242
35. Odoardi F, Kawakami N, Li Z, Cordiglieri C, Streyl K, Nosov M, Klinkert WE, Ellwart JW, Bauer J, Lassmann H et al (2007) Instant effect of soluble antigen on effector T cells in peripheral immune organs during immunotherapy of autoimmune encepha-lomyelitis. Proc Natl Acad Sci USA 104:920–925
36. Tang Q, Adams JY, Tooley AJ, Bi M, Fife BT, Serra P, Santamaria P, Locksley RM, Krummel MF, Bluestone JA (2006) Visualizing regulatory T cell control of autoimmune responses in nonobese diabetic mice. Nat Immunol 7:83–92
37. Hickman HD, Takeda K, Skon CN, Murray FR, Hensley SE, Loomis J, Barber GN, Bennink JR, Yewdell JW (2008) Direct priming of antiviral CD8+ T cells in the peripheral interfollicular region of lymph nodes. Nat Immunol 9:155–165
38. Filipe-Santos O, Pescher P, Breart B, Lippuner C, Aebischer T, Glaichenhaus N, Spath GF, Bousso P (2009) A dynamic map of antigen recognition by CD4 T cells at the site of Leishmania major infection. Cell Host Microbe 6:23–33
39. Sen D, Deerinck TJ, Ellisman MH, Parker I, Cahalan MD (2008) Quantum dots for tracking dendritic cells and priming an immune response in vitro and in vivo. PLoS ONE 3:e3290
40. Colonna M, Trinchieri G, Liu YJ (2004) Plasmacytoid dendritic cells in immunity. Nat Immunol 5:1219–1226
41. Villadangos JA, Young L (2008) Antigen-presentation properties of plasmacytoid dendritic cells. Immunity 29:352–361
42. Di Pucchio T, Chatterjee B, Smed-Sorensen A, Clayton S, Palazzo A, Montes M, Xue Y, Mellman I, Banchereau J, Connolly JE (2008) Direct proteasome-independent cross-presentation of viral antigen by plasmacytoid dendritic cells on major histocompatibil-ity complex class I. Nat Immunol 9:551–557
43. Hoeffel G, Ripoche AC, Matheoud D, Nascimbeni M, Escriou N, Lebon P, Heshmati F, Guillet JG, Gannage M, Caillat-Zucman S et al (2007) Antigen crosspresentation by human plasmacytoid dendritic cells. Immunity 27:481–492
44. Sapoznikov A, Fischer JA, Zaft T, Krauthgamer R, Dzionek A, Jung S (2007) Organ-dependent in vivo priming of naive CD4+, but not CD8 +, T cells by plasmacytoid dendritic cells. J Exp Med 204:1923–1933 45. Young LJ, Wilson NS, Schnorrer P, Proietto A, ten Broeke T, Matsuki Y, Mount AM, Belz GT, O’Keeffe M, Ohmura-Hoshino M et al (2008) Differential MHC class II synthesis and ubiquitination confers distinct antigen-presenting properties on conventional and plasma-cytoid dendritic cells. Nat Immunol 9:1244–1252
46. Yoneyama H, Matsuno K, Zhang Y, Nishiwaki T, Kitabatake M, Ueha S, Narumi S, Morikawa S, Ezaki T, Lu B et al (2004) Evidence for recruitment of plasmacytoid dendritic cell precursors to inflamed lymph nodes through high endothelial venules. Int Immunol 16:915–928
47. Ochando JC, Homma C, Yang Y, Hidalgo A, Garin A, Tacke F, Angeli V, Li Y, Boros P, Ding Y et al (2006) Alloantigen-presenting plasmacytoid dendritic cells mediate tolerance to vascularized grafts. Nat Immunol 7:652–662
48. Mittelbrunn M, Martinez Del Hoyo G, Lopez-Bravo M, Martin-Cofreces NB, Scholer A, Hugues S, Fetler L, Amigorena S, Ardavin C, Sanchez-Madrid F (2009) Imaging of plasmacytoid dendritic cell interactions with T cells. Blood 113:75–84 49. Miller MJ, Wei SH, Cahalan MD, Parker I (2003) Autonomous T
cell trafficking examined in vivo with intravital two-photon microscopy. Proc Natl Acad Sci USA 100:2604–2609
50. Cyster JG (1999) Chemokines and cell migration in secondary lymphoid organs. Science 286:2098–2102
51. Worbs T, Mempel TR, Bolter J, von Andrian UH, Forster R (2007) CCR7 ligands stimulate the intranodal motility of T lymphocytes in vivo. J Exp Med 204:489–495
52. Gretz JE, Anderson AO, Shaw S (1997) Cords, channels, corridors and conduits: critical architectural elements facilitating cell inter-actions in the lymph node cortex. Immunol Rev 156:11–24 53. Kaldjian EP, Gretz JE, Anderson AO, Shi Y, Shaw S (2001)
Spatial and molecular organization of lymph node T cell cortex: a labyrinthine cavity bounded by an epithelium-like monolayer of fibroblastic reticular cells anchored to basement membrane-like extracellular matrix. Int Immunol 13:1243–1253
54. Katakai T, Hara T, Sugai M, Gonda H, Shimizu A (2004) Lymph node fibroblastic reticular cells construct the stromal reticulum via contact with lymphocytes. J Exp Med 200:783–795
55. Jacobelli J, Bennett FC, Pandurangi P, Tooley AJ, Krummel MF (2009) Myosin-IIA and ICAM-1 regulate the interchange between two distinct modes of T cell migration. J Immunol 182:2041–2050 56. Tooley AJ, Gilden J, Jacobelli J, Beemiller P, Trimble WS, Kinoshita M, Krummel MF (2009) Amoeboid T lymphocytes require the septin cytoskeleton for cortical integrity and persistent motility. Nat Cell Biol 11:17–26
57. Cahalan MD, Parker I (2008) Choreography of cell motility and interaction dynamics imaged by two-photon microscopy in lymphoid organs. Annu Rev Immunol 26:585–626
58. Asperti-Boursin F, Real E, Bismuth G, Trautmann A, Donnadieu E (2007) CCR7 ligands control basal T cell motility within lymph node slices in a phosphoinositide 3-kinase-independent manner. J Exp Med 204:1167–1179
59. Wei SH, Safrina O, Yu Y, Garrod KR, Cahalan MD, Parker I (2007) Ca2+ signals in CD4+ T cells during early contacts with antigen-bearing dendritic cells in lymph node. J Immunol 179:1586–1594 60. Fischer UB, Jacovetty EL, Medeiros RB, Goudy BD, Zell T,
Swanson JB, Lorenz E, Shimizu Y, Miller MJ, Khoruts A et al (2007) MHC class II deprivation impairs CD4 T cell motility and responsiveness to antigen-bearing dendritic cells in vivo. Proc Natl Acad Sci USA 104:7181–7186
61. Friedman RS, Jacobelli J, Krummel MF (2006) Surface-bound chemokines capture and prime T cells for synapse formation. Nat Immunol 7:1101–1108
62. Beuneu H, Garcia Z, Bousso P (2006) Cutting edge: cognate CD4 help promotes recruitment of antigen-specific CD8 T cells around dendritic cells. J Immunol 177:1406–1410
63. Castellino F, Huang AY, Altan-Bonnet G, Stoll S, Scheinecker C, Germain RN (2006) Chemokines enhance immunity by guiding naive CD8+ T cells to sites of CD4+ T cell-dendritic cell interaction. Nature 440:890–895
64. Benvenuti F, Hugues S, Walmsley M, Ruf S, Fetler L, Popoff M, Tybulewicz VL, Amigorena S (2004) Requirement of Rac1 and Rac2 expression by mature dendritic cells for T cell priming. Science 305:1150–1153
65. Skokos D, Shakhar G, Varma R, Waite JC, Cameron TO, Lindquist RL, Schwickert T, Nussenzweig MC, Dustin ML (2007) Peptide-MHC potency governs dynamic interactions between T cells and dendritic cells in lymph nodes. Nat Immunol 8:835–844
66. Celli S, Garcia Z, Bousso P (2005) CD4 T cells integrate signals delivered during successive DC encounters in vivo. J Exp Med 202:1271–1278
67. Henrickson SE, Mempel TR, Mazo IB, Liu B, Artyomov MN, Zheng H, Peixoto A, Flynn MP, Senman B, Junt T et al (2008) T cell sensing of antigen dose governs interactive behavior with dendritic cells and sets a threshold for T cell activation. Nat Immunol 9:282–291 68. Dustin ML, Tseng SY, Varma R, Campi G (2006) T cell-dendritic
cell immunological synapses. Curr Opin Immunol 18:512–516 69. Grakoui A, Bromley SK, Sumen C, Davis MM, Shaw AS, Allen PM,
Dustin ML (1999) The immunological synapse: a molecular machine controlling T cell activation. Science 285:221–227
70. Dustin ML, Chan AC (2000) Signaling takes shape in the immune system. Cell 103:283–294
71. Obst R, van Santen HM, Mathis D, Benoist C (2005) Antigen persistence is required throughout the expansion phase of a CD4 (+) T cell response. J Exp Med 201:1555–1565
72. Costello PS, Gallagher M, Cantrell DA (2002) Sustained and dynamic inositol lipid metabolism inside and outside the immunological synapse. Nat Immunol 3:1082–1089
73. Curtsinger JM, Johnson CM, Mescher MF (2003) CD8 T cell clonal expansion and development of effector function require prolonged exposure to antigen, costimulation, and signal 3 cytokine. J Immunol 171:5165–5171
74. Fabre S, Lang V, Harriague J, Jobart A, Unterman TG, Trautmann A, Bismuth G (2005) Stable activation of phosphatidylinositol 3-kinase in the T cell immunological synapse stimulates Akt signaling to FoxO1 nuclear exclusion and cell growth control. J Immunol 174:4161–4171
75. Harriague J, Bismuth G (2002) Imaging antigen-induced PI3K activation in T cells. Nat Immunol 3:1090–1096
76. Schrum AG, Turka LA (2002) The proliferative capacity of individual naive CD4(+) T cells is amplified by prolonged T cell antigen receptor triggering. J Exp Med 196:793–803
77. Bhakta NR, Oh DY, Lewis RS (2005) Calcium oscillations regulate thymocyte motility during positive selection in the three-dimensional thymic environment. Nat Immunol 6:143– 151
78. Negulescu PA, Krasieva TB, Khan A, Kerschbaum HH, Cahalan MD (1996) Polarity of T cell shape, motility, and sensitivity to antigen. Immunity 4:421–430
79. Molon B, Gri G, Bettella M, Gomez-Mouton C, Lanzavecchia A, Martinez AC, Manes S, Viola A (2005) T cell costimulation by chemokine receptors. Nat Immunol 6:465–471
80. Sims TN, Soos TJ, Xenias HS, Dubin-Thaler B, Hofman JM, Waite JC, Cameron TO, Thomas VK, Varma R, Wiggins CH et al (2007) Opposing effects of PKCtheta and WASp on symmetry breaking and relocation of the immunological synapse. Cell 129:773–785 81. Faure S, Salazar-Fontana LI, Semichon M, Tybulewicz VL,
Bismuth G, Trautmann A, Germain RN, Delon J (2004) ERM proteins regulate cytoskeleton relaxation promoting T cell-APC conjugation. Nat Immunol 5:272–279
82. Walunas TL, Lenschow DJ, Bakker CY, Linsley PS, Freeman GJ, Green JM, Thompson CB, Bluestone JA (1994) CTLA-4 can function as a negative regulator of T cell activation. Immunity 1:405–413
83. Schneider H, Downey J, Smith A, Zinselmeyer BH, Rush C, Brewer JM, Wei B, Hogg N, Garside P, Rudd CE (2006) Reversal of the TCR stop signal by CTLA-4. Science 313:1972– 1975
84. Downey J, Smith A, Schneider H, Hogg N, Rudd CE (2008) TCR/CD3 mediated stop-signal is decoupled in T-cells from Ctla4 deficient mice. Immunol Lett 115:70–72
85. Fife BT, Pauken KE, Eagar TN, Obu T, Wu J, Tang Q, Azuma M, Krummel MF, Bluestone JA (2009) Interactions between PD-1 and PD-L1 promote tolerance by blocking the TCR-induced stop signal. Nat Immunol 10:1185–1192
86. Pulecio J, Tagliani E, Scholer A, Prete F, Fetler L, Burrone OR, Benvenuti F (2008) Expression of Wiskott-Aldrich syndrome protein in dendritic cells regulates synapse formation and activation of naive CD8+ T cells. J Immunol 181:1135– 1142
87. Dustin ML, Bivona TG, Philips MR (2004) Membranes as messengers in T cell adhesion signaling. Nat Immunol 5:363–372 88. Chang JT, Palanivel VR, Kinjyo I, Schambach F, Intlekofer AM, Banerjee A, Longworth SA, Vinup KE, Mrass P, Oliaro J et al (2007) Asymmetric T lymphocyte division in the initiation of adaptive immune responses. Science 315:1687–1691
89. Kedl RM, Schaefer BC, Kappler JW, Marrack P (2002) T cells down-modulate peptide-MHC complexes on APCs in vivo. Nat Immunol 3:27–32
90. Garcia Z, Pradelli E, Celli S, Beuneu H, Simon A, Bousso P (2007) Competition for antigen determines the stability of T cell-dendritic cell interactions during clonal expansion. Proc Natl Acad Sci USA 104:4553–4558
91. Jelley-Gibbs DM, Dibble JP, Filipson S, Haynes L, Kemp RA, Swain SL (2005) Repeated stimulation of CD4 effector T cells can limit their protective function. J Exp Med 201:1101–1112 92. Steinman RM, Hawiger D, Liu K, Bonifaz L, Bonnyay D, Mahnke K, Iyoda T, Ravetch J, Dhodapkar M, Inaba K et al (2003) Dendritic cell function in vivo during the steady state: a role in peripheral tolerance. Ann NY Acad Sci 987:15–25 93. Gunzer M, Weishaupt C, Hillmer A, Basoglu Y, Friedl P, Dittmar
KE, Kolanus W, Varga G, Grabbe S (2004) A spectrum of biophysical interaction modes between T cells and different antigen-presenting cells during priming in 3-D collagen and in vivo. Blood 104:2801–2809
94. Probst HC, McCoy K, Okazaki T, Honjo T, van den Broek M (2005) Resting dendritic cells induce peripheral CD8+ T cell
tolerance through PD-1 and CTLA-4. Nat Immunol 6:280– 286
95. Garside P, Brewer JM (2008) Real-time imaging of the cellular interactions underlying tolerance, priming, and responses to infection. Immunol Rev 221:130–146
96. Zinselmeyer BH, Dempster J, Gurney AM, Wokosin D, Miller M, Ho H, Millington OR, Smith KM, Rush CM, Parker I et al (2005) In situ characterization of CD4+ T cell behavior in mucosal and systemic lymphoid tissues during the induction of oral priming and tolerance. J Exp Med 201:1815–1823
97. Bakocevic N, Worbs T, Davalos-Misslitz A, Forster R (2010) T cell-dendritic cell interaction dynamics during the induction of respiratory tolerance and immunity. J Immunol 184:1317–1327 98. Tadokoro CE, Shakhar G, Shen S, Ding Y, Lino AC, Maraver A,
Lafaille JJ, Dustin ML (2006) Regulatory T cells inhibit stable contacts between CD4+ T cells and dendritic cells in vivo. J Exp Med 203:505–511
99. Rush CM, Millington OR, Hutchison S, Bryson K, Brewer JM, Garside P (2009) Characterization of CD4+ T-cell–dendritic cell interactions during secondary antigen exposure in tolerance and priming. Immunology 128:463–471
![Fig. 2 Different steps in DC – T cell contact dynamics during priming and tolerance induction [14 – 16, 26, 32]](https://thumb-eu.123doks.com/thumbv2/123doknet/14851974.630220/6.892.117.764.82.354/fig-different-steps-contact-dynamics-priming-tolerance-induction.webp)