SCIENTIFIC ARTICLE
Optimal 3-T MRI for depiction of the finger A2 pulley:
comparison between T1-weighted, fat-saturated T2-weighted
and gadolinium-enhanced fat-saturated
T1-weighted sequences
Vasco Goncalves-Matoso&Daniel Guntern&
Anne Gray&Pierre Schnyder&Carmen Picht&
Nicolas Theumann
Received: 14 October 2007 / Accepted: 15 November 2007 / Published online: 19 December 2007
# ISS 2007
Abstract
Objective To compare three spin-echo sequences, trans-verse T1-weighted (T1WI), transtrans-verse fat-saturated (FS) T2-weighted (T2WI), and transverse gadolinium-enhanced (Gd) FS T1WI, for the visualisation of normal and abnormal finger A2 pulley with magnetic resonance (MR) imaging at 3 tesla (T).
Materials and methods Sixty-three fingers from 21 patients were consecutively investigated. Two musculoskeletal radiologists retrospectively compared all sequences to assess the visibility of normal and abnormal A2 pulleys and the presence of motion or ghost artefacts.
Results Normal and abnormal A2 pulleys were visible in 94% (59/63) and 95% (60/63) on T1WI sequences, in 63% (40/63) and 60% (38/63) on FS T2WI sequences, and in 87% (55/63) and 73% (46/63) on Gd FS T1WI sequences when read by the first and second observer, respectively. Motion and ghost artefacts were higher on FS T2WI sequences. Seven among eight abnormal A2 pulleys were detected, and were best depicted with Gd FS T1WI sequences in 71% (5/7) and 86% (6/7) by the first and the second observer, respectively.
Conclusion In 3-T MRI, the comparison between trans-verse T1WI, FS T2WI, and Gd FS T1WI sequences shows that transverse T1WI allows excellent depiction of the A2 pulley, that FS T2WI suffers from a higher rate of motion and ghost artefacts, and transverse Gd FS T1WI is the best sequence for the depiction of abnormal A2 pulley.
Keywords Magnetic resonance imaging .
High-field-strength imaging . Artefacts . Fingers injuries
Introduction
The finger pulleys are fascial slings that form volar fibro-osseous tunnels that encircle and constrain the sheaths and tendons of the finger flexor. Injuries to finger pulleys result in increased tendon excursion and, therefore, in loss of force. The finger pulleys consist of five annular and three cruciform thickenings along the flexor tendons’ sheath, respectively named A1, A2, A3, A4, A5, and C1, C2, C3 (Fig.1) [1–6]. The A2 pulley is the largest (16.3–16.8 mm
wide and 0.3–0.5 mm thin) and functionally the most important one, together with the A4 pulley [1,3,4]. The A2 pulley extends from the volar aspect of the proximal third to the distal third of the proximal phalanx.
Because of the increasing popularity of rock climbing, traumatic lesions of the fingers and the pulleys have increased these past two decades [3]. Generally, rupture of pulleys has a progressive and predictable pattern: it begins at A2 and is followed by involvement of A3 and A4 and, rarely, A1 [4, 7]. Rupture of the A2 pulley needs to be diagnosed correctly, otherwise, if not treated, it can lead to
DOI 10.1007/s00256-007-0426-z
V. Goncalves-Matoso (*)
:
D. Guntern:
P. Schnyder:
C. Picht:
N. Theumann
Department of Diagnostic and Interventional Radiology, Lausanne University Hospital,
rue du Bugnon 46, 1011 Lausanne, Switzerland
e-mail: [email protected] A. Gray
Department of Hand Surgery, Longeraie Clinic, Lausanne, Switzerland
flexion contracture and secondary osteo-arthritis of the proximal interphalangeal joint [3–5]. Clinical examination has proved to be inaccurate in the acute phase when tumefaction and oedema are present [2,3]. The “bowstring-ing sign” of the flexor tendons, i.e. an augmented distance between the flexor tendons and the phalanx, may be unrecognised, especially when only one annular pulley is ruptured [3, 4]. The nature of the lesion needs also to be specified accurately, because partial or complete rupture of a single pulley is treated conservatively, and complete ruptures of multiple pulleys are treated surgically when conservative treatment has failed [6, 7]. Therefore, an imaging method is mandatory.
Radiographs can only demonstrate a non-specific soft tissue swelling. Computed tomography can show the “bowstringing sign” but cannot directly show the pulleys, because of low contrast resolution. Ultrasound (US) and magnetic resonance (MR) are currently the reference standard imaging modalities for most authors. US has proved to be accurate for the depiction of pulley rupture in limited series, with a sensitivity of 98% and a specificity of 100%, but it was based mostly on indirect signs [3–8]. To our knowledge, previous MR studies were all done with magnetic field strengths ranging form 0.35 tesla to 1.5 tesla (T) [2–7]. The purpose of our study was thus to compare three standard spin-echo (SE) sequences, transverse T1-weighted (T1WI), transverse fat-saturated (FS) T2-T1-weighted (T2WI), and transverse gadolinium-enhanced (Gd) FS
T1WI, with 3.0 T MR, in the visualisation of normal and abnormal finger pulleys.
Materials and methods
Our study complied with Good Clinical Practice and the Declaration of Helsinki. Because of its retrospective nature, our study did not need approval by the Ethics Committee of our institution. Between October 2005 and August 2006, MR images, performed with a 3 T scanner, of 21 con-secutive patients, were included in the study. Nine men and 12 women with an average age of 34.6 years were included (SD ± 11.7 years, range 8–66 years). Clinical histories were trauma in 11 patients (with suggestion of pulley lesions in eight patients), tumours in three patients, infection in one patient, and miscellaneous events in six patients. Depend-ing on the clinical histories, 1, 2, 3, or 4 fDepend-ingers (i.e. index, long, ring or fifth fingers) were covered by the field of view (FOV). Finally 63, fingers were able to be investi-gated, including 13 index, 20 long, 19 ring, and 11 fifth fingers.
MR imaging was performed with a 3 T scanner (Trio, Siemens, Erlangen, Germany). Patients were placed in the prone position with the arm extended overhead. The hand was in a pronated position, centrally placed in a dedicated wrist coil (Alpha III Tx/Rx Quadrature Wrist Coil, Siemens). Reviewed sequences consisted of transverse T1WI SE, transverse FS T2WI SE, and transverse FS T1WI SE, after the patient had received a 15 ml intravenous injection of Gd DTPA-BMA (Omniscan, Amersham Health, Wädenswill, Switzerland). Depending on their clinical histories, some patients also benefited from addi-tional sequences, but those addiaddi-tional sequences were not included in our study.
In transverse T1WI, the technical parameters were: repetition time/echo time 600 ms/10 ms, matrix 512 pix-els×512 pixels, FOV 95 mm×95 mm, resulting in a pixel size of 0.19 mm. In transverse FS T2WI, parameters were: repetition time/echo time 3,800 ms/80 ms, matrix 320 pix-els × 320 pixpix-els, FOV 100 mm × 100 mm, pixel size 0.31 mm. In transverse Gd FS T1WI, parameters were: repetition time/echo time 687 ms/12 ms, matrix 512 pix-els×512 pixels, FOV 95 mm×95 mm, pixel size 0.19 mm. Examination times were 3.46 min for T1WI, 2.06 min for T2WI, and 4.06 min for Gd FS T1WI. Section thickness was 3 mm in every sequence, with a 0.3 mm gap. Calculated signal-to-noise ratio (SNR), from the formula SNR = FOVf × FOVp × √Nex × d/√Nf × Np (FOVf is
frequency FOV, FOVp is phase FOV, Nex is number of
excitations, d is slice thickness, Nf/pis number of phase and
frequency encodings), was 0.98 for T1WI, 0.73 for FS T2WI, and 1 for Gd FS T1WI (details of FOVf /p,Nex, and
Fig. 1 Schema of the A2 pulley (A2) in a transverse plan (left diagram) and schema of the annular (A1–A5) and cruciform (C1–C3) pulley system in a sagittal plan (right diagram) (MC metacarpus, P1 first phalanx, P2 second phalanx, P3 third phalanx, PP palmar plate)
Nf/pare beyond the scope of this article). At the time of our
study, the technical parameters were chosen so that we could achieve the best compromise between the spatial resolution, SNR, and time examination. Specific absorption rate (SAR) was in accordance with local applicable regulations. MR examinations and gadolinium intravenous injection were well tolerated by all patients.
Two radiologists (N.T. and D.G.), with 8 years and 3 years of musculoskeletal radiology experience, blinded from clinical indications, independently reviewed each sequence. The observers subjectively chose the optimal window parameters for each sequence. Reading and measurements were done on a commercial DICOM viewer (eFilm Workstation 2.0, Merge Healthcare, Milwaukee, WI, USA). The observers had to determine whether the A2 pulley of every finger covered by the FOV was fully visible or not, if they could recognise a lesion of the A2 pulley or not, and if the visibility of the A2 pulley was limited by motion and ghost artefacts or not. We used the following standard criteria to determine whether an A2 pulley was normal or abnormal: pulleys were considered normal if they were thin and continuous all around the flexor tendons and with hypointense signal in all sequences; pulleys were considered abnormal when a gap (i.e. a space between two
pulley fragments) could be identified or when the signal was hyperintense in the FS T2WI sequence. Although not yet described in the literature, Gd enhancement was used as a sign of pulley abnormality. Because none of our patients had been surgically treated, we decided to use the clinical follow-up (average 7 months, range 2-12 months) as gold standard. Data of index, long, ring and fifth fingers were analysed globally, but, because the A2 pulley of the fifth finger is smaller than the other fingers [4], we also analysed data from the fifth fingers separately.
Data were processed with JMP 5.1 Statistical Package software (SAS Institute, Cary, USA). Kappa inter-observer variability was used to measure the degree of agreement: <0.21, 0.21–0.4, 0.41–0.6, 0.61–0.8, and 0.81–1 were considered respectively as poor, fair, moderate, good and very good agreement, respectively.
Results
Normal and abnormal A2 pulleys were visible in 94% (59/ 63) and 95% (60/63), on T1WI sequences, in 63% (40/63) and 60% (38/63) on FS T2WI sequences, and in 87% (55/ 63) and 73% (46/63) on Gd FS T1WI sequences when read
Table 1 Contingency tables of normal A2 pulley depiction with transverse T1-weighted (T1WI), fat-saturated T2-weighted (FS T2WI) and gadolinium-enhanced fat-saturated T1-weighted (Gd FS T1WI) sequences in 3 T magnetic resonance imaging
Parameter Findings
Reader 1
T1WI vs FS T2WI Visible in FS T2WI Not visible in FS T2WI Sum
Visible in T1WI 37 (58.73%) 22 (34.92%) 59 (93.65%)
Not visible in T1WI 3 (4.76%) 1 (1.59%) 4 (6.35%)
Sum 40 (63.49%) 23 (36.51%) 63 (100%)
T1WI vs Gd FS T1WI Visible in Gd FS T1WI Not visible in Gd FS T1WI Sum
Visible in T1WI 52 (82.54%) 7 (11.11%) 59 (93.65%)
Not visible in T1WI 3 (4.76%) 1 (1.59%) 4 (6.35%)
Sum 55 (87.30%) 8 (12.70%) 63 (100%)
FS T2WI vs Gd FS T1WI Visible in Gd FS T1WI Not visible in Gd FS T1WI Sum
Visible in FS T2WI 38 (60.32%) 2 (3.17%) 40 (63.49%)
Not visible FS T2WI 17 (26.98%) 6 (9.53%) 23 (36.51%)
Sum 55 (87.30%) 8 (12.70%) 63 (100%)
Reader 2
T1WI vs FS T2WI Visible in FS T2WI Not visible in FS T2WI Sum
Visible in T1WI 36 (57.14%) 24 (38.10%) 60 (95.24%)
Not visible in T1WI 2 (3.17%) 1 (1.59%) 3 (4.76%)
Sum 38 (60.31%) 25 (39.69%) 63 (100%)
T1WI vs Gd FS T1WI Visible in Gd FS T1WI Not visible in Gd FS T1WI Sum
Visible in T1WI 44 (69.84%) 16 (25.40%) 60 (95.24%)
Not visible in T1WI 2 (3.17%) 1 (1.59%) 3 (4.76%)
Sum 46 (73.01%) 17 (26.99%) 63 (100%)
FS T2WI vs Gd FS T1WI Visible in Gd FS T1WI Not visible in Gd FS T1WI Sum
Visible in FS T2WI 31 (49.20%) 7 (11.11%) 38 (60.31%)
Not visible FS T2WI 15 (23.81%) 10 (15.88%) 25 (39.69%)
by the first and second observer, respectively. Details in the form of contingency tables are shown in Table1. The A2 pulley of the fifth finger was visible in 73% (8/11) and 82% (9/11) on T1WI, in 55% (6/11) and 45% (5/11) in FS T2WI, and in 64% (7/11) and 36% (4/11) on Gd FS T1WI when read by the first and second observer, respectively. Kappa inter-observer variability between the two observers for depiction of normal A2 pulley was moderate for all sequences: 0.55 (SE 0.23) for T1WI, 0.68 (SE 0.09) for FS T2WI, and 0.57 (SE 0.12) for Gd FS T1WI. Examples of normal and abnormal A2 pulleys are shown in Figs. 2, 3
and4.
Visualisation of the A2 pulley was limited by ghost artefacts in 9% (6/63) and 21% (14/63) on T1WI sequences, in 64% (43/63) and 81% (54/63) on FS T2WI sequences, and in 34% (23/63) and 60% (40/63) on Gd FS T1WI sequences when read by the first and second observer, respectively. Visualisation of the A2 pulley was limited by motion artefacts in 6% (4/63) and 10% (7/63) on T1WI, in 37% (25/63) and 40% (27/63) on FS T2WI, and in 22% (15/63) and 33% (22/63) on Gd FS T1WI, when read by the first and second observer, respectively. Thus, ghost artefacts were approximately 4–7 times more frequent in FS T2WI images than in T1WI images, and
approxi-Fig. 3 A 35-year-old woman, with detail of a normal A2 pulley of the fifth finger (black or white arrowheads) of the left hand in transverse T1-weighted (a), fat-saturated T2- weighted (b), and gadolinium-enhanced fat-saturated weighted (c) images. In this case, the T1-weighted image (a) allows better depiction of the fifth A2 pulley than
do the saturated T2-weighted (b) or gadolinium-enhanced fat-saturated T1-weighted (c) images. The A2 pulley of the fifth finger is smaller than that of the other fingers, but could be fully depicted in our series in more than 70% of cases in transverse T1-weighted sequences. D5 fifth finger, R right, L left
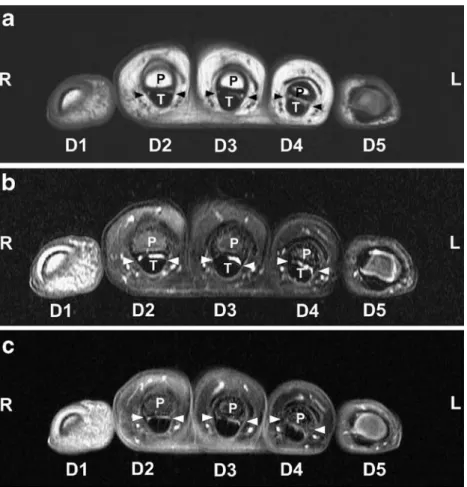
Fig. 2 A 25-year-old man with normal A2 pulleys (black or white arrowheads) of the index, long, and ring fingers of the right hand in transverse T1-weighted image (a), fat-saturated T2-weighted image (b) and gadolinium-enhanced fat-saturated T1-weighted image (c). In this case, the T1-weighted image (a) allows better depiction of the A2 pulleys than do the fat-saturated T2-weighted (b) or gadolinium-enhanced fat-saturated T1-weighted (c) images. Note that the thumb (D1) has been affected by arte-fact and appears in hyperintense signal in b and c because of inhomogeneous fat saturation. P first phalanx, T superficial and profound tendons, D2 index finger, D3 long finger, D4 ring finger, D5 fifth finger, R right, L left
mately 1.5–2 times more frequent than in Gd FS T1WI images. Motion artefacts were about 4–6 times more frequent in FS T2WI than in T1WI, and about 1.2–1.5 times more frequent than in Gd FS T1WI images.
A2 pulley lesions were clinically suggested in eight patients. Among these eight patients, both observers found seven abnormal A2 pulleys (one in the long finger, and six in the ring finger), with a 100% concordance. Gd FS T1WI was the best sequence to see lesions of the A2 pulley in 71% (5/7) for the first observer and in 86% (6/7) for the second observer. All but one of these eight patients had a favourable outcome with conservative treatment. Using the clinical follow-up as gold standard, we found that sensitivity, specificity, accuracy, and positive and negative predictive values were 88%, 100%, 95%, 100% and 93%, respectively.
Discussion
Recently, high-field MR scanners, in particular those of 3 T, have become increasingly available for clinical use. High-field MR imaging provides several benefits, including increased signal intensity, SNR, and spatial resolution, and decreased examination time [9–11]. Although there are some
disadvantages when they are compared with lower field MR scanners, including increased SAR, and susceptibility and flow artefacts, 3 T MR scanners have been reported to give better diagnostic performances in neurological and muscu-loskeletal imaging [9–11]. Especially, Saupe et al. compared 1.5 T and 3 T MRI of the wrist with a surface coil and found significantly better visibility of fine structures of the wrist, such as the triangular fibrocartilage complex and the scapholunate and lunotriquetral ligaments [9].
Using lower field strength MRI, Clavero et al. have mentioned visualisation of normal and ruptured A2 and A4 pulleys of fingers in a neutral position, with the advantage of fewer motion artefacts associated than with forced flexion [2]. Hauger et al. and Bencardino emphasised that the transverse plane proved to be more reliable than the sagittal plane for pulley depiction and offered optimal visualisation of the bony insertions of the pulleys [4, 7]. Therefore, in our studies, only the transverse plane was examined, with all fingers in a neutral position.
To simplify the statistical analyses, we decided to use only a“yes or no” scoring scale (visible or not, abnormal or not, with or without artefacts). This kind of binary scoring scale has been used by several authors in the field of musculoskeletal radiology [12,13]. We focused our study
Fig. 4 A 44-year-old woman with a lesion of the A2 pulley of the fourth finger (black or white arrowheads) of the right hand in transverse T1-weighted (a), fat-saturated T2- weighted (b), and gadolinium-enhanced fat-saturated T1-weighted (c) images. A small gap is seen on the ulnar side of the A2 pulley in the T1-weighted image (a), with hyperintense signal in the fat-saturated T2-weighted (b) and gadolinium-enhanced fat-saturated T1-weighted (c)
images. Note also the
“bow-stringing sign”, i.e. an augmented
distance between the first phalanx and the flexor tendon of the fourth finger. P first phalanx, T superficial and profound ten-dons, D1 thumb, D2 index finger, D3 long finger, D4 ring finger, D5 fifth finger, R right, L left
only on the A2 pulley, because the A2 is functionally the most important pulley, together with A4, and because ruptures of the other pulleys with an intact A2 pulley are infrequent [4,7]. Furthermore, A3 and A5 are not routinely imaged with MRI, even in cadaveric studies, and depiction of cruciform pulleys has no clinical implication [7].
A2 pulley depiction was high, almost 95%, for the both observers, on the T1WI sequence. By using a 3 T MR scanner, we found that our depiction rate was very close to the 100% depiction rate found by Hauger et al. in a cadaveric study with transverse T1WI imaging on a 1.5 T field [4]. A2 pulley depiction was much lower in FS T2WI sequences, approximately 60% for both observers, due to a lower spatial resolution and SNR and the presence of more ghost and motion artefacts.
As expected, depiction of the A2 pulley of the fifth finger was lower than that of the other fingers in all sequences, due to its small size, though it was still seen in more than 70% of cases on T1WI images for both observers. This could be a limitation of 3 T MRI, but we think this should have little consequence, because most pulley injuries are in either the third or fourth fingers [3,5]. Although the observers were blinded to clinical data, both of them found seven abnormal A2 pulleys among 63 fingers, with a perfect concordance. Gd FS T1WI was the best sequence for depiction of abnormal A2 pulleys. Only one A2 pulley lesion was not seen, in one patient.
We acknowledge that our study had several limitations. First, only three sequences were included, transverse T1WI, FS T2WI, and Gd FS T1WI. However, to our knowledge, no other sequences have proved to be superior in the imaging of finger pulleys. For example, Martinoli et al. and Hauger et al. used only T1WI and T2WI sequences in their studies [3, 4]. Second, systematic comparison with lower field 1.5 T MR imaging for each patient was not done. However, a significant improvement in the depiction of fine musculoskeletal structures of the wrist with 3 T versus 1.5 T MRI has already been proved by Saupe et al. [9]. Third, our group of patients was small and inhomogeneous. Thus, our results of sensitivity, specificity, accuracy and positive and negative predictive values must be considered only as preliminary results. Finally, because all our patients were conservatively treated, we had to use the clinical follow-up as a less reliable gold standard than surgery. Further studies with comparison with surgery are thus necessary to assess the sensitivity, specificity, accuracy, positive and negative predictive values, and the full impact of 3 T MRI in the treatment of abnormal pulleys.
Conclusion
The comparison between transverse T1WI, FS T2WI, and Gd FS T1WI sequences on 3 T MRI shows that transverse T1WI allows excellent depiction of the A2 pulley, that FS T2WI suffers from higher rates of motion and ghost artefacts, and transverse Gd FS T1WI is the best sequence for the depiction of the abnormal A2 pulley. Thus, a protocol consisting of transverse T1WI and Gd FS T1WI sequences should allow excellent visualisation of normal and abnormal A2 pulleys on 3 T MRI.
Acknowledgements We would like to thank Philippe Frascarolo for
his statistical analysis, and Philippe Clavel for his computer graphics work.
References
1. Doyle JR. Palmar and digital flexor tendon pulleys. Clin Orthop
Relat Res 2001; 383: 84–96.
2. Clavero JA, Alomar X, Monill JM, et al. MR imaging of ligament
and tendon injuries of the fingers. Radiographics 2002; 22: 237–256.
3. Martinoli C, Bianchi S, Cotton A. Imaging of rock climbing
injuries. Semin Musculoskelet Radiol 2005; 9: 334–345.
4. Hauger O, Chung CB, Lektrakul N, et al. Pulley system in the fingers: normal anatomy and simulated lesions in cadavers at MR imaging, CT, and US with and without contrast material distention of the tendon sheath. Radiology 2000; 217: 201–212.
5. Klauser A, Frauscher F, Bodner G, et al. Finger pulley injuries in extreme rock climbers: depiction with dynamic US. Radiology 2002; 222: 755–761.
6. Gabl M, Rangger C, Lutz M, et al. Disruption of the finger flexor pulley system in elite rock climbers. Am J Sports Med 1998; 26:
651–655.
7. Bencardino JT. MR imaging of the tendon lesions of the hand and
wrist. Magn Reson Imaging Clin N Am 2004; 12: 333–347.
8. Boutry N, Titecat M, Demondion X, et al. High-frequency ultrasonographic examination of the finger pulley system. J
Ultrasound Med 2005; 24: 1333–1339.
9. Saupe N, Prüssmann KP, Luechinger R, et al. MR imaging of the
wrist: comparison between 1.5- and 3-T MR imaging
—prelimi-nary experience. Radiology 2005; 234: 256–264.
10. Takahashi M, Uematsu H, Hatabu H. MR imaging at high
magnetic fields. Eur J Radiol 2003; 46: 45–52.
11. Bachmann R, Reilmann R, Schwindt W, et al. FLAIR imaging for multiple sclerosis: a comparative MR study at 1.5 and 3.0 Tesla. Eur Radiol 2006; 16: 915–921.
12. Robinson G, Chung T, Finlay K, et al. Axial oblique MR imaging of the intrinsic ligaments of the wrist: initial experience. Skeletal
Radiol 2006; 35: 765–773.
13. Mengiardi B, Pfirrmann CWA, Vienne P, et al. Medial collateral ligament complex of the ankle: MR appearance in asymptomatic