HAL Id: hal-01978499
https://hal.archives-ouvertes.fr/hal-01978499
Submitted on 11 Jan 2019
HAL is a multi-disciplinary open access
archive for the deposit and dissemination of sci-entific research documents, whether they are pub-lished or not. The documents may come from teaching and research institutions in France or abroad, or from public or private research centers.
L’archive ouverte pluridisciplinaire HAL, est destinée au dépôt et à la diffusion de documents scientifiques de niveau recherche, publiés ou non, émanant des établissements d’enseignement et de recherche français ou étrangers, des laboratoires publics ou privés.
Spatial variation of earthworm communities and soil
organic carbon in temperate agroforestry
Rémi Cardinael, Kevin Hoeffner, Claire Chenu, Tiphaine Chevallier, Camille
Béral, Antoine Dewisme, Daniel Cluzeau
To cite this version:
Rémi Cardinael, Kevin Hoeffner, Claire Chenu, Tiphaine Chevallier, Camille Béral, et al.. Spa-tial variation of earthworm communities and soil organic carbon in temperate agroforestry. Biology and Fertility of Soils, Springer Verlag, 2019, 55 (2), pp.171-183. �10.1007/s00374-018-1332-3�. �hal-01978499�
1
Spatial variation of earthworm communities and soil organic carbon in temperate agroforestry
Rémi Cardinaela,b,c,d*, Kevin Hoeffnere, Claire Chenub, Tiphaine Chevalliera, Camille Béralf,
Antoine Dewismee, Daniel Cluzeaue
a Eco&Sols, IRD, CIRAD, INRA, Montpellier SupAgro, Univ Montpellier, Montpellier, France
b UMR Ecosys, INRA, AgroParisTech,Université Paris Saclay, Avenue Lucien Brétignières,
Thiverval-Grignon, France
c CIRAD, UPR AIDA, F-34398 Montpellier, France (present address)
d AIDA, Univ Montpellier, CIRAD, Montpellier, France
e Univ-Rennes, CNRS, ECOBIO UMR 6553, Rennes, France
f AGROOF, 19 rue du Luxembourg, Anduze, France
*Corresponding author. E-mail address: remi.cardinael@cirad.fr
Keywords silvoarable system, alley cropping, earthworm abundance, earthworm diversity,
lumbricidae
Abstract
The aim of this study was to assess how soil organic C (SOC) stocks and earthworm
communities were modified in agroforestry systems compared to treeless control plots, and
within the agroforestry plots (tree rows vs alleys). We used a network of 13 silvoarable
agroforestry sites in France along a North/South gradient. Total earthworm abundance and
biomass were significantly higher in the tree rows than in the control plots, but were not
2
index, and species evenness were significantly higher in the tree rows than in the alleys. Total
abundance of epigeic, epi-anecic, strict anecic and endogeic was higher in the tree rows.
Surprisingly, earthworm individual weight was significantly lower in the tree rows than in the
alleys and in the control plots. SOC stocks were significantly higher in the tree rows compared
to the control plots across all sites. Despite higher SOC stocks in the tree rows, the amount of
available C per earthworm individual was lower compared to the control. The absence of
disturbance (no tillage, no fertilizers, no pesticides) in the tree rows rather than increased SOC
stocks therefore seems to be the main factor explaining the increased total abundance, biomass,
and diversity of earthworms. The observed differences in earthworm communities between tree
rows and alleys may lead to modified and spatially structured SOC dynamics within
agroforestry plots.
Introduction
Earthworms are a major component of the soil fauna in temperate climates (Lavelle 1988). They
are usually classified into three main ecological categories having different morphology,
physiology and behavior: epigeic, anecic, and endogeic (Bouché 1972, 1977; Potvin and
Lilleskov 2017). Briefly, epigeic earthworms live and feed on surface organic matter, anecic
make vertical or near-vertical burrows into which they incorporate varying amounts of surface
organic matter and feed on a mix of surface and soil organic matter, and endogeic earthworms
make horizontal or near-horizontal burrows and feed on humified soil organic matter. A
distinction between epi-anecic and strict-anecic earthworms are sometimes made (Bouché
1972, 1977). Epi-anecic earthworms burrow few galleries and mainly feed on fresh surface
organic matter whereas strict anecic earthworms mainly feed on soil humified organic matter
burrowing a large network of galleries (Bouché and Kretzschmar 1974; Kretzschmar 1977;
3
are involved in numerous ecosystem services such as pedogenesis, soil structure formation,
nutrient cycling and climate regulation through soil organic carbon (SOC) sequestration
(Lavelle et al. 2006; Blouin et al. 2013; Bertrand et al. 2015), through their burrowing activity
and through their casts that are nutrient-rich compared to the bulk soil (Saharan and Singh 1988;
Tian et al. 2000; Hmar and Ramanujam 2014).
The assembly of earthworm community is driven by several environmental factors, such
as the biogeographical history of the region, broad habitat constraints (microclimate and soil
properties), land use constraints and internal community constraints (competition or
facilitation) (Decaëns et al. 2008). In agricultural landscapes, land use and land management
can modify earthworm abundance and diversity (Decaëns et al. 2003; Smith et al. 2008b; Pelosi
et al. 2009; Cluzeau et al. 2012; Frazão et al. 2017) and consequently impact ecosystem services
provided by earthworms (Lavelle 1997, 2006; Jouquet et al. 2006). For example, Ponge et al.
(2013) observed across 109 sites that agricultural fields exhibited a lower anecic earthworm
abundance than grasslands. Slurry application only enhanced endogeic earthworm abundance
whereas epigeic earthworm abundance was not influenced by neither land use nor management.
At the plot scale and in cropping systems, Chan (2001) highlighted that anecic abundance tends
to decline under tillage whereas endogeic abundance can increase especially under organic
fertilization. A recent meta-analysis confirmed that epigeic and anecic earthworms were the
most sensitive ecological groups to conventional tillage (Briones and Schmidt 2017). Several
studies have observed that total earthworm abundance, biomass and richness were greater in
field margins than in cultivated fields (Smith et al. 2008a; Nieminen et al. 2011; Roarty and
Schmidt 2013; Crittenden et al. 2015).
Agroforestry systems include very diverse farming systems where trees and crops are
grown in intimate combination (Nair 1993). In temperate regions, silvoarable systems
4
trees, pastures and livestock, are the most widespread types of agroforestry. In temperate
silvoarable systems, trees are planted in parallel rows, and the space between trees along the
rows are usually untilled, unfertilized, and covered by a natural or sown herbaceous vegetation.
In tropical systems, several authors have shown that total earthworm abundance, biomass and
activity were increased in alley cropping compared to adjacent agricultural plots (Hauser 1993;
Hauser et al. 1998; Fonte et al. 2010). In temperate regions, very few studies have been
performed, but Price and Gordon (1999) observed in a silvoarable system in Canada a higher
earthworm abundance and biomass in the tree row than in the cropped alley. Several
explanations have been proposed to explain the higher occurrence of earthworms in
agroforestry tree rows, especially the shading effect of trees, the lower soil temperature, the
higher soil moisture (Tian et al. 2000), the lower level of soil disturbance (Hauser et al. 1998),
and the higher amount of food, i.e., organic matter (Araujo and López-Hernández 1999; Frouz
et al. 2009). SOC stocks are indeed usually increased in silvoarable systems compared to
treeless agricultural fields (Chatterjee et al. 2018; de Stefano and Jacobson 2018; Feliciano et
al. 2018; Shi et al. 2018, Cardinael et al. 2018a), especially in tree rows (Bambrick et al. 2010;
Wotherspoon et al. 2014; Cardinael et al. 2015a, 2017). This additional food supply could
positively affect earthworm individual weight (Shipitalo et al. 1988).
Due to the lower level of soil disturbance, the higher amount of food and buffered
microclimatic conditions, tree rows could therefore represent favorable habitats for earthworm communities’ development, especially for epigeic and anecic earthworms, potentially enabling them to colonize the cropped alleys. However, previous studies on earthworm communities in
agroforestry systems have never taken into account the earthworm ecological categories or
species susceptible to respond differently to specific properties in agroforestry system.
The objectives of this study were thus to i) compare earthworm communities and SOC
5
distribution of earthworm communities and SOC stocks between tree rows and alleys within
the agroforestry plots.
Firstly, we hypothesized that total earthworm abundance, biomass, diversity, and
earthworm individual weight would be higher in the agroforestry plots compared to the control
plots, especially in the tree rows. Secondly, we hypothesized that the abundance of epigeic and
anecic earthworms would be higher in the tree rows than in the alleys and control plots.
Material and methods Site description
We selected a network of 13 agroforestry plots in France along a North/South gradient. Soil
properties as well as the soil use and management varied greatly across sites. Briefly, the age
of agroforestry sites ranged from 6 to 41 years and tree density from 35 to 200 trees ha-1. In
addition, soil pH ranged from 5.8 to 8.4 while clay content ranged from 100 to 530 g kg-1.
(Table 1). Each site comprised an agroforestry plot, and an adjacent agricultural control plot.
Agroforestry alleys and control plots have been managed strictly the same way (soil tillage,
crop rotation, fertilization) since the tree planting. A detailed description of the sites can be
found in the supplementary materials. Due to time and budget constraints, not all sites have
been sampled for both earthworms and SOC (see below).
Quantification of soil organic carbon stocks
SOC stocks at the CH, ME, RE, SJ and VZ sites were measured in a previous study using an
intensive soil sampling (Cardinael et al. 2017). In this study, we measured SOC stocks at BE,
BO, LB, PS, SJM and VER sites using a simplified sampling protocol. The SA and SM sites
were not sampled for SOC stocks (Table 1). At the BE and PS sites, only the agroforestry plots
6
Table 1. Description of the agroforestry sites. Site Location Soil texture
clay/silt/sand (g kg-1) Soil pH Age (yrs)/ Plantin g date Tree row/Alley width (m) Density (trees ha-1) Crop management Tree species
Crops Sampling locations C Earthworms BE 0°58'37.5"E, 46°32'24.4"N 297/325/378 7.1 8/2007 2/26 48 Conventional-Reduced tillage Mixed species Rapeseed, Wheat, Barley AF AF, C BO 0°07'45.4"E, 45°12'39.4"N 447/346/207 8.1 8/2007 3/27 48 Conventional, Tillage
Poplar Maize AF, C AF
CH 1°17'58"E, 48°06'08"N 195/705/100 7.0 6/2008 2/24 34 Conventional, Tillage Hybrid walnut
Wheat, Rapeseed AF, C AF, C
LB 2°03'52.5"E, 49°28'25.6"N 246/603/151 8.0 6/2009 2/28 83 No pesticides, reduced tillage Mixed species Rapeseed, Wheat, Barley AF, C AF, C ME 0°10'37"W, 46°11'54"N 250/645/105 5.8 6/2008 2/27 35 Conventional, Tillage Hybrid walnut Wheat, Rapeseed, Sunflower AF, C AF, C PS 0°12'58.9"W, 47°49'18.1"N 235/247/518 - 8/2007 3/27 67 or 33 Conventional, No-tillage Mixed species Rapeseed, Wheat, Vetch-Peas, Barley, Sorghum AF AF, C RE 04°01'E, 43°43'N 175/410/415 8.0 18/199 5 2/11 110 Conventional, Tillage Hybrid walnut Durum wheat, Rapeseed, Chickpea AF, C AF SA 0°02'53.9"W, 45°27'06.8"N - - 6/2007 5/20 65 Direct seeding, cover crops Mixed species Cereals - AF, C SJ 0°13'57"W, 46°00'39"N 530/390/80 7.7 41/197 3 2/12 102 Conventional, Tillage Black walnut Sunflower, Wheat, Barley AF, C AF, C
7 SJM 0°02'28.7"W, 46°54'19.0"N 329/355/316 8.4 9/2006 3/24 35 Conventional, Tillage Mixed species Maize AF, C AF SM 0°30'42.9"W, 46°23'57.6"N 240/612/148 8.0 5 or 7/ 2008 or 2010 2/25 40 Organic, No-tillage Mixed species Cereals - AF VER 2°48'56.4"E, 49°40'03.3"N 199/684/117 8.1 7/2008 2/28 46 Conventional, reduced tillage Mixed species Beetroot, Wheat, Field bean, Rapeseed AF, C AF, C VZ 4°06'37"E, 44°03'29"N 100/390/510 8.3 18/199 5 2/9 100 Organic, Tillage Hybrid walnut Rapeseed, Wheat, Potato, Garlic AF, C AF
The age correspond to the age of the agroforestry plot at the time of soil sampling for C analysis, except for the sites with no soil C data where the age corresponds to the time of earthworm sampling. Tree density
corresponds to the agroforestry tree density. The crop management was the same in both the alleys and control plots.
AF: agroforestry plot, C: control plot (treeless).
BE, Béthines; BO, Bonnes; CH, Châteaudun; LB, Lasalle Beauvais; ME, Melle; PS, Parcé-sur-Sarthe; RE, Restinclières; SA, Aulaix-la-Chapelle; SJ, Jean-d’Angély; SJM, Jouin-de-Marnes; SM,
Saint-Maxire ; VER, Verpillères; VZ, Vézénobres.
8
heterogeneity within agroforestry plots. In total, SOC stocks were therefore measured on 11
agroforestry sites, with 9 sites sampled in both agroforestry and control plots.
Soil samples were taken every 10 cm from the surface to a depth of 30 cm using
500-cm3 cylinders. In the tree rows of silvoarable systems, soil samples were taken at 1 m from a
randomly chosen tree and at the half distance between two trees (Fig. 1). In the alleys, soil
samples were taken at 1 m from the tree row and in the middle of the alley (Fig. 1). This
sampling protocol was repeated three times in the agroforestry plots, around three different
trees. In treeless agricultural plots, soil samples were collected at three to six different points
spaced of 15 m. At each site, the bulk density (g cm-3) was measured at tree sampling points,
one in the tree row, one in the middle of the alley, and one in the control plot.
After air-drying in the lab, soil cores were sieved to 2 mm and weighed without coarse
particles >2 mm. Sub-samples for bulk density determination were oven-dried at 105°C for 48
h. The bulk density (g cm-3) was calculated as the ratio of the dry mass of fine soil (<2 mm) to
the cylinder volume. Sub-samples for organic C concentrations were dried at 40°C and ball
milled until they passed through a 200 mm mesh sieve. These sub-samples were then analyzed
using a CHN elemental analyzer. SOC stocks were calculated on an equivalent soil mass basis
(Ellert and Bettany 1995).
Earthworm collection and laboratory analyses
To fulfill the first objective, earthworms were collected at 8 silvoarable sites (BE, CH, LB, ME,
PS, SA, SJ, VER) in both the agroforestry and the adjacent control plots (Table 1). In addition,
to complete the second objective, five other sites (BO, RE, SJM, SM, VZ) were also sampled
in the agroforestry plot only. Therefore, 13 sites were used to study the spatial heterogeneity of
9
Figure 1. Sampling design for the silvoarable sites. This sampling protocol for earthworm
communities and SOC was repeated three times in the agroforestry plots, around three
different trees. L is the distance between tree rows, d is the distance between trees on
the rows. SOC: soil organic C.
Earthworms were collected at each site during their maximum biological activity in
March/April. In the tree rows of silvoarable systems, earthworms were sampled in the same
direction at 2.5 m from a randomly chosen tree and at the mid-distance between two trees (Fig.
1). If spacing between trees along the tree rows was lower than 5 m, only the point at 2.5 m was
10
from the tree and in the middle of the alley (Fig. 1). These sampling points were repeated three
times (around three different trees). Therefore, earthworms were sampled at 6 different points
per site in the tree rows and alleys. In treeless agricultural plots, earthworms were collected in
the middle of the plot, at three different points at 6 m distance.
Earthworms were sampled following the normalized protocol ISO 23 611-1, that was
modified and validated during the RMQS BioDiv programme (Cluzeau et al. 2012). It
combined a chemical and manual extraction. Briefly, three watering phases with 10 L of an
increasing concentration of formaldehyde (0.25, 0.25 and 0.4%) were applied on 1 m2 delimited
with a frame. After each watering, earthworms were collected during 15 minutes. To recover
earthworms that have not reached the surface, a manual hand sorting inside the sample square
was then carried out on a soil cube (25 × 25 × 20 cm, length × width × depth) corresponding to
a surface of 1/16 m². Earthworms were fixed and stored in formaldehyde (0.4%) at room
temperature.
Earthworms were identified to the species level based on morphological criteria
(Bouché 1972), and classified into ecological categories defined by Bouché (1972, 1977):
epigeic, endogeic, and anecic with a distinction between epi-anecic and strict-anecic
earthworms.
Each earthworm individual was then weighted +/- 10 mg (fresh formalin weights, full digestive
tract) and assigned a stage of development, juvenile, sub-adult or adult. In total, about 24 000
earthworms were collected, identified at the species level and weighted. The number of hand
sorted earthworms (HS) was multiplied by 16 to estimate the correct number per square meter.
It was then added to the number of earthworms counted with the formaldehyde (F) to obtain
the total amount of earthworms (FHS, Eq.1):
11
Earthworm diversity was analyzed through three indices, total richness, Shannon index, and the
species evenness.
Statistical analysis
One silvoarable site (VZ) associated organic vegetables, while all the other sites concerned
arable crops. These sites were analyzed separately. To study the spatial distribution (tree rows
vs alleys) of SOC or earthworms within silvoarable sites, we included all sites where the
agroforestry plot was measured. When comparing agroforestry and control plots in terms of
SOC or earthworms, we only included sites where both plots were sampled. No significant
differences were found between SOC stocks and earthworm communities sampled at different
distances from the tree, either in the tree rows or in the alleys (data not shown). Samples were
therefore combined, and analyses were performed for three distinct modalities: tree rows,
alleys, and controls.
We used statistical analyses commonly applied in meta-analysis or experimental
network analysis (Makowski et al. 2018). For each location (tree row, alley, control) at each
site, we calculated means and standard deviations of the different sampling points for SOC
stocks, earthworm total abundance and biomass, earthworm ecological category abundance,
total richness, Shannon index, and the species evenness. These means and standard deviations
were used to calculate for each site the following effect sizes and their associated confidence
intervals. The first one was the ratio of a given variable observed in the tree row to the one
observed in the control. The second effect sizes compared alleys to control plots. A last effect
size was calculated to study spatial heterogeneity within the agroforestry plot, and was the ratio
of a given variable observed in the tree row to the one observed in the alley. A logarithm
conversion was then applied to each effect size to center the values around zero. In order to
random-12
effect model and a restricted maximum likelihood (REML) approach the using the nlme
package (Pinheiro et al. 2013). Each site was considered as a random factor, making the results
obtained on this experimental network more generalizable.
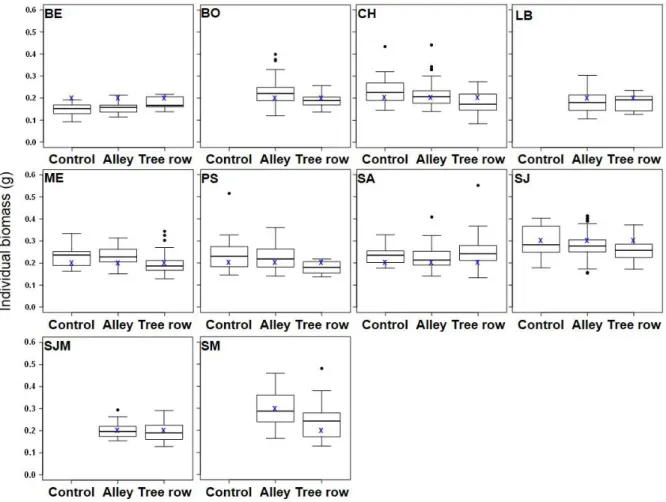
For the earthworm individual biomass, we only selected sites where species were
represented by at least three individual adults in at least two of the three locations (tree row,
alley and agricultural plot). Differences in earthworm individual biomass were compared
species by species, location by location, and site by site. As the individual biomass of
earthworms depends on each species, it is not relevant to compare absolute values between
locations and sites. The individual weight of each earthworm species in the alleys and control
at a given site were compared to the weight of same species in the tree rows, and expressed as
a relative weight. The difference relative weights of each species were then averaged for each
ecological category, location and site. For each earthworm ecological category, we used a
linear mixed-effects model using lme4 package (Bates 2010) with sites as a random factor,
followed by Tukey HSD tests for post hoc pairwise comparisons to test differences in
earthworm individual biomass between tree rows, alleys and control plots. The full list of
earthworm species identified per site and location is available in Table S1 in the supplementary
materials.
Statistical analyses were performed using R software, version 3.1.1 (R Development Core Team
2013). Significance was evaluated in all cases at p-value<0.05.
Results
Agroforestry effect on SOC stocks
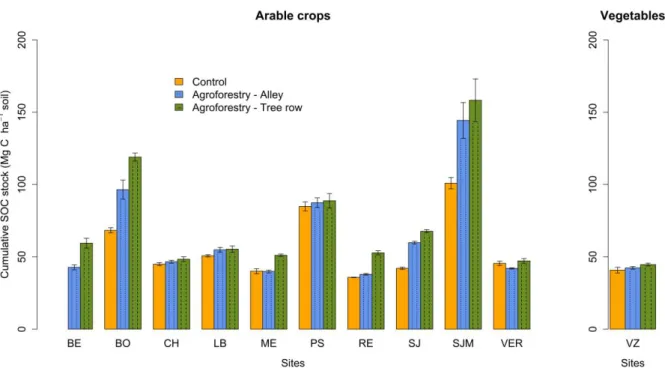
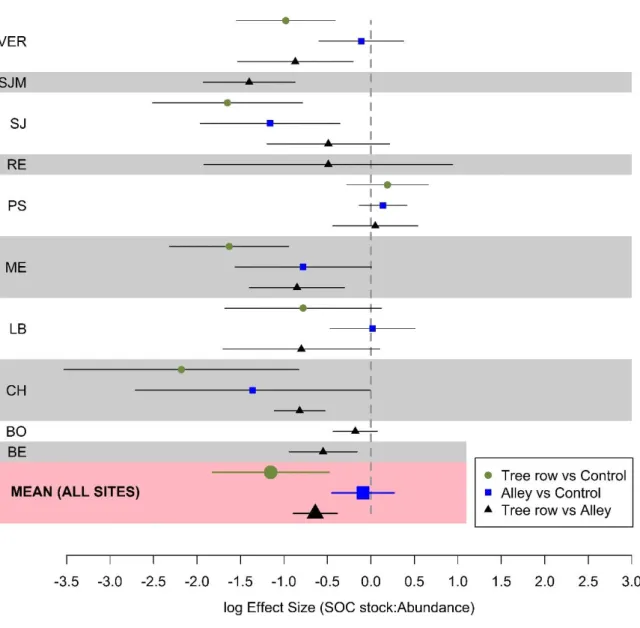
The SOC stocks varied greatly between sites, reflecting various soil types and historical
management (Fig. 2). Mean SOC stocks in 0-30 cm were significantly higher in tree rows
13
between alleys and control plots across the sites (p-value = 0.07). Mean SOC stocks in 0-30 cm
were significantly higher in the tree rows than in the alleys across the silvoarable sites (p-value
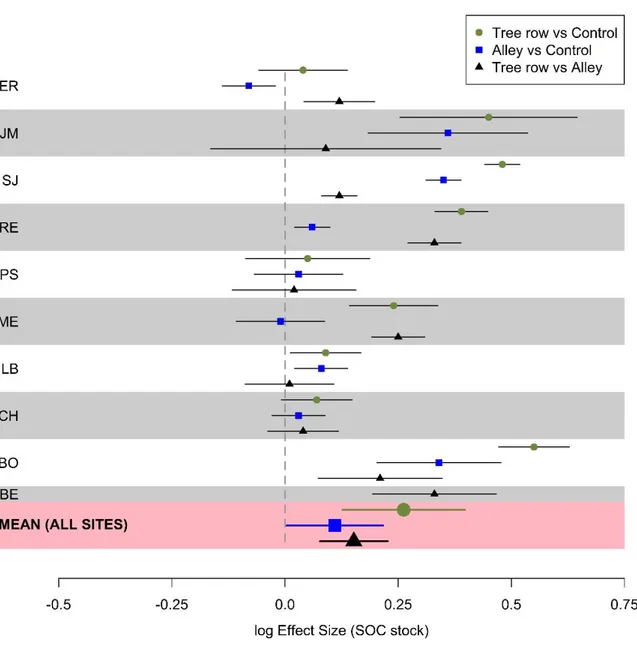
= 0.003) (Fig. 3). Site-specific log effect sizes for SOC can be seen in the supplementary
materials (Fig. S1).
Figure 2. Soil organic C stock (Mg C ha-1) in 0-30 cm at the different agroforestry sites. Error
bars represent standard errors.
Across the 9 silvoarable sites (average age 12.1 years) where the three modalities where
sampled (BO, CH, LB, ME, PS, RE, SJ, SJM, VER) for SOC, the mean (± 95% confidence
intervals) delta SOC stocks were 19.46 ± 13.77 and 10.66 ± 10.35 tC ha-1 between tree rows
14
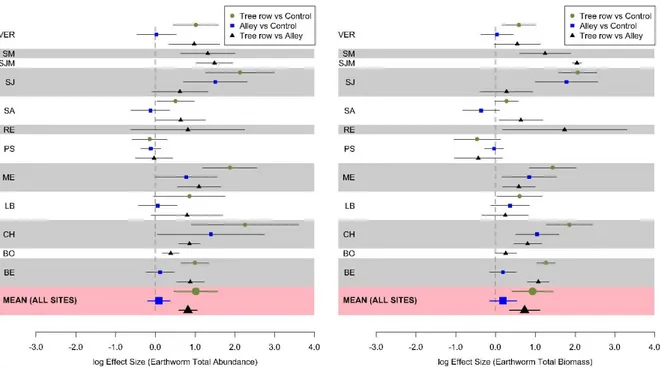
Figure 3. Mean log effect sizes of SOC stocks (0-30 cm), earthworm total abundance and
biomass, and earthworm species richness between tree rows and control plots, alleys
and control plots, and tree rows and alleys at the different silvoarable sites (excluding
the VZ site with organic vegetables). Error bars represent confidence intervals.
Total earthworm abundance and biomass
Total earthworm abundance varied a lot between sites (Fig. 4). In general, the total earthworm
abundance followed the same patterns across the silvoarable sites: tree rows >> alleys ≥
controls. At the VZ site (organic vegetables), earthworm total abundance was higher in the
15
Figure 4. Distribution of earthworm mean total abundance in the four ecological categories at
the different agroforestry sites and modalities. C, Control; A, Alley; R, Tree row. Error bars
represent standard errors for total earthworm abundance. For the sites BO, RE, SJM, SM and
VZ, the control plots were not sampled for earthworms (see Table 1).
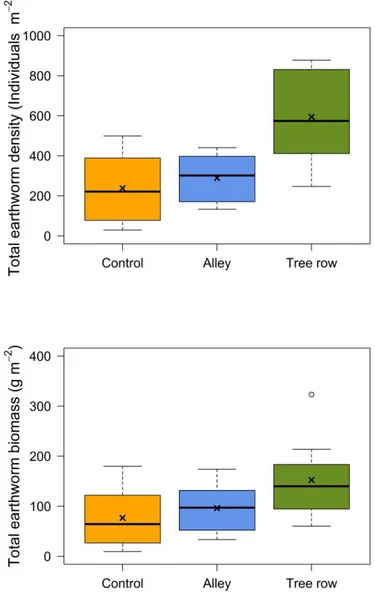
For the eight silvoarable sites where the three modalities (control, alley, tree row) were
sampled, the mean total earthworm abundances and associated 95% confidence intervals were
238 ± 124, 289 ± 85, and 595 ± 168 individuals m-2 in the control, alleys, and tree rows of
silvoarable sites, respectively (Fig. 5). Mean total earthworm abundance in the tree rows was
therefore 150% higher than in the control, 106% than in the alleys, and earthworm abundance
in the alleys was 21% higher than in the control. The corresponding mean total earthworm
biomasses and associated 95% confidence intervals were 77 ± 44, 96 ± 34, and 152 ± 58 g m-2,
respectively (Fig. 5).
Mean earthworm total abundance and total biomass were not significantly different
between alleys and control plots across the sites (p-value = 0.55 and 0.29, respectively).
However, they were significantly higher in the tree rows than in the control plots across all sites
16
biomass were also significantly higher in the tree rows than in the alleys across the agroforestry
sites (p-value < 0.001 and p-value = 0.003, respectively) (Fig. 3). Site-specific effects are
detailed in the supplementary materials (Fig. S2).
Figure 5. Total earthworm abundance and biomass in the control, alleys, and tree rows of the 8
silvoarable sites where the three modalities (control, alley, tree rows) were sampled.
The following sites are concerned: BE, CH, LB, ME, PS, SA, SJ, VER. Upper and
lower edges of boxes indicate 75th and 25th percentiles, horizontal lines within boxes
17
percentiles, and crosses indicate arithmetic means. Outliers are plotted as individual
points.
Earthworm ecological categories
A total of 20 species of Lumbricidae were identified across the agroforestry sites, with several
representatives of the four ecological categories (Table S1). Total abundance was largely
dominated by endogeic species such as Allolobophora chlorotica chlorotica or Aporrectodea
caliginosa caliginosa, whereas total biomass was mainly driven by large-sized anecics (such as Aporrectodea longa).
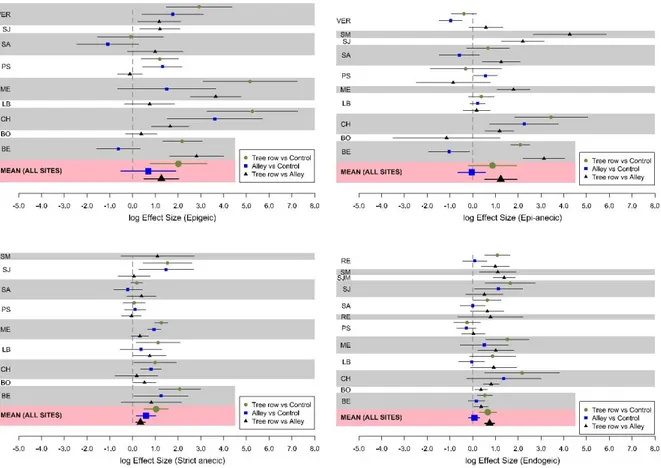
Endogeic were the most abundant earthworms across all sites (Fig. 4). Across the eight
silvoarable sites (BE, CH, LB, ME, PS, SA, SJ, VER) where the three modalities were sampled,
mean endogeic abundances and associated 95% confidence intervals were 169.2 ± 82.3, 202.7
± 68.6, and 387.6 ± 130.0 ind m-2 in the controls, alleys and tree rows, respectively. Mean
epigeic abundances and associated 95% confidence intervals were 8.6 ± 9.0, 15.5 ± 9.9, and
83.8 ± 62.6 ind m-2 in the controls, alleys and tree rows, respectively. The abundance of epigeic,
strict anecic, and endogeic was significantly higher in the tree rows than in the control plots
across the silvoarable sites (p-values = 0.02, 0.006, and 0.009, respectively) (Fig. S3), but no
difference was observed for the epi-anecic (p-value = 0.16). In the alleys, only the abundance
of the strict anecic was significantly higher than in the control plots (p-value = 0.03). Within
silvoarable plots, the mean abundance of each earthworm ecological category was significantly
higher in the tree rows than in the alleys (p-values = 0.01, 0.009, 0.007, and <0.0001 for epigeic,
strict anecic, epi-anecic, and endogeic earthworms, respectively) (Fig. S3).
18
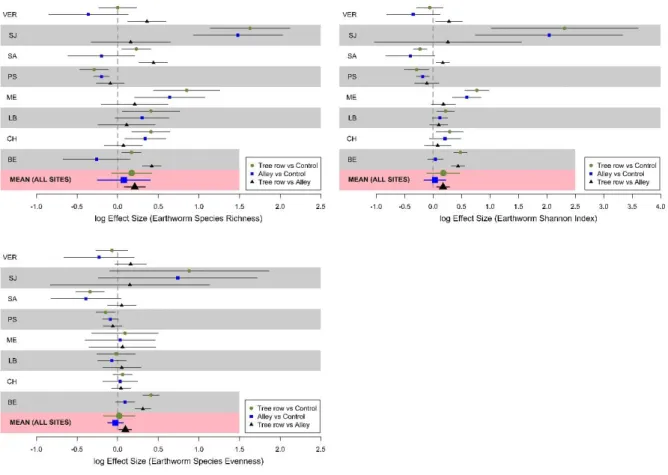
Across the eight silvoarable sites (BE, CH, LB, ME, PS, SA, SJ, VER) where the three
modalities were sampled, earthworm species richness was 5.3, 6.1, and 7.3 for the controls,
alleys and tree rows, respectively. This indicator was significantly higher in the tree rows than
in the alleys within agroforestry plots (Fig. 3). However, it was not significantly different either
between tree rows and control plots or between alleys and control plots across the sites (Fig. 3).
The same results were obtained for the Shannon index and the species evenness (Fig. S4).
Earthworm individual weight
The ANOVA revealed that the earthworm individual weight did not significantly vary across
sites (p-value = 0.629). However, the individual weight significantly depended on the location
(p-value < 0.001) and on the ecological category (p-value = 0.002). The interaction between the
location and the ecological category was also significant (p-value < 0.001). Adult individual
mean weights of epigeic, epic-anecic, strict anecic and epigeic species ranged from 0.05 to 0.43
g, 0.41 to 8.80 g, 0.84 to 5.78 g, and 0.03 to 0.89 g, respectively. An example of earthworm
individual weight across the sites and locations is shown in Figure S5 for Allolobophora
chlorotica chlorotica species.
Adult individual mean weights of epigeic and epi-anecic species were significantly
higher in the controls (+26 and +27%, respectively) and in the alleys (+14 and +13%,
respectively) compared to the tree rows (Fig. 6). Adult individual mean weight of endogeic
adults was significantly higher in the alleys and in the controls (+6 and +7%, respectively) than
in tree rows (Fig. 6). Surprisingly, there was no difference between the adult individual weight
of strict anecic species in the tree rows and the alleys (+6%) but they were significantly lighter
19
Figure 6. Relative adult earthworm weights in controls and alleys compared to tree rows
according to the ecological category a) epigeic, b) epi-anecic, c) strict anecic and d)
endogeic. Values are arithmetic means and error bars represent standard errors; n:
number of individuals. Different letters denote significant differences among relative
adult earthworm weight with a>b>c (Tukey test results).
Discussion
Spatial variation of SOC stocks
We found that SOC stocks were not significantly higher (p-value = 0.07) in the alleys than in
20
within this experimental network (3 sites older than 15 years, 10 sites younger than 10 years).
However, this study confirms previous results showing that SOC stocks in silvoarable systems
are significantly higher in the tree rows than in the alleys and control plots (Bambrick et al.
2010; Cardinael et al. 2015a, 2017). Cardinael et al. (2018b) found that in an 18-year-old
silvoarable system (110 trees ha-1), tree rows received two times more organic C inputs
compared to the control plot and 65% more than alleys. The additional organic inputs came
from litterfall, from tree root mortality (Cardinael et al. 2015b; Germon et al. 2016), and also
from the herbaceous vegetation growing between the trees (Cardinael et al. 2018b). In this
study, SOC stocks in young silvoarable plots were found to be increased mainly in the tree
rows, which could be ascribed to this herbaceous vegetation, analogous to grassland strips.
Finally, tree rows are usually untilled, and a higher aggregate stability could contribute to SOC
sequestration (Udawatta et al. 2008).
Higher earthworm abundance, biomass and richness in tree rows
In general, total earthworm abundance, biomass and richness were higher in the tree rows than
in the alleys and in the control plots. Only the abundance of epi-anecic earthworms and the
richness between tree rows and control plots were not different. These results are similar to
those observed in grassy or hedge field-margins of arable fields. As previously observed by
Smith et al. (2008a), Nieminen et al. (2011), Roarty and Schmidt (2013) and Crittenden et al.
(2015), earthworm abundance, biomass and richness were often higher in field margin than
further in the agricultural field. It is well known that soil disturbance, food supply and soil
physical properties like soil moisture and compaction affect earthworm communities (Lee
1985; Curry 1998; Chan, 2001; Capowiez et al. 2009; Pelosi et al. 2014; van Capelle et al.
2012). It is therefore likely that the greater abundance, biomass and diversity in the tree rows
21
grasslands compared to croplands (Curry 1998). However, with some agricultural practices
such as manure addition, diversified rotations and reduced tillage, Lagerlöf et al. (2002)
observed higher abundance in cropland than in field margins. Hof and Bright (2010) observed
opposite results with a higher earthworm total abundance and biomass in croplands at 20 m
from a grassy field margin than without grassy field margin. At the VZ silvoarable site
associating hybrid walnut trees with organic vegetables, alleys were usually amended with
poplar ramial chipped wood. This increase in the trophic resource for earthworms could explain
their higher abundance in the alley than in the tree row at this site. Pérès et al. (1998) also found
an increase in earthworm abundance after application of fresh poplar bark. In addition, the PS
site was managed under no-tillage practices, which could explain the similar earthworm
abundance between the alleys and tree rows (Chan 2001). Inter-site variability could also be
explained others factors like soil characteristics, tree density and age, tree species composition,
tree row plant community characteristics, management of the tree row (sown or spontaneous vegetation, mowing…), but due to a lack of data, we were unable to test it. Tree species composition and herbaceous tree row plant community could indeed result in quantitatively and
qualitatively different litter inputs and varying plant effects on belowground conditions because
of different root densities and characteristics.
Are tree rows an earthworm source for the cropped alleys?
In our study, earthworm communities were not very different between the alleys and the control
plots. Moreover, no difference was found between the earthworm abundance collected in the
alleys close to the tree rows or in the middle of the alleys. This finding is similar to results
observed with field margins, suggesting that tree rows are a favourable habitat but do not serve
as a source of earthworms for the alleys. Despite a higher earthworm abundance, biomass or
22
observe an increase of in-field earthworm populations as usually documented for more mobile,
aboveground invertebrate taxa through colonization or spill-over effects. They therefore
suggested that earthworm populations inside agricultural fields rely on residual, surviving
in-field populations, rather than on immigration from surrounding land. Nevertheless, earthworms
are also mobile species, their dispersal rate and distance vary between groups of earthworms
(Eijsackers 2011) but this mobility is affected by other factors, such as agricultural practices
(Nieminen et al. 2011) or climatic conditions (Cluzeau 1992). Nuutinen et al. (2011) found that
margins could have importance as a source for epi-anecics when they invade a new arable
habitat. The complexity of earthworm dispersion dynamics between the tree row and the alley
could be further studied using molecular tools to distinguish sub-populations (Mathieu et al.
2010; Dupont et al. 2015, 2017) or earthworm tagging (Butt et al. 2009; Mathieu et al. 2018).
Some studies have shown a earthworm species-related mobility, from 4.5 meters per year for
Lumbricus terrestris (Hoogerkamp et al. 1983), 5.9-6.7 meters per year for Aporrectodea longa
(Schon et al. 2014), up to 6.3 meters per year for all the earthworm community (Ligthart and
Peek 1997). Zeithaml et al. (2009) and Hof and Bright (2010) observed an abundance of
earthworms greater at 20 or 25 m from the field margin than at 5 or 10 m from the field margin
but the reasons are not clear. Our results also revealed that strict-anecic earthworms abundance
was overall higher in alleys than in control plots. This ecological category could potentially
benefit from the local microclimate and organic matter brought by trees in the agroforestry
system. Strict-anecic earthworms are geo-saprophagous, meaning that they consume highly
humified soil organic but also decaying organic matter and could benefit from increased SOC
stocks (Bouché and Kretzschmar 1974; Kretzschmar 1977; Ferrière 1980). In a previous study,
Cardinael et al. (2015a) found that most of the additional SOC in agroforestry compared to
control plots was made decaying particulate organic matter (200-2000 and 50-200 µm). This
23
which are more geophagous, and explain why the abundance of endogeic earthworm was not
enhanced in alleys compared to control plots.
Effect of earthworm density on individual weight
Within each ecological category, earthworm individual biomass was at the lowest in the tree
rows. Tree rows were characterized by a high density of earthworms compared to the control
plots. A similar pattern could be observed to a lesser extent between the tree row and the alley,
as epigeic, epi-anecic and endogeic individual biomass were also smaller in the tree rows
compared to the alley. The negative relationship between earthworm abundance and individual
biomass, observed in our study, has already been shown in laboratory experiment with different
earthworm density gradients (Neuhauser et al. 1980; Hartenstein and Amico 1983; Butt et al.
1994), but to our knowledge, this is the first study revealing this phenomenon in situ. Butt et al.
(1994) suggested that this density effect was not a function of food deprivation as excess feed
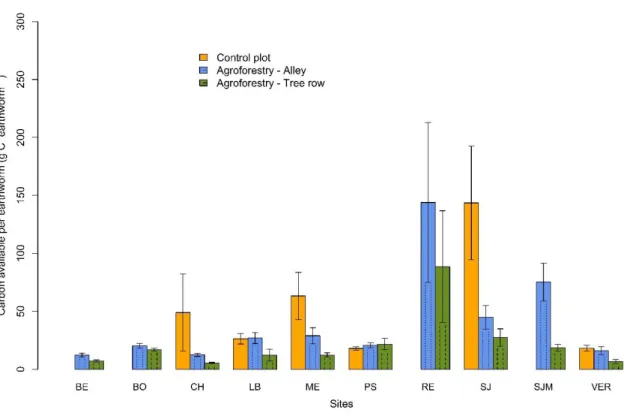
was provided. Here, despite increased SOC stocks, the amount of available total organic C per
earthworm individual was lower in the tree rows than in the control plots due to their higher
total abundance (Fig. 7, S6, S7). This suggests a higher intra and/or inter-specific competition
in the tree rows. Similarly to what we observed in the tree rows, Butt et al. (1994) also showed
in a laboratory experiment that a larger density of Lumbricus terrestris had a negative effect on
growth rate and on final earthworm individual weight, but resulted in a greater total biomass.
A lower earthworm individual weight could potentially impact their provision of ecosystem
services, but also the population dynamics (Lavelle 1983). For instance, Hoeffner et al. (2018)
observed that surface litter incorporation by epi-anecic earthworms was not dependent on the
24
Figure 7. Log effect size of the ratio between SOC stocks (0-30 cm) and total earthworm
biomass. Error bars represent confidence intervals.
Conclusions
This study showed that earthworm communities and SOC stocks were modified in agroforestry
systems. More precisely, we found that earthworm total biomass and abundance were much
higher in the tree rows than in the cropped alleys or than in the control plots. A similar results
was observed for SOC stocks. However, tree rows did not seem to serve as a source of
earthworms for the alleys. Finally, despite higher SOC stocks, adult earthworm individual
weights were found to be lower in the tree rows than in the cropped alleys, probably due to intra
and/or inter-specific competition. Further studies are needed to assess how earthworm activities
and subsequent ecosystem services could be modified in agroforestry systems.
Acknowledgments
This study was financed by the French Environment and Energy Management Agency
(ADEME), following a call for proposals as part of the REACCTIF program (Research on
25
project AGRIPSOL (Agroforestry for Soil Protection), coordinated by AGROOF. Rémi
Cardinael’s PhD thesis was co-funded by La Fondation de France and ADEME. Kevin Hoeffner’s PhD thesis was funded by a grant of the French Ministry of Research. We thank Hoël Hotte and Morgane Ollivier for their technical assistance during the earthworm field
sampling.
References
Araujo Y, López-Hernández D (1999) Earthworm populations in a savanna-agroforestry system of Venezuelan Amazonia. Biol Fertil Soils 29:413–418.
Bambrick AD, Whalen JK, Bradley RL, Cogliastro A, Gordon AM, Olivier A, Thevathasan NV (2010) Spatial heterogeneity of soil organic carbon in tree-based intercropping systems in Quebec and Ontario, Canada. Agrofor Syst 79:343–353.
Bates DM (2010) lme4: Mixed-effects modeling with R. 145p.
Bertrand M, Barot S, Blouin M, Whalen J, de Oliveira T, Roger-Estrade J (2015) Earthworm services for cropping systems. A review. Agron Sustain Dev 35:553–567.
Blouin M, Hodson ME, Delgado EA, Baker G, Brussaard L, Butt KR, Dai J, Denddoven L, Pérès G, Tondoh JE, Cluzeau D, Brun JJ (2013) A review of earthworm impact on soil function and ecosystem services. Eur J Soil Sci 64:161–182.
Bouché MB (1972) Lombriciens de France: écologie et systématique. Institut National de la Recherche Agronomique
Bouché MB (1977) Stratégies lombriciennes. Ecol Bull 25:122–132.
Bouché MB, Kretzschmar A (1974) Fonctions des lombriciens II. Recherches méthodologiques pour l’analyse qualitative de la matière organique végétale ingérée (étude du peuplement de la station R.C.P.-165/P.B.I). Rev d’Ecologie Biol du Sol 11:127–139.
Briones MJI, Schmidt O (2017) Conventional tillage decreases the abundance and biomass of earthworms and alters their community structure in a global meta-analysis. Glob Chang Biol 23:4396–4419.
Butt KR, Briones MJI, Lowe CN (2009) Is tagging with visual implant elastomer a reliable technique for marking earthworms? Perquisa Agropecuária Bras 44:969–974.
Butt KR, Frederickson J, Morris RM (1994) Effect of earthworm density on the growth and reproduction of Lumbricus terrestris L. (Oligochaeta: Lumbricidae) in culture. Pedobiologia 38:254–261.
Capowiez Y, Cadoux S, Bouchant P, Ruy S, Roger-Estrade J, Richard G, Boizard H (2009) The effect of tillage type and cropping system on earthworm communities, macroporosity and water infiltration. Soil Tillage Res 105:209–216.
26
(2015a) Impact of alley cropping agroforestry on stocks, forms and spatial distribution of soil organic carbon - A case study in a Mediterranean context. Geoderma 259–260:288– 299.
Cardinael R, Mao Z, Prieto I, Stokes A, Dupraz C, Kim JH, Jourdan C (2015b) Competition with winter crops induces deeper rooting of walnut trees in a Mediterranean alley cropping agroforestry system. Plant Soil 391:219–235.
Cardinael R, Chevallier T, Cambou A, Béral C, Barthès BG, Dupraz C, Durand C, Kouakoua E, Chenu C (2017) Increased soil organic carbon stocks under agroforestry: A survey of six different sites in France. Agric Ecosyst Environ 236:243–255.
Cardinael R, Umulisa V, Toudert A, Olivier A, Bockel L, Bernoux M (2018a) Revisiting IPCC Tier 1 coefficients for soil organic and biomass carbon storage in agroforestry systems. Environmental Research Letters (DOI:10.1088/1748-9326/aaeb5f, in press).
Cardinael R, Guenet B, Chevallier T, Dupraz C, Cozzi T, Chenu C (2018b) High organic inputs explain shallow and deep SOC storage in a long-term agroforestry system - Combining experimental and modeling approaches. Biogeosciences 15:297–317.
Chan KY (2001) An overview of some tillage impacts on earthworm population abundance and diversity - Implications for functioning in soils. Soil Tillage Res 57:179–191.
Chatterjee N, Nair PKR, Chakraborty S, Nair VD (2018) Changes in soil carbon stocks across the Forest-Agroforest-Agriculture/Pasture continuum in various agroecological regions: A meta-analysis. Agric Ecosyst Environ 266:55–67.
Cluzeau D (1992) Structure et dynamique des peuplements lombriciens dans des systèmes tempérés anthropisés. Université Rennes 1
Cluzeau D, Guernion M, Chaussod R, Martin-Laurent F, Villenave C, Cortet J, Ruiz-Camacho N, Pernin C, Mateille T, Philippot L, Bellido A, Rougé L, Arrouays D, Bispo A, Pérès G (2012) Integration of biodiversity in soil quality monitoring: Baselines for microbial and soil fauna parameters for different land-use types. Eur J Soil Biol 49:63–72.
Crittenden SJ, Huerta E, de Goede RGM, Pulleman MM (2015) Earthworm assemblages as affected by field margin strips and tillage intensity: An on-farm approach. Eur J Soil Biol 66:49–56.
Curry J (1998) Factors affecting earthworm abundance in soils. In: Edwards CA (ed) Earthworm Ecology. St. Lucie Press, Raton, FL, pp 37–64.
de Stefano A, Jacobson MG (2018) Soil carbon sequestration in agroforestry systems: a meta-analysis. Agrofor Syst 92:285–299.
Decaëns T, Bureau F, Margerie P (2003) Earthworm communities in a wet agricultural landscape of the Seine Valley (Upper Normandy, France): The 7th international symposium on earthworm ecology · Cardiff · Wales · 2002. Pedobiologia 47:479–489. Decaëns T, Margerie P, Aubert M, Hedde M, Bureau F (2008) Assembly rules within
earthworm communities in North-Western France-A regional analysis. Appl Soil Ecol 39:321–335.
Dupont L, Gresille Y, Richard B, Decaëns T, Mathieu J (2015) Dispersal constraints and fine-scale spatial genetic structure in two earthworm species. Biol J Linn Soc 114:335–347. Dupont L, Torres-Leguizamon M, René-Corail P, Mathieu J (2017) Landscape features impact
27
connectivity between soil populations: a comparative study of gene flow in earthworms. Mol Ecol 26:3128–3140.
Eijsackers H (2011) Earthworms as colonizers of natural and cultivated soil environments. Appl Soil Ecol 50:1–13.
Ellert BH, Bettany JR (1995) Calculation of organic matter and nutrients stored in soils under contrasting management regimes. Can J Soil Sci 75:529–538.
Feliciano D, Ledo A, Hillier J, Nayak DR (2018) Which agroforestry options give the greatest soil and above ground carbon benefits in different world regions? Agric Ecosyst Environ 254:117–129.
Ferrière G (1980) Fonctions des Lombriciens. VII. Une méthode d’analyse de la matière organique végétale ingérée. Pedobiologia 20:263–273.
Fonte SJ, Barrios E, Six J (2010) Earthworms, soil fertility and aggregate-associated soil organic matter dynamics in the Quesungual agroforestry system. Geoderma 155:320–328. Frazão J, de Goede RGM, Brussaard L, Faber JH, Groot JCJ, Pulleman MM (2017) Earthworm communities in arable fields and restored field margins, as related to management practices and surrounding landscape diversity. Agric Ecosyst Environ 248:1–8.
Frouz J, Pižl V, Cienciala E, Kalčík J (2009) Carbon storage in post-mining forest soil, the role of tree biomass and soil bioturbation. Biogeochemistry 94:111–121.
Germon A, Cardinael R, Prieto I, Mao Z, Kim JH, Stokes A, Dupraz C, Laclau JP, Jourdan C (2016) Unexpected phenology and lifespan of shallow and deep fine roots of walnut trees grown in a silvoarable Mediterranean agroforestry system. Plant Soil 401:409–426. Hartenstein R, Amico L (1983) Production and carrying for the earthworm Lumbricus terrestris
in culture. Soil Biol Biochem 15:51–54.
Hauser S (1993) Distribution and activity of earthworms and contribution to nutrient recycling in alley cropping. Biol Fertil Soils 15:16–20.
Hauser S, Osawalam DO, Vanlauwe B (1998) Spatial and temporal gradients of earthworms casting activity in alley cropping systems. Agrofor Syst 41:127–137.
Hmar L, Ramanujam SN (2014) Earthworm cast production and physico-chemical properties in two agroforestry systems of Mizoram (India). Trop Ecol 55:75–84.
Hoeffner K, Monard C, Santonja M, Cluzeau D (2018) Feeding behaviour of epi-anecic earthworm species and their impacts on soil microbial communities. Soil Biol Biochem 125:1–9.
Hof AR, Bright PW (2010) The impact of grassy field margins on macro-invertebrate abundance in adjacent arable fields. Agric Ecosyst Environ 139:280–283.
Hoogerkamp M, Rogaar H, Eijsackers HJP (1983) Effect of earthworms on grassland on recently reclaimed polder soils in the Netherlands. In: Satchell JE (ed) Earthworm Ecology. Springer, Dordrecht, The Netherlands, pp 85–105
Jégou D, Capowiez Y, Cluzeau D (2001a) Interactions between earthworm species in artificial soil cores assessed through the 3D reconstruction of the burrow systems. Geoderma 102:123–137.
28
Jégou D, Cluzeau D, Balesdent J, Tréhen P (1998) Effects of four ecological categories of earthworms on carbon transfer in soil. Appl Soil Ecol 9:249–255.
Jégou D, Schrader S, Diestel H, Cluzeau D (2001b) Morphological, physical and biochemical characteristics of burrow walls formed by earthworms. Appl Soil Ecol 17:165–174. Jouquet P, Dauber J, Lagerlöf J, Lavelle P, Lepage M (2006) Soil invertebrates as ecosystem
engineers: Intended and accidental effects on soil and feedback loops. Appl Soil Ecol 32:153–164.
Kretzschmar A (1977) Etude du transit intestinal des Lombriciens aneciques. II. Resultats et interpretation ecologique. Ecol Bull 25:210–221.
Lagerlöf J, Goffre B, Vincent C (2002) The importance of field boundaries for earthworms (Lumbricidae) in the Swedish agricultural landscape. Agric Ecosyst Environ 89:91–103. Lavelle P (1988) Earthworm activities and the soil system. Biol Fertil Soils 6:237–251.
Lavelle P (1997) Faunal activities and soil processes: adaptative strategy that determine ecosystem function.
Lavelle P (1983) The structure of earthworm communities. In: Earthworm Ecology. pp 449– 466
Lavelle P, Decaëns T, Aubert M, Barot S, Blouin M, Bureau F, Margerie P, Mora P, Rossi JP (2006) Soil invertebrates and ecosystem services. Eur J Soil Biol 42:3–15.
Lee KE (1985) Earthworms their Ecology and Relationships with Soils and Land Use. Academic Press, Sydney
Ligthart TN, Peek GJCW (1997) Evolution of earthworm burrow systems after inoculation of lumbricid earthworms in a pasture in the Netherlands. Soil Biol Biochem 29:453–462. Makowski D, Piraux F, Brun F (2018) De l’analyse des réseaux expérimentaux à la
méta-analyse. Méthodes et applications avec le logiciel R pour les sciences agronomiques et environnementales. Quae
Mathieu J, Barot S, Blouin M, Caro G, Decaëns T, Dubs F, Dupont L, Jouquet P, Nai P (2010) Habitat quality, conspecific density, and habitat pre-use affect the dispersal behaviour of two earthworm species, Aporrectodea icterica and Dendrobaena veneta, in a mesocosm experiment. Soil Biol Biochem 42:203–209.
Mathieu J, Caro G, Dupont L (2018) Methods for studying earthworm dispersal. Appl Soil Ecol 123:339–344.
Nair PKR (1993) An introduction to agroforestry. Kluwer Academic Publishers, Dordrecht, The Netherlands
Neuhauser E, Hartenstein R, Kaplan D (1980) Growth of the Earthworm Eisenia Foetida in Relation to Population Density and Food rationing. Oikos 35:93–98.
Nieminen M, Ketoja E, Mikola J, Terhivuo J, Siren T, Nuutinen V (2011) Local land use effects and regional environmental limits on earthworm communities in Finnish arable landscapes. Ecol Appl 21:3162–3177.
Nuutinen V, Butt KR, Jauhiainen L (2011) Field margins and management affect settlement and spread of an introduced dew-worm (Lumbricus terrestris L.) population. Pedobiologia
29
54S:S167-S172.Pelosi C, Bertrand M, Roger-Estrade J (2009) Earthworm community in conventional, organic and direct seeding with living mulch cropping systems. Agron Sustain Dev 29:287–295.
Pelosi C, Pey B, Hedde M, Caro G, Capowiez Y, Guernion M, Peigné J, Diron D, Bertrand M, Cluzeau D (2014) Reducing tillage in cultivated fields increases earthworm functional diversity. Appl Soil Ecol 83:79–87.
Pérès G, Cluzeau D, Curmi P, Hallaire V (1998) Earthworm activity and soil structure changes due to organic enrichments in vineyard systems. Biol Fertil Soils 27:417–424.
Pinheiro J, Bates D, DebRoy S, Sarkar D, R Development Core Team (2013) nlme: Linear and Nonlinear Mixed Effects Models. R package version 3.1-111.
Ponge JF, Pérès G, Guernion M, Ruiz-Camacho N, Cortet J, Pernin C, Villenave C, Chaussod R, Martin-Laurent F, Bispo A, Cluzeau D (2013) The impact of agricultural practices on soil biota: A regional study. Soil Biol Biochem 67:271–284.
Potvin LR, Lilleskov EA (2017) Introduced earthworm species exhibited unique patterns of seasonal activity and vertical distribution, and Lumbricus terrestris burrows remained usable for at least 7 years in hardwood and pine stands. Biol Fertil Soils 53:187–198. Price GW, Gordon AM (1999) Spatial and temporal distribution of earthworms in a temperate
intercropping system in southern Ontario, Canada. Agrofor Syst 44:141–149.
R Development Core Team (2013) R: A language and environment for statistical computing. Roarty S, Schmidt O (2013) Permanent and new arable field margins support large earthworm
communities but do not increase in-field populations. Agric Ecosyst Environ 170:45–55. Saharan N, Singh RP (1988) Influence of earthworm activity on soil fertility in agroforestry
systems. Ann Arid Zo 27:81–85.
Schon NL, Mackay AD, Gray RA, Dodd MB (2014) The action of an anecic earthworm (Aporrectodea longa) on vertical soil carbon distribution in New Zealand pastures several decades after their introduction. Eur J Soil Biol 62:101–104.
Shi L, Feng W, Xu J, Kuzyakov Y (2018) Agroforestry systems: Meta-analysis of soil carbon stocks, sequestration processes, and future potentials. L Degrad Dev 1–12.
Shipitalo MJ, Protz R, Tomlin AD (1988) Effect of diet on the feeding and casting activity of
Lumbricus terrestris and Lumbricus rubellus in laboratory culture. Soil Biol Biochem
20:233–237.
Smith J, Potts SG, Woodcock BA, Eggleton P (2008a) Can arable field margins be managed to enhance their biodiversity, conservation and functional value for soil macrofauna? J Appl Ecol 45:269–278.
Smith RG, McSwiney CP, Grandy AS, Suwanwaree P, Snider RM, Robertson GP (2008b) Diversity and abundance of earthworms across an agricultural land-use intensity gradient. Soil Tillage Res 100:83–88.
Tian G, Olimah JA, Adeoye GO, Kang BT (2000) Regeneration of Earthworm Populations in a Degraded Soil by Natural and Planted Fallows under Humid Tropical Conditions. Soil Sci Soc Am J 64:222.
30
stability and enzyme activities in a temperate agroforestry practice. Appl Soil Ecol 39:153–160.
van Capelle C, Schrader S, Brunotte J (2012) Tillage-induced changes in the functional diversity of soil biota - A review with a focus on German data. Eur J Soil Biol 50:165– 181.
Wotherspoon A, Thevathasan N V., Gordon AM, Voroney RP (2014) Carbon sequestration potential of five tree species in a 25-year-old temperate tree-based intercropping system in southern Ontario, Canada. Agrofor Syst 88:631–643.
Zeithaml J, Pizl V, Sklenicka P (2009) Earthworm assemblages in an ecotone between forest and arable field and their relations with soil properties. Pesqui Agropecu Bras 44:922–927.
Supplementary material Site description
The BE silvoarable site was located in Béthines, in the department of Vienne (longitude 0°58'37.5"E, latitude 46°32'24.4"N, elevation 112 m a.s.l.). The soil was a Luvisol (IUSS Working Group WRB, 2007). Hybrid walnut trees (Juglans regia × nigra) were planted in 2007 at a density of 48 trees ha-1. The trees were planted 8 m apart within the tree rows, with 26 m between rows. The rows of trees were two meters wide, and covered by spontaneous herbaceous vegetation. After tree planting, rapeseed (Brassica napus L.), wheat (Triticum aestivum L. subsp. aestivum) and barley (Hordeum vulgare L.) were grown in rotation following conventional practices in the control plot and in the inter-rows. Crop residues were left in the field after harvest. The soil was ploughed every three years to a depth of 10–20 cm in both the agroforestry inter-rows and the control plot.
The BO silvoarable site was located in Bonnes, in the department of Charente (longitude 0°07'45.4"E, latitude 45°12'39.4"N, elevation 34 m a.s.l.). The soil was a Fluvisol (IUSS Working Group WRB, 2007). Poplars (Populus deltoides x nigra) were planted in 2007 at a density of 48 trees ha-1. The trees were planted 7 m apart within the tree rows, with 27 m between rows. The rows of trees were three meters wide and covered by spontaneous herbaceous vegetation. After tree planting, irrigated maize (Zea mays L.) was grown in monoculture following conventional practices in the control plot and in the inter-rows. Crop residues were left in the field after harvest. The soil was ploughed every year in both the agroforestry inter-rows and the control plot.
The CH silvoarable site was located in Châteaudun, in the department of Eure-et-Loir (longitude 1°17'58"E, latitude 48°06'08"N N, elevation 147 m a.s.l.). The mean temperature was 11.1 °C and the mean annual rainfall 595 mm (years 2001–2013, INRA CLIMATIK, https://intranet.inra.fr/climatik). The soil was a silty loam Luvisol (IUSS Working Group WRB, 2007). Hybrid walnut trees (Juglans regia × nigra cv. NG23) were planted in 2008 at a density of 34 trees ha-1. The trees were planted 10 m apart within the rows, with 26 m between rows. A
mix of ryegrass (Lolium perenne L.) and tall fescue (Festuca arundinacea Schreb.) was sown in 2007 in two meter wide strips along the tree rows. After tree planting, wheat (Triticum
aestivum L. subsp. aestivum) and rapeseed (Brassica napus L.) were grown in rotation in the
control plot and in the inter-rows following conventional practices. All crop residues were left in the field after harvest. The agroforestry inter-rows and the control plot were ploughed every three years.
The LB silvoarable site was located in Le Marquis, in the department of Oise (longitude 2°03'52.5"E, latitude 49°28'25.6"N, elevation 110 m a.s.l.). Mixed species of trees (hybrid walnut, sycamore maple, apple tree, cherrywood, wild service tree, common walnut) were planted in 2009 at a density of 83 trees ha-1. The trees were planted 4 m apart within the tree rows, with 28 m between rows. The rows of trees were two meters wide and covered by spontaneous herbaceous vegetation. After tree planting, rapeseed (Brassica napus L.), wheat (Triticum aestivum L. subsp. aestivum) and barley (Hordeum vulgare L.) were grown in rotation without pesticides in the control plot and in the inter-rows. Crop residues were left in the field after harvest. The crops were directly sown on crop residues, with no tillage, in both the agroforestry inter-rows and the control plot.
The ME silvoarable site was located in Melle, in the department of Deux-Sèvres (longitude 0°10'37"W, latitude 46°11'54"N, elevation 107 m a.s.l.). The mean temperature was 11.7 °C and the mean annual rainfall 810 mm (years 1990–2013, INRA CLIMATIK, https://intranet.inra.fr/climatik). The soil was a silty loam Luvisol (IUSS Working Group WRB, 2007). Hybrid walnut trees (Juglans regia × nigra cv. NG23) were planted in 2008 at a density of 35 trees ha-1. The trees were planted 8 m apart within the rows, with 29 m between rows. Sheep fescue (Festuca ovina L.) was sown in 2008 in two meter wide strips along the tree rows. After tree planting, wheat (Triticum aestivum L. subsp. aestivum), rapeseed (Brassica napus L.) and sunflower (Helianthus annuus L.) were grown in rotation, following conventional practices, in the control plot and in the inter-rows. Crop residues were usually exported, but this was counterbalanced by the application of manure in both the agroforestry inter-rows and the control plot. Before the spring crop (sunflower), a winter cover crop was sown to prevent soil erosion and nitrate leaching. This cover crop was a mix of radish (Raphanus sativus L.), phacelia (Phacelia tanacetifolia Benth.) and mustard (Sinapis alba L.). The soil was ploughed every year to a depth of 20 cm in both the agroforestry inter-rows and the control plot.
The PS silvoarable site was located in Parcé sur Sarthe, in the department of Sarthe (longitude 0°12'58.9"W, latitude 47°49'18.1"N, elevation 49 m a.s.l.). Mixed species of timber trees (hybrid walnut, wild service tree, common walnut, red oak, sorb tree) were planted in 2007 at two density (67 and 33 trees ha-1). The trees were planted 5 or 10 m apart within the tree rows, with 27 m between rows. The rows of trees were three meters wide and covered by spontaneous herbaceous vegetation. In between timber trees, trees for biomass production were planted on the half of the site (hazel, black locust, sessile oak). Rapeseed (Brassica napus L.), wheat (Triticum aestivum L. subsp. aestivum), barley (Hordeum vulgare L.), sorghum (Sorghum
bicolor), meslin were grown in rotation following conventional practices in the control plot and
in the inter-rows. Cover crops are sown between the main crops. Crop residues were left in the field after harvest. The crops were sown after a reduced tillage in both the agroforestry inter-rows and the control plot.
The RE site was located in Prades-le-Lez, at the Restinclières experimental site, in the department of Hérault (longitude 04°01'E, latitude 43°43'N, elevation 54 m a.s.l.). The climate was sub-humid Mediterranean with a mean temperature of 15.4 °C and a mean annual rainfall of 873 mm (years 1995–2013, experimental site weather station). The soil was a deep carbonated sandy loam Fluvisol (IUSS Working Group WRB, 2007). Hybrid walnut trees (Juglans regia × nigra cv. NG23) were planted in 1995 and the density was 110 trees ha-1 at
the time of the study. The trees were planted 4–8 m apart along the rows with 13 m between rows. The two meter wide tree rows were covered by spontaneous herbaceous vegetation. They were mainly intercropped with durum wheat (Triticum turgidum L. subsp. durum) but also with rapeseed (Brassica napus L.) and chickpea (Cicer arietinum L.). The soil was regularly ploughed to a depth of 20 cm in both the agroforestry inter-rows and the control plot.
The SA silvoarable site was located in Saint Aulais La Chapelle, in the department of Charentes (longitude 0°02'53.9"W, latitude 45°27'06.8"N, elevation 82 m a.s.l.). Mixed species of trees (Hybrid walnut, common walnut, sorb tree, sycamore maple, common apple, common pear, elm) were planted in 2007 at a density of 65 trees ha-1. The trees were planted 6 m apart within
the tree rows, with 20 m between rows. The rows of trees were five meters wide and sown with tall fescue (Festuca arundinacea Schreb.). After tree planting, cereal crops were grown in rotation with the minimum use of pesticides in the control plot and in the inter-rows. Crop
residues were left in the field after harvest. The crops were directly sown under cover crops in both the agroforestry inter-rows and the control plot.
The SJ silvoarable site was located in Saint-Jean-d’Angély, in the department of Charente-Maritime (longitude 0°13'57"W, latitude 46°00'39"N, elevation 152 m a.s.l.). The mean temperature was 12.9 °C and the mean annual rainfall 850 mm (years 1990–2013, INRA CLIMATIK, https://intranet.inra.fr/clima- tik). The soil was a carbonated silty clay Luvisol (IUSS Working Group WRB, 2007). Black walnut trees (Juglans nigra L.) were planted in 1973 at a density of 102 trees ha-1. The trees were planted 7 m apart within the tree rows, with 14 m between rows. The rows of trees were two meters wide, and covered by spontaneous herbaceous vegetation. After tree planting, sunflower (Helianthus annuus L.), wheat (Triticum
aestivum L. subsp. aestivum) and barley (Hordeum vulgare L.) were grown in rotation
following conventional practices, in the control plot and in the inter-rows. Crop residues were left in the field after harvest. The soil was ploughed every three years to a depth of 10–20 cm in both the agroforestry inter-rows and the control plot.
The SM silvoarable site was located in Saint Maxire, in the department of Deux Sèvres (longitude 0°30'42.9"W, latitude 46°23'57.6"N, elevation 44 m a.s.l.). Mixed species of trees (hybrid walnut, sorb tree, wild service tree) were planted in 2008 and 2010 at a density of 37 trees ha-1. The trees were planted 9 m apart within the tree rows, with 28 m between rows. The rows of trees were two meters wide and sown with perennial ryegrass. After tree planting, cereal crops were grown in rotation following organic practices in the control plot and in the inter-rows. Crop residues were left in the field after harvest. The soil was never ploughed in both the agroforestry inter-rows and the control plot.
The SJM silvoarable site was located in Saint Jouin de Marnes, in the department of Deux Sèvres (longitude 0°02'28.7"W, latitude 46°54'19.0"N, elevation 59 m a.s.l.). Mixed species of trees (Hybrid walnut, alder, ash) were planted in 2006 at a density of 37 trees ha-1. The trees were planted 10 m apart within the tree rows, with 24 m between rows. The rows of trees were three meters wide and sown with perennial ryegrass. After tree planting, maize (Zea mays L.) was grown in monoculture following conventional practices in the control plot and in the inter-rows. Crop residues were left in the field after harvest. The soil was ploughed every year in both the agroforestry inter-rows and the control plot.
The VER silvoarable site was located in Verpillières, in the department of Somme (longitude 2°48'56.4"E, latitude 49°40'03.3"N, elevation 81 m a.s.l.). Mixed species of trees (hybrid walnut, sorb tree, black locust, sycamore maple, common pear, common apple, norway maple) were planted in 2008 at a density of 42 trees ha-1. The trees were planted 8 m apart within the tree rows, with 28 m between rows. The rows of trees were two meters wide and covered by spontaneous herbaceous vegetation. After tree planting, beetroot (Beta vulgaris subsp. vulgaris), wheat (Triticum aestivum L. subsp. aestivum), field bean (Vicia faba), rapeseed (Brassica napus L.) were grown in rotation following conventional practices in the control plot and in the inter-rows. Crop residues were left in the field after harvest. The crops were sown after a reduced tillage in both the agroforestry inter-rows and the control plot.
The VZ silvoarable site was located in Vézénobres, in the department of Gard (longitude 4°06'37"E, latitude 44°03'29"N, elevation 102 m a.s.l.). The climate was sub-humid Mediterranean with a mean temperature of 14.5 °C and a mean annual rainfall of 1037 mm (mean 1995–2007, experimental site weather station). The soil was a deep sandy loam alluvial
Fluvisol (IUSS Working Group WRB, 2007) originating from deposits from the granitic Cevennes mountain range and was, therefore, not calcareous. Hybrid walnut trees (Juglans
regia × nigra cv. NG23) were planted in 1995 at a density of 100 trees ha-1. The trees were planted 10 m apart with the rows, with 10 m between rows. The tree rows were two meters wide and were covered by spontaneous herbaceous vegetation. In the inter-rows, rapeseed (Brassica
napus L.) and wheat (Triticum aestivum L. subsp. aestivum) were grown in rotation until 2010.
In 2011, the farm changed over to organic farming and potatoes were planted (Solanum
tuberosum L.). In 2012 garlic (Allium sativum L.) was grown in the inter-rows. In 2013 the
inter-rows were left fallow and in 2014 sunflower (Helianthus annuus L.) was sown. The same crops were grown in the control plot, except in 2011 when wheat (Triticum aestivum L. subsp.
aestivum) was sown and in 2012 when the control was left fallow. The soil was occasionally
ploughed to a depth of 20 cm in both the agroforestry inter-rows and the control plot. The soil regularly amended with rameal chip wood.
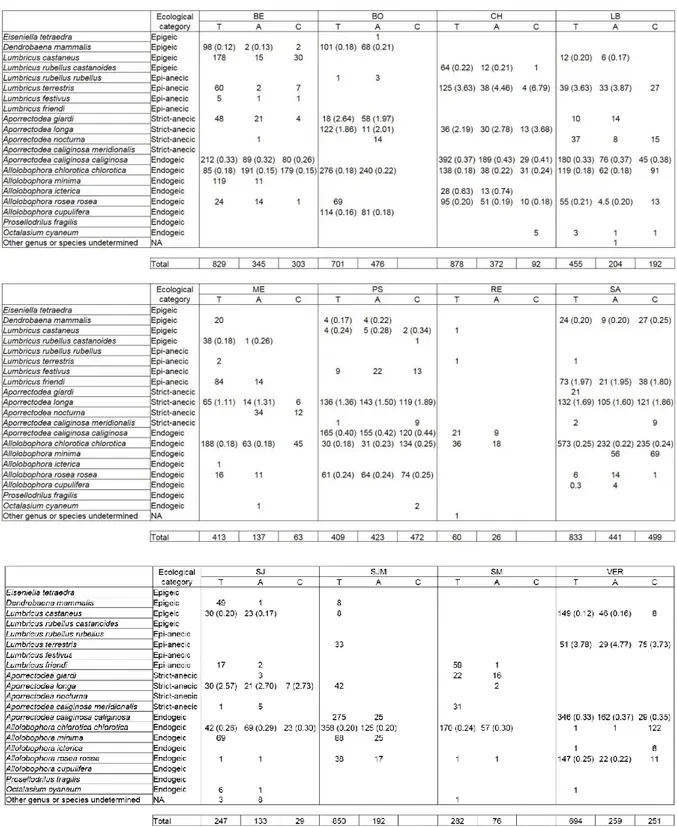
Table S1. Mean earthworm species abundance across agroforestry sites and locations (T, Tree row; A, Alley; C, Control). Individual weights of adults are indicated in brackets when at least 3 adults were present on at least 2 different locations per sites.
BE, Béthines; BO, Bonnes; CH, Châteaudun; LB, Lasalle Beauvais; ME, Melle; PS, Parcé-sur-Sarthe; RE, Restinclières; SA,
Figure S1. Site-specific log effect sizes of SOC stocks (0-30 cm) between tree rows and control
plots, alleys and control plots, and tree rows and alleys for the silvoarable sites (excluding the
Figure S2. Site-specific log effect sizes of earthworm total abundance and biomass between
tree rows and control plots, alleys and control plots, and tree rows and alleys for the silvoarable
Figure S3. Site-specific log effect sizes of earthworm abundance per ecological category
between tree rows and control plots, alleys and control plots, and tree rows and alleys for the
silvoarable sites (excluding the VZ site with organic vegetables). Error bars represent
confidence intervals. Missing sites between the four graphs correspond to an absence of this