HAL Id: hal-02798066
https://hal.inrae.fr/hal-02798066
Submitted on 5 Jun 2020
HAL is a multi-disciplinary open access archive for the deposit and dissemination of sci-entific research documents, whether they are pub-lished or not. The documents may come from teaching and research institutions in France or abroad, or from public or private research centers.
L’archive ouverte pluridisciplinaire HAL, est destinée au dépôt et à la diffusion de documents scientifiques de niveau recherche, publiés ou non, émanant des établissements d’enseignement et de recherche français ou étrangers, des laboratoires publics ou privés.
Glamur project, cross-countries performances
comparison : France and Switzerland local and global
wine supply chains
Camille Maffezzoli, Emilia Schmitt, Ulysse Le Goff, Laurette Gratteau,
Virginia Cravero, Dominique Barjolle, Jean-Marc Touzard
To cite this version:
Camille Maffezzoli, Emilia Schmitt, Ulysse Le Goff, Laurette Gratteau, Virginia Cravero, et al.. Glamur project, cross-countries performances comparison : France and Switzerland local and global wine supply chains. [Technical Report] 2015. �hal-02798066�
2015
FiBL - Schmitt, E., Le Goff, U., Gratteau , L., Cravero, V., Barjolle, D.. INRA - Touzard, J-M; Maffezzoli, C.
(2015) Glamur project : Cross-countries performances comparison : France and Switzerland local and Global wine supply chains
The research leading to these results has received funding from the European Union’s Seventh Framework Programme for research, technological development and demonstration under grant agreement n° 311778
To be quoted as:
Maffezzoli, C., Schmitt, E., Le Goff, U., Gratteau, L., Cravero, V., Barjolle, D., Touzard, J-M, (2015) Glamur project : Cross-countries performances comparison : France and Switzerland local and Global wine supply chains. FiBL, INRA.
Content
1 Introduction ... 4
2 Data and methodology ... 5
2.1 Product and supply chains ... 5
2.1.1 Local Swiss wines and chain ... 6
2.1.2 Local French wines and chain ... 7
2.1.3 Global French wines ... 8
Global French bottled PDO wines ... 8
French global bulk wine chain ... 9
2.2 Indicators ... 12
3 Results ... 15
3.1 Economic dimension ... 15
3.2 Social dimension ... 20
3.2.1 Governance ... 20
3.2.2 Information and communication ... 22
3.2.3 Territoriality ... 23 3.3 Environmental dimension ... 24 3.3.1 Resource use ... 24 3.3.2 Biodiversity ... 24 3.3.3 Pollution ... 25 3.3.4 Health dimension ... 26 4 Trade-offs ... 28 4.1 France ... 28 4.1.1 Environment vs pollution... 28
4.1.2 Territory: Landscapes and "Terroir identity" ... 28
4.1.3 Food safety strategy and control ... 28
4.1.4 Market management and resilience to market changes ... 28
4.1.5 Marketing strategy of Wine Quality and farmers remuneration . 28 4.1.6 Governance models based on Terroir specificities and Market specifications ... 29
4.2 Switzerland ... 29
5 Cross-cutting issues ... 31
5.1 Employment ... 31
5.2 Branding (trust and labelling) ... 31
5.3 Subsidies ... 33
5.4 Choice of cultivars ... 33
5.5 Research gaps ... 34
6 Conclusion ... 36
7 Annex ... 37
1 Introduction
This report constitutes deliverable D4.1 of the project GLAMUR – Global and
local food chain assessment: a multi-dimensional performance-based approach, which will subsequently be used in the production of an overall
synthesis report – D4.2
In the preceding work package (WP3), a series of national reports were prepared, which assessed the relative performance of local and global food chains within each of the countries concerned across a range of different product categories. The two reports that are of specific interest here are the report from Switzerland and the one from France. In each case the focus was on examining the production of grapes transformed into red wine and the attendant supply chains. By contrast, this report presents, for WP4, a comparative analysis of the distinctions and commonalities in the performance of local and global wine chains between Switzerland and France. It will address the following questions:
What is the relative performance of local chains vs global chains between Switzerland and France?
What are the most relevant dimensions to be considered when comparing the wine supply chains of Switzerland and France and what are the relations (correlation, trade-offs, dilemmas) between them? What are the cross-cutting issues and emerging thematic questions
and priorities for further in-depth investigation?
The performance of national local and global red wine chains in Switzerland and France is assessed against a range of 20 indicators. These are grouped according to eight attributes which, in turn, cover each of the five Glamur performance dimensions – economic, social, environmental, health and ethical. Thus, the comparative assessment of the performance of local compared to global wine supply chains, and between Switzerland and France, is multi-dimensional.
The team carrying out the work in Switzerland is led by Emilia Schmitt of the Federal institute of Technology (ETH) Zurich/FiBL and overseen by Dominique Barjolle of FiBL. Emilia is assisted by Virginia Cravero, Ulysse le Goff, and Laurette Gratteau. The French team is led by Jean-Marc Touzard of the National Institute for Agronomic Research (INRA) who is assisted by Camille Maffezzoli.
The structure of this report is as follows:
Firstly, the methodology used in the preparation of the national supply chain performance reports (WP3) is summarized. This provides the contexts for each of the two countries of four specific red wine supply chains (chapter 2.1). The main differences in the methodology between both countries are detailed and explained, as well as the choice of attributes and indicators for this report (chapter 2.2).
Secondly, comparative results are presented for all chains by dimension (chapter 3). These compare both local and global supply chain performances, as well as the trade-offs between different performances dimensions (chapter 4). The report also identifies cross-cutting themes (chapter 5), such as the choice of agricultural varieties, the effects of agricultural subsidies and employment issues, all of which have a direct influence on the performance of the supply chains involved. Finally the report includes a discussion on the research gaps and methodological flaws of the present study (chapter 5.5) and a conclusion.
2 Data and methodology
2.1 Product and supply chains
In this report, value chains of still red wine are compared. Each chain and its related wines have specific characteristics, mainly determined by a few major factors mentioned below:
i) The characteristics of the local area (terroir) where the vines are grown and harvested are particularly important in the case of wine chains as it determines which and how grape cultivars can be grown. The nature of the soils and climate, but also the steepness of the area can be held accountable for the marketing strategy. Winegrowers in steeper environments have higher production costs and lower yields, but they can find opportunity to elaborate specific quality wines. They are more likely to produce with higher standards to reach economic profitability.
ii) The cultivars, the canopy management, the ripening stage when harvested, the blending and processing techniques are decided by producers to reach their organoleptic and commercial objectives. Wine production is a long and iterative process of practices adjustment, taking into account both the evolution of consumers demand and the local conditions of production.
iii) Marketing strategies of stakeholders, in particular the choice of selling place and the supply chains’ governance have a major impact on the final product’s characteristics.
A first analysis of each final product gives us good insight on each supply chain. The three characteristics described above (terroir, production practices and marketing strategies, thereafter written i) to iii) in text) are presented for each value chain along the mapping of the actors in the supply chains.
2.1.1 Local Swiss wines and chain
The Valais region is the biggest producing region in Switzerland. Most winegrowers have very small domains and sell their grapes to cooperatives or winemakers. Our study focuses on larger vineyard domains (most of them between 3 to 10 hectares), where the grapes are processed and the wine bottled directly to be sold in the domain’s cellar or delivered to individuals or local businesses. All their production is certified under the Valais PDO (if not declassed) or under more prestigious “Grand Crus”. Each producer is responsible of his marketing strategy, but they are all part of the Valais wine inter-branch organizations and producers’ associations, where common strategic decisions and objectives for the region’s image and marketing are taken.
i) The vines are grown on steep areas from 450 to 800 m high using terraces made of stone walls, on the northern side of the Rhône valley in the middle of the Alps, in a rather dry climate for Switzerland.
ii) The red wines produced in the selected chain are mostly under the PDO certifications and some of them are under stricter and higher-quality schemes like “Grand Cru”. Blending is limited by the certifications scheme and most wines are labelled as “made of one grape variety”, especially in the case of autochthon varieties (e.g. Cornalin).
iii) Wines in the local Valais chain are aimed to be sold directly to the consumers (cellar or delivery) and to small local businesses (restaurants, wine shops). Each producer is handling the production of grapes, its processing into wine, the bottling and the selling. The only lack of control from them comes from the inputs used, the general image of the region, which is also shaped by the rest of the sector, and the certifications standards which are discussed within the whole inter-branch organization.
2.1.2 Local French wines and chain
Family domains notably involved in local chains (more than 25% of their income) are small or medium, mainly between 10 and 40 hectares (domains). Local markets offer opportunities to increase household income and provide cash-flow, but they are time-consuming and not always profitable at short term. Wine producers generally consider local chains as (relational) investment, aiming at strengthening the reputation of their wines. Farmers are helped by professional advisers (chamber of agriculture) and by local governments (promotion, connexion to tourism…). Many innovations are noted in building the local chains, including by organizing local gastronomic or cultural events. The chains are driven by the producer who mastered most of the operations, from the grape production to the wine marketing. Some (small) wine cooperatives also manage their own network of sellers in different local niche markets. The production system and the marketing strategies are frequently linked with the willingness of wine producers to adapt their practices and improve the wine quality, taking into account impacts on local environment. Local chains are combined with other chains and represent a way to make the production system more resilient. i) Wines in local chains are mainly sold with the PDO label from family domains, but some wines “without denomination” or with PGI labels can also be found. Consequentially wines in local chains are mainly located in PDO areas and respecting PDO code of practices, which is also used for global chains. PDO organizations (local winegrowers associations) are thus involved in the governance of local chains, but other specific local actors (local community, actors of tourism…) also play an important role.
ii) Three main quality references are promoted in local chains: Environment (with organic label or not), “terroir” (PDO label) and personal
reputation/acknowledgment of the wine producers. Local chains are embedded in local social networks (usual local consumers) and tourism networks. A wide range of qualities and prices are sold in local chains, corresponding to different kinds of consumers or conditions of consumption iii) The local chain is characterized by a limited number of intermediary stakeholders (0 or 1). The final product presents a defined and recognizable bottle which is sold on the farm cellar or in specific local wine shops or restaurants.
Figure 2: Local wine simplified supply chains structure
2.1.3 Global French wines
The global chains are characterized by a more intricate and long supply chain leading to export either in bottle or in bulk. Both export long chains require technical and commercial knowledge at international scale, internet, specialized skills and jobs.
Global French bottled PDO wines
High quality wines are produced in private domains or some small cooperatives and exported through global chains. The same economic unit is cultivating grapes, making wine and selling wine. Large scale domains with more than 40 hectares and permanent employees are the main actors in these chains. Their strategy is mainly based on the valuation of assets, by production of quality wines marketed through labels and own trade mark. The supply chains are driven by the producer who concentrates most of the operations, from the grape production to the wine final marketing. Small domains are also building these global chains but they have difficulties to provide a regular amount of bottles to importers. Regional traders also try to diversify their markets with some high quality wines. PDO organisations (fi CIVL) and regional government are supporting these chains.
Figure 3 : Global bottled wine chain
i) The blend of traditional varieties and the “terroir” are the two main dimensions of wine quality promoted by producers, linking it to specific hillside landscape and soil. Nevertheless an increasing volume of PDO Languedoc wine is sold with organic certification.
ii) This global chain starts from production of wine in domains or small cooperatives, in the department of Hérault. Wine is bottled in the PDO area and sold in the global market to Swiss wholesalers who are aware of quality linked to both the “terroir” and organic practices
iii) PDO wines are produced by about 30% of the Languedoc wine-growers (in many cases in addition to PGI “Pays d’Oc”) and mainly exported. PDO label indicates that the wine comes from traditional varieties and that all stages of process are located in the same delimited area (the “terroir”) giving specific characteristics to the wine.
French global bulk wine chain
Wine of this global chain is arranged from grape growers and cooperatives located in Languedoc plain. There are different types of cooperatives, according to their size, specialization, quality orientation, business model, management... Two kinds of cooperative members (grape growers) are noted: i) Full-time grape growers (from 8 to 25 hectares), often directly involved in the cooperative board, aiming at increasing family income, helped by cooperative technicians and professional advisers; small grape-growers, manly retired people or part timers who can get additional incomes by producing grape, but are also motivated by social motivations (be included in the local community…). Supply chains are driven by wholesalers or traders who purchase wine in bulk and develop their own trademark in the international markets, distributing bottled wine in different final chains
(supermarkets, wine shops, collective restaurant, hotel chains…). “Grand Chais de France” illustrates this case, in particular by selling variety wine through “JP Chenet” trade mark.
i) PGI Pays d’Oc certifies that wines come from the Languedoc Region. Grapes are cultivated in the low land, with higher yields than grapes dedicated to PDO wines.
ii) At the beginning of the chain, grape-growers deliver their production to their cooperative cellar, where wine is elaborated through high volume technology. The wine is sold in bulk to one of the main French trading-bottling companies. This company manages packaging, transport and marketing in different activity centres, along the chain, outside the Languedoc region. Supermarkets in foreign countries (Switzerland) are the main final operators, distributing the wine to their many shops and selling wine to consumers.
iii) In the global bulk chain wine is mainly sold to final consumers under trade mark (such as Jean Pierre Chenet) combined with PGI “Pays d’Oc” and the designation of varieties on the bottle.
Figure 4 : Global bulk wine chain
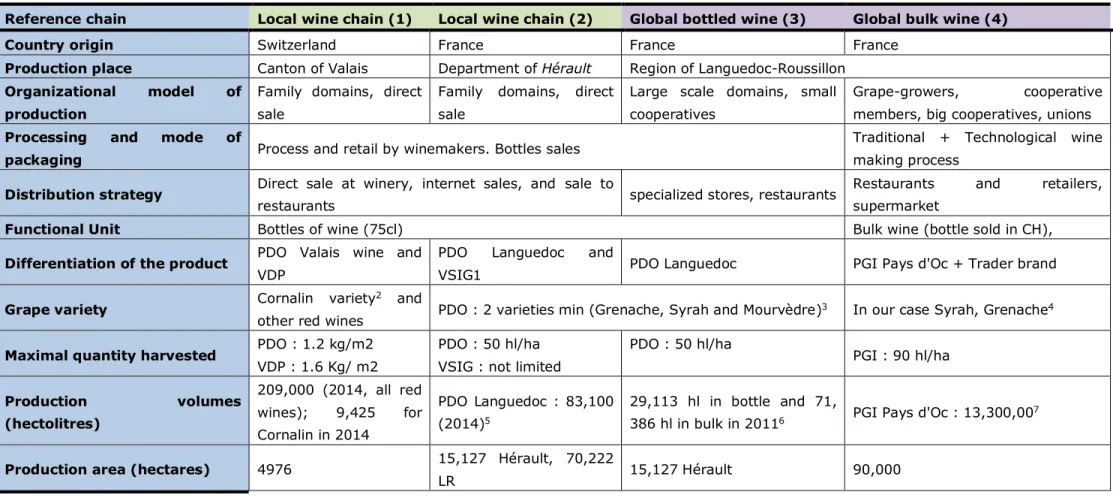
The following table (table 1) describes the key criteria that are differentiating local and global chains.
Table 1: key criteria describing the local and global wine chains
Reference chain Local wine chain (1) Local wine chain (2) Global bottled wine (3) Global bulk wine (4)
Country origin Switzerland France France France
Production place Canton of Valais Department of Hérault Region of Languedoc-Roussillon
Organizational model of production
Family domains, direct sale
Family domains, direct sale
Large scale domains, small cooperatives
Grape-growers, cooperative members, big cooperatives, unions
Processing and mode of
packaging Process and retail by winemakers. Bottles sales
Traditional + Technological wine making process
Distribution strategy Direct sale at winery, internet sales, and sale to
restaurants specialized stores, restaurants
Restaurants and retailers, supermarket
Functional Unit Bottles of wine (75cl) Bulk wine (bottle sold in CH),
Differentiation of the product PDO Valais wine and
VDP
PDO Languedoc and
VSIG1 PDO Languedoc PGI Pays d'Oc + Trader brand
Grape variety Cornalin variety
2 and
other red wines PDO : 2 varieties min (Grenache, Syrah and Mourvèdre)3 In our case Syrah, Grenache4
Maximal quantity harvested PDO : 1.2 kg/m2
VDP : 1.6 Kg/ m2
PDO : 50 hl/ha VSIG : not limited
PDO : 50 hl/ha PGI : 90 hl/ha Production volumes (hectolitres) 209,000 (2014, all red wines); 9,425 for Cornalin in 2014 PDO Languedoc : 83,100 (2014)5 29,113 hl in bottle and 71,
386 hl in bulk in 20116 PGI Pays d'Oc : 13,300,00 7
Production area (hectares) 4976 15,127 Hérault, 70,222
LR 15,127 Hérault 90,000
1"Vin sans Indication Géographique"
2tolerance of mixing with other wines to only 5% in the PDO specifications
3Minimum of 50 % of main wine varieties.
4main varieties (must represent a minimum volume of 85% )
530% of production is sold in traditional or short chains
640% of Languedoc PDO wines are exported. Switzerland is its 7th importer country
2.2 Indicators
We follow the GLAMUR framework to design a set of indicators of performance and a set of descriptive indicators. The iterative process between research design and confrontation to data, experts and colleagues led to a final list of indicators, which became relevant to assess the research questions. However, the final list remains a working list: the GLAMUR project is an opportunity to test the relevance and the feasibility of the selected indicators in order to assess food chain performance. For each attribute, the teams chose an average of 3-4 indicators. This process has been participatory between Switzerland and France, and between each team and their supply chain’s stakeholders, including wine experts. Both performance-based indicators and practice-performance-based indicators have been used (FAO, 2013) as well as qualitative and quantitative ones. A list of 8 attributes and 20 indicators, both quantitative and qualitative was consolidated for the French and the Swiss team. After selecting indicators, we thus develop a way to assess indicator performances. Each qualitative indicator was declined into several relevant sub-indicators. Sub-indicators/categories correspond to key practices, mechanisms or effects that directly influence indicator. The final step was the benchmark selection and indicator ranking. For qualitative indicators, benchmarks consist in affecting a score to each sub-indicators/category. Each category, if fulfilled, is equivalent to one point in the Swiss case study. Then the total number of categories fulfilled is averaged on all producers. The French team uses a different ranking strategy. The final performance score for a qualitative indicator is composed of each sub-indicators and calculated as the sum of the sub-indicators scores. Performance level was thus calculated by dividing the score corresponding to the case, by the higher score. Thus, each producer gets a number of points between 0 and maximum benchmarks. The obtaining score is thereafter considered as an ideal type of the wine supply chain
Table 2: List of common indicator list for comparison between local and global wine value chains
Dimension Attribute Indicator Stage relevant in
the value chain
Economic
Creation and distribution of added value
Net Income Producers, cooperative Annual Work Unit per unit of land Producers Distribution of added value
across the chain Chain
Social
Governance Decision making mechanisms
Chain Market management Information and communication Availability of information Product labelling Territoriality
Association of product with
territory Chain Social cohesion and Conviviality Producers,
Cooperatives
Environmental
Resource use Water Use Practices Producers Material Use practices Chain Biodiversity Species Conservation practices Producers
Diversity of production
Pollution
GHG emission from
transportation Chain GHG emissions from production Producers,
Cooperatives Environmental pollution
mitigation practices
Producers, Cooperatives
Health Food safety
Food safety standards and controls
Producers, cooperative Artificial additive: sulphur dioxide Producers,
cooperative
The data collection and analysis was notably based on interviews (primary data). For the French case study, a sample of 6 wine and grape producers, 2 cooperative managers and 2 retailers has completed and specified a set of 24 more general interviews previously made in 2014 in the Languedoc-Roussillon region. The Swiss team realized 27 interviews in the Canton of Valais. 26 of them represent local producers in short supply chain as they
produce their own grape and wine and manage bottling. 2 interviews concerned producers at cooperatives. Furthermore, the director of the cantonal office for viticulture was interviewed; 3 local wine shops, 3 input suppliers (nursery, bottles and agro-chemicals) and 1 major Swiss supermarket, which is a major actor in the global chains as well. The INRA team also selected a number of actors illustrating the boundaries of local and global chains with one intermediary case study of local product with strong identity, sold at the international level. Actors were selected according to the following criteria :(1) Denomination category of wine(PGI, PDO, VSIG), (2) main packaging (bulk vs bottled), (3) wine marketing method (sales at the cellar, distribution by cooperative, bulk trading, specialized traders in bottled wine), (4) turnover of local chain wine vs global chain wine.
The French team processed and compiled primary data in order to build a coherent and representative value chain. For each chain and each indicator, observations were confronted to experts and compared with available secondary data, mainly referring to the Languedoc region scale, but also to other French wine regions producing wine. Each chain corresponds to an ideal type, of local vs global chains.
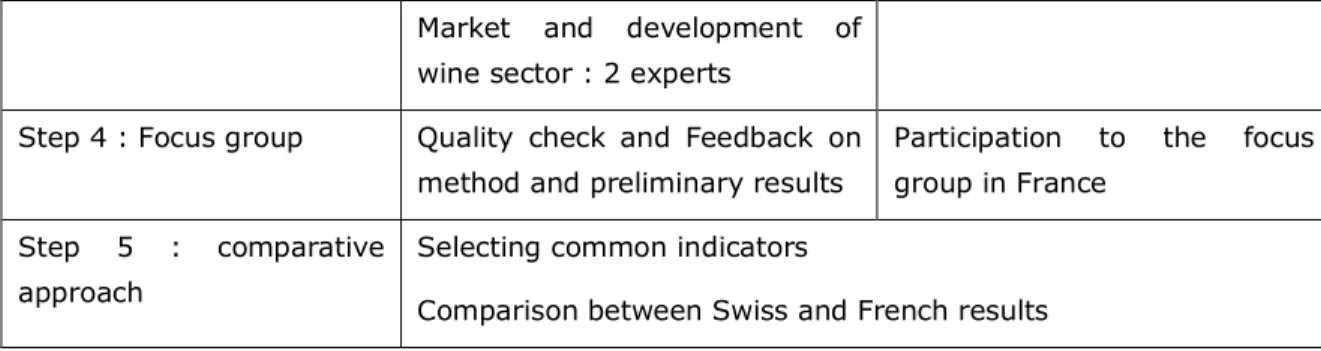
Table 3: overview of the data collection in the two countries
Method for data
collection
Key informant and resource France
Key informant and
resource Switzerland
Step 1 : Literature, study and data review
Selection of indicators and benchmarks
Identification of sub-indicators and key practices Collection of secondary resources
Step 2 : Semi-structured interviews
Analysis:24 previous interviews Farmers : 6
Cooperative managers :2 Trader : 0 (secondary data and experts)
Retailers : 2
Grape growers- wine makers: 26
Cooperative wine makers:2 Local shops: 3
National retailer: 1 Input suppliers: 3 Step 3 : Expert interviews Bulk wine experts : 3
PDO experts : 2
Cantonal service director: 1 Journalist: 1
Market and development of wine sector : 2 experts
Step 4 : Focus group Quality check and Feedback on method and preliminary results
Participation to the focus group in France
Step 5 : comparative approach
Selecting common indicators
Comparison between Swiss and French results
The French team, with the collaboration of the Swiss team implemented a participative approach in order to reinforce the reliability of the methodological approach. Experts from scientific and technical areas have been involved at different steps of this assessment process, either during individual interviews or through a collective workshop in Montpellier (cf. WP3 French Case study report).
3 Results
This chapter describes the results obtained as the scores of performance for both countries and four chains per dimensions (economic, social, environmental and health). The complete table of data and results can be consulted in annex 1.
3.1 Economic dimension
Regarding the economic dimension, the study intends to identify different pathways in coordination with chain actors and to analyse conditions of added value creation and distribution.
The economic dimension was captured through three indicators that cover key issues like producer's income, distribution of margin within the chain, and labour productivity in terms of chain contribution to employment.
The scores of producer’s net income have been calculated according to different benchmarks adapted to each country (national agricultural average for Switzerland and regional wine production average for France). Producer’s income is much higher for the Swiss local wine chain. This better performance results from local market conditions (highest demand and prices in Switzerland) and from different adjustment variables, such as investment, production costs and potential grape yield (higher in Switzerland). In the global bulk chain, grape growers have the highest net income among the three Languedoc chains. This is a consequence of recent increase of the wine prices on international bulk market, combined with the higher yield allowed by the PGI label. In the global bottled wine chains, added value creation is higher but producer’s net income varies considerably, according to the quantity of wine produced and to the level of costs and investment required by the PDO code of practices. In the local wine chains, producer’s income is even lower, due to higher costs of labour (local marketing is time consuming) and recent investment. Nevertheless, it is important to consider that the same producers are involved in different chains: direct sale at the cellar, bottled wine on the national market or for exportation. Net income for bottled wine producers varies between 15,000 and 20,000€ per Annual Work Unit.
The labour per unit of land is much higher in the Swiss local wine chain than in all French chains. In the French case, the local wine chain is employing more people per unit of land than the global chains. However, we have not considered the impacts on jobs creation outside the vineyard unit. The difference between the Swiss and French local chains may be due to the topography of the area which does not allow for much mechanization, as well as choices made by farmers to harvest by hand for instance. The French annual work unit (AWU) corresponds to 1,607 hours, whereas the Swiss one is 1,800 hours. From this point of view, the difference between both countries is less significant.
The “distribution of added value across the chain” has been assessed trough the margin received by producers for grape or wine sales. This indicator corresponds to the relative difference between the price received by the producer and the price paid by the consumer per equivalent wine bottle (eqbtl). We assume that the higher the producer margin is, the better the chain performs in terms of the distribution of the margin. However, only small volumes of wine are sold in local chains in Switzerland and in Languedoc-Roussillon. Indeed, local wine markets in both countries represent a limited part of the total production. The expansion of these local chains to a bigger share of the production volume faces the challenge of finding enough commercial outlets.
As far as the local and global French chains are concerned, we calculated the average value (turnover) created per unit of land. This complementary variable shows that i) local wine chains provide an average of 20,000€/ha, ii) global bottled wine an average of 14,000€/ha and iii) global bulk chain 7,000€/ha. Grape growers involved in the bulk chains need to cultivate three times the space than the wine producer in local chains, in order to obtain the same turnover. Nevertheless this ratio is less than two times when we consider the net income for farmers (see above).
Before analysing certain aspects of chain governance, we describe the distribution of margin between wine chain actors/steps. That makes the strategic hot spots more visible along the chain.
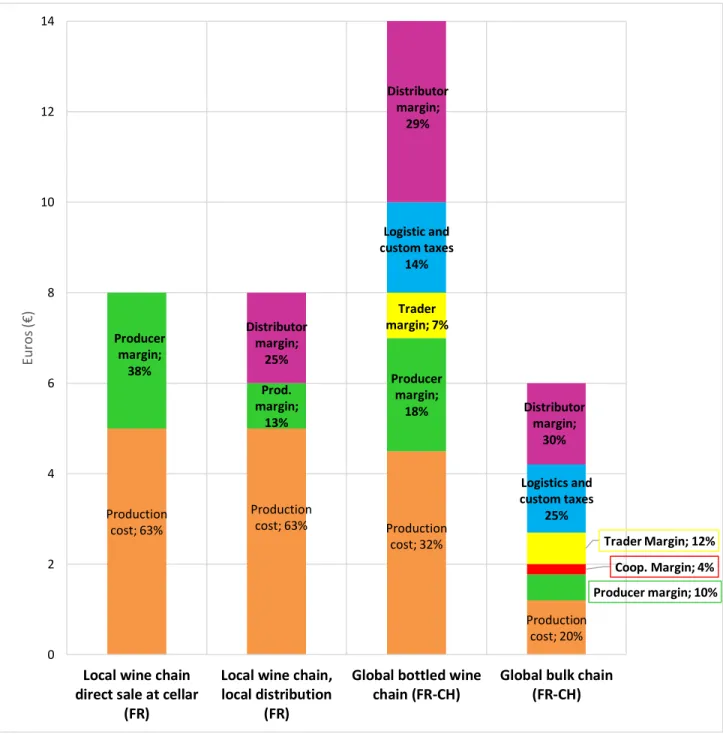
On the y-axis figure 6 represents the total price in euro of a bottle of wine sold to consumers in each chain. This value is distributed between the actors and expenditure items. Thus, we calculated for each chain, the amount of margin collected by each actor and the value of the three main expenditure : i) production cost, ii) logistic cost and iii) customs taxes. Each item is expressed in percentage of the final bottle price.
Each result corresponds to an average based on primary data, confronted to reference studies. In each case, production cost cumulates the processing cost of 75 centilitres of wine, the cost of the “dry matter” (bottle, packaging…) and some services (bottling, labelling…). At the production level chain actors are wine producers (for local and global bottled chains), grape growers and the cooperative cellar (for bulk chain). Producer’s margin includes taxes, financial cost and producers’net income. Traders are involved in global chains with different functions. In the bulk chain, wine merchants fulfil the role of buyer, blender, bottling, marketing… while in the global bottled wine chain, traders are focusing their management on logistic,
sourcing and marketing. Except in the case of direct selling, distributors capture substantial margin, which has been estimated with secondary data.
In local chains, especially in the case of direct sale at the cellar, producers collect 100% of the margin and production cost represents 62.5% of the final bottle price.
In the case of local chain involving a local retailer (f.i. wine shop), the wine producers receive 33% of the margin, corresponding to 12.5% of the final
Production cost; 63% Production cost; 63% Production cost; 32% Production cost; 20% Producer margin; 38% Prod. margin; 13% Producer margin; 18% Producer margin; 10% Coop. Margin; 4% Trader margin; 7% Trader Margin; 12% Logistic and custom taxes 14% Logistics and custom taxes 25% Distributor margin; 25% Distributor margin; 29% Distributor margin; 30% 0 2 4 6 8 10 12 14
Local wine chain direct sale at cellar
(FR)
Local wine chain, local distribution
(FR)
Global bottled wine chain (FR-CH)
Global bulk chain (FR-CH) Eur o s (€ )
price. The distributor/retailer margin varies between 25 and 30% of the final price. In local chains, we noted that bottles are sold at the same price whatever the location of the selling point is (excepting restaurants where the price is much higher).
In the global bottled wine chains, the final bottle price is on average 14€, while in global bulk chains, a bottle of wine is sold (in Switzerland) for on average 6€, which imply differences in decision making mechanisms and market management. Wine producers collect more added value in global bottled chains than in bulk ones. Producer’s margin is on average 2€/bottle in global bottled chains and on average 0.57€ in bulk chains. Consequently, in bulk chains, grape growers and cooperatives tend to both reduce production cost, and increase their volume (yield and physical productivity of workers through mechanization). In global bottled wine chains, the average production cost is slightly lower than in the local chains, but it depends on the size of each export market. Wine producers in global bottled chains can take advantage from marketing scale economy (f.i. by increasing the volume of each shipment) but they do not have a lot of flexibility in reducing production cost, due to the importance of maintaining high wine quality and standards specifications. In global bottled chain, actors maximize the creation of added value, while in bulk chains added value is created by producing a high quantity of wine.
3.2 Social dimension
3.2.1 Governance
To reach the international mass market the wine supply must be regular, reactive and offering sufficient volumes (basic and premium wine).
In the global bulk chain, wine production is managed at farm level by grape growers driven by production objectives. Production and market strategies are mainly defined at the cooperative level by a board of directors in which, the pair composed by the president and the manager has a leading role in the economic development. Cooperative and private domains specialized in bulk wine markets tend to enforce a "cost/volume" strategy present as an intensification of grape production process (between 80 to 110 hl/ha). Three main medium and large scale strategies are implemented in global bulk chains:
1. Investment in production (irrigation systems, adaptation of plots of vine to mechanization to maximize profits and reduce costs.
2. Investment and concentration of transformation tools (manage high quantities of wine = gain in negotiation power)
3. Specialization in one main market strategy (bulk or bottles)
Global chains in general are influenced more by market dynamics and price volatility.
The bottled wine exportation market is focusing on quality and image. The final consumer is assumed to be a connoisseur. Wine production in global bottled markets is close to local resource management regarding practices associated to PDO specifications or organic agriculture. They differ in the type of standard implemented. In both cases, global chains require a strong support from producers organization, interprofessional associations, and regional institutions whose roles are to coordinate at regional level actors’ strategy to enter the market (find clients, make contract negotiations, organize logistic from production area to client) and build a specific identity of Languedoc wines (bulk or bottled) to raise international client awareness. Competition on local (regional) markets is strong and marketing objective are the following: building regular clientele, selling off the stock, and negotiations with restaurant… are very difficult and time consuming. The Languedoc local market covers about 2 million hectolitres (including tourists) compared to the average 12 million hectolitres produced at regional level. The visibility is very important as clients / consumers have few time to search. Communications in the local press, websites, fairs, etc. are useful for building customer loyalty.
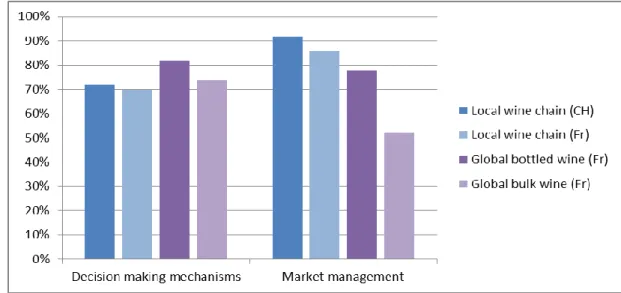
Figure 7: scores of the four wine value chains in the attribute Governance (social dimension)
3.2.2 Information and communication
For the first indicator, the difference is solely explained by the fact that local chain producers have a direct contact with their consumers and can thus provide a lot of information directly to them. All chains perform with at least 50% as they provide access to information about the product through other means like a website.
The other indicator measures the availability of information on the label, whether it fills the legal requirements and whether more information on the product is provided. Local chains do not provide much more than what is legally required as they have direct contact with producers and do not feel the need to give information directly on the bottle. However, the PDO labelling gives valuable information on the product, which the consumers may know. On the other hand, the global bottled chain in France seems to display much more information on the bottle. This can be due to the need to build trust with consumers and to be categorised as high-quality wines. The global bulk chain, which is blending wine from different producers, cannot display much information on the final product. They are rather differentiating their product through branding strategies. J.P. Chenet for instance focuses on the appearance and grape varieties.
0% 10% 20% 30% 40% 50% 60% 70% 80% 90% 100%
Availability of information Product labelling
Local wine chain (CH) Local wine chain (Fr) Global bottled wine (Fr) Global bulk wine (Fr)
Figure 8: scores of the four wine value chain in the attribute Information and Communication (social dimension)
3.2.3 Territoriality
Cross-country quantitative comparison for this attribute was not possible due to major differences in the compilation of data and the indicator categories. The Swiss local chain received a high score for the indicator “association of product with the territory” (93%) because of a high rate of PDO or Grand Cru labelling, frequent use of traditional grape varieties (Cornalin and Humagne rouge mostly), and the use of dry stone walls to cultivate on steep land. The performance for the indicator “social cohesion and conviviality” is just above average as it measures the proportion of memberships to available associations.
The French compilation uses results from other attributes to measure the “association of the product with the territory”, as well as other sub-indicators to measure the environmental, social and economic association of the product. From this calculation, it seems that the local (French) wine chain is performing best, while the global bulk chain is performing slightly better than the global bottled chain. For the indicator “social cohesion and conviviality”, the French local chain is performing best and the global bulk chain is performing worst.
Local chains perform better for social relationships in local community through farmers’ participation in local events, local initiatives connecting consumers, cultural activities, or tourism projects. These events do not directly provided incomes and added value creation, but they are long term investment, allowing to be more visible and to reach new clients. In Switzerland, wine production in the canton of Valais is associated with community natural resource management.
It seems that, overall, both local wine chains are more able to link to their territory from a social and traditional point of view. The global bulk chain studied leaves little ability to its producers to choose grape varieties, and does not value the production under PDO or grand cru. Other bulk chains might however be organised differently, as in the case of cooperative bottling, in which producers may have a word to say and give a territorial distinctiveness to their production.
3.3 Environmental dimension
3.3.1 Resource use
Differences in the water use practices are quite little between all chains. It seems that the Swiss local chain is applying a bit less water-friendly practices although this difference could be due to the chosen samples in France. Moreover, this indicator is compiled with categories, which are not weighed according to their importance. Weighing categories could change the results displayed here.
Material use practices seem more or less the same for all chains studied. Improvements could be made in the sharing of machines, by using less-consuming machines, using lightweight bottles and recycled corks. All these practices are only partially followed in each chain.
3.3.2 Biodiversity
The apparent difference for the indicator “species conservation practices” between the Swiss local chain and the French local chain is more likely due to differences in the compilation of results (average frequency vs. overall presence or absence) for each indicator. Indeed, for many practices, most Swiss producers are applying them but some of them do not; and this also
probably is the case in France, though we cannot confirm it. Grape producers for the global bulk chain seem to apply fewer environmentally friendly practices than producers from the other chains.
All PDO-producing chains perform very well for the attribute “diversity of production”. This general result hides the fact that most producers in the French bottled chains claimed to produce in diversified systems while Swiss producers cultivated from a broader range of grape varieties. The number of different varieties and the presence of traditional or rare ones are differentiating the global bulk chain from the others. This is probably because of the selection of grapes in the bulk chain, which does not allow for a wide range of varieties.
3.3.3 Pollution
This indicator has been compiled using the mode of transport used and the type of product (bottled or bulk). The global bulk chain is performing best as it carries bulk wine in big quantities, thus emitting a small amount of GHG per volume of wine. The local wine chains are performing better than the global bottled chain as very little transportation is done until the consumer (small deliveries to local businesses mostly). However, if we consider the whole chain, bottling is done before shipping to foreign countries and distribution in supermarkets. Thus the global bottle chain is probably emitting more GHG than this graph would suggest. Another limit of this indicator is that it does not include the transportation from consumers going to the selling place and bringing their purchase home. To this extent, it could be argued that both local chains have a stronger impact because of consumers coming specifically or for a touristic purpose.
The apparent difference for the indicator “Environmental pollution mitigation” between the Swiss local chain and the French local chain is more likely due to differences in the compilation of results (average frequency vs. overall presence or absence) for each indicator. Producers from the global chains seem to apply fewer practices linked to reducing environmental pollution. Indeed, grassing and limited use of agro-chemical products were not applied by interviewed producers for these chains.
GHG emissions are strongly linked with production practices. We choose to describe trends observed in chains under study, in order to complete the analysis of GHG emissions at transportation stage.
The most discriminating criterion is the rate of mechanization, for production and harvest stages. Global bulk chains focus on mechanization, while local chains develop manual practices. We note that global bottled wine chains
have an intermediary position for the use of pesticides and the rate of mechanization.
In local chains, the willingness to reduce negative impacts on the environment is emphasised and the use of fuels is low, resulting from limited logistic operations and little use of machinery, even if GHG emission by consumers can be higher than in the other chains (wine tourism could be questioned on this point). In global bulk chains, transport in bulk reduces GHG emissions, but it depends on i) the location of the bottling operation (bottling in Bordeaux and then exporting to Swiss strongly reduces the mitigation), ii) the distance between production and consumption, and iii) the weight/type of the bottles (lightweight bottles). In the global bottled wine chains, the distance could be shorter than in the bulk chain (this is the case in our study for Switzerland), but the transport of small volumes by truck is less sustainable.
3.3.4 Health dimension
The wine sector is marked by health issues at both production and consumption stages. On the consumption side, food safety is linked with the wine biochemical content (in particular concentration of sulphite, occurrence of methanol, pesticide or ochratoxin) and with the crucial issue of alcohol, which calls for the consumer’s responsibility. On the production side, health issues are related to agronomic practices and to the risks of exposure to pesticides. In both cases, awareness is growing in public, civil society and private spheres. Thus, the control of food safety follows two main ways. Firstly, at the production stage, food safety requires i) the control of chemicals products (nature and volume) spread in the vineyard and ii) the use of protection equipment by agricultural workers. Secondly, the control on wine content is made all along the chain, but mainly during the wine making process, when additives (such as sulphites) are put in the wine.
Local wine chains seem to follow less food safety standards than more global ones. One explanation is that food safety and quality risks management are carried out by interpersonal relations and rely on trust between producers and consumers. In some cases, these practices can partially substitute to standards. Organic agriculture label and studied PDO label are also used in local chains because i) they are seen as non-substitutable guaranty for food quality, ii) the producer can take advantage from selling the same labelled wine in both local and global chains.
We thus included the notion of “direct relation between producer and consumer” in our assessment of the, indicator "food safety and controls". The use of food safety standards is more widespread in global chains. Standards like ISO 9001 and ISO 22000 are usually tools for longer supply chains to provide guarantee to (intermediary) stakeholders. Our results point out that firm safety/quality strategy depends on three main criteria : i) wine market segment i.e. level of quality/price and size of the market, ii) client requirements, and iii) number of stakeholders involved in the product flows. The use of sulphur dioxide is not significantly different between all chains. This additive is used at different steps of the wine production to keep it out from biological contamination and oxidation. It is particularly necessary when wine has to be transported over long distances or stored for long time periods. 0% 10% 20% 30% 40% 50% 60% 70% 80% 90% 100%
Food safety standards and controls
Artificial additive : sulphur dioxide
Local wine chain (CH) Local wine chain (Fr) Global bottled wine (Fr) Global bulk wine (Fr)
4 Trade-offs
4.1 France
4.1.1 Environment vs pollution
In France, one of the main environmental policy objective is to reduce the use of pesticides in agriculture and viticulture by half by 2018 (but recently revised to 2025), to promote organic production and to develop new environmental standards (but recently weakening of some of these proposals). Global chains may be more concerned by this measure than local ones, because of highest yields and input consumption. In all chains, actors are taking into account the climate change issue (growing water stress and need), and advocate for a “smart management” of water in viticulture.
4.1.2 Territory: Landscapes and "Terroir identity"
The land use is impacted by the marketing choices, between bulk mass market, export in bottle or local bottle market. The bulk occupies a large area and strongly impacts on wine-growing plains. Wine sold to local markets is often associated with wine tourism, leading to stronger investment in landscape management.
4.1.3 Food safety strategy and control
Food safety controls differ according to local vs global chains but these controls finally lead to similar performance in all chains. It results from the high level of organization and control in the wine industry (historically due to the alcohol issue, but also to the need of quality control and guarantee).
4.1.4 Market management and resilience to market changes
A large number of Languedoc wine producers and wine cooperatives combine the three models of chains presented in this case study. This strategy of marketing chain diversification allows to better adapt to market fluctuations (price and demand). At the same time it contributes to building the multidimensional links with the territory.
In global chains, market access is based on quality / price ratio, traceability, flexibility and responsiveness. The Languedoc wine supply offers different ratios of quality / price, corresponding to different segments of market.
4.1.5 Marketing strategy of Wine Quality and farmers remuneration
In the lowest price segment (at least 2/3 of the whole wine production), the price volatility is high and the average margins are low. Bulked wine producers’ income depends on the ability to supply significant wine volumes, with regular and standardized quality responding to traders/client’s specifications. Mechanization of production, harvest and wine making remains the best way to reduce costs and to increase the productivity. The creation of added value in the bulk chain does not refer to the notion of
“Terroir” and is mostly distributed outside the wine producing area. Wine cooperatives keep on merging in order to provide larger volumes of wine, bought by some oligopolistic big traders/retailers, who are driving these global chains.
4.1.6 Governance models based on Terroir specificities and Market specifications
In the highest quality segment, including the local and the global bottled wine chains, prices are more stable resulting from specific territorial governance of the chains. Actors of the territorial/production side of the chains have built efficient organizations that provide guarantees, trust and desire to the consumers. This case study thus shows that chain performances are closely linked with their governance organization: following Gereffi’s typology of governance models (2005), the global bulk chain appears to be based on the ‘captive’ model, driven by retailers and customers. The local chains can be analysed as hybrid forms between the ‘market model’ and the ‘relational’ model.
On local markets, the value of wine is determined by both the Terroir specificities and the geographical proximity to consumption places. The wine chains contributions to social externalities have been positively assessed for both local and global chains. These contributions have complementary impacts on territorial project, territorial identity, territorial economy, and territorial attractiveness.
In both local and global PDO wine markets, the wine producers seek to improve the visibility/reputation of their products and to develop their capacity in oenology and marketing. The development of new wine markets through bottle global chains is supported by local and regional organizations. Wine interprofessional assocations and producers associations, connected to local and regional governments, play a key role in building a collective strategy to have better access to global markets. Referring to Gereffi’s typology, the governance of global bottled PDO wines thus corresponds to the “modular” governance model.
4.2 Switzerland
It is hard to present trade-offs specific for the wine sector in the Swiss case as only one chain has been studied. However, relations could be established between different performances, which are mostly due to the topography of the area (steep), the economic environment (notably the high cost of labour), the marketing strategy of the winemakers (selling high-quality wine directly to the consumers) and the agricultural policy (notably the high subsidies related to environmental performances). These contextual factors together can be considered as the cause of the current situation in the Valais wine sector.
The topography in the Valais wine-producing areas is steep as it provides a good sunshine for the grapes as well as the Foehn effect which warms the air on the Northern side of the valley. This environment is responsible for the building of many infrastructures (dry-stone walls to enable cultivation and “bisses” to carry the water for irrigation). Small plots have been cultivated and are now belonging to many different owners. The winegrowers studied in this case often have dispersed plots bought progressively to different small owners over the years. This environment therefore provides winegrowers with a difficult but valuable environment to produce potentially high-quality wine with a strong territorial identity.
The cost of labour in Switzerland is particularly high, which does not enable to produce cheap wines because of the important amount of work required for vine growing and the harvest. Seasonal workers used to come from the neighbouring regions but as the economic situation has changed, they now mostly come from the eastern part of the EU, paid low wages compared to the Swiss situation but high in more absolute terms. The work has to be even more done by hand since the plots are small and sometimes remote from one another. However, the spreading of fungicides is often done by helicopter, with winegrowers sharing the cost of it and local institutions organising the spreading in order to limit the risks for citizens and avoid spreading on unwilling wine-growers’ plots.
The marketing strategy of wine-growers in the area mainly depends on the surface of vineyards they can harvest, as a study coordinated by the Agricultural Chamber of Valais revealed. Indeed small landowners tend to only produce grapes for small revenue and are keeping their activity as a heritage they want to maintain. Bigger landowners most often produce their own wine and sometimes buy grapes from other producers. This wine is most often sold in bottles while sometimes sold in bulk. Direct selling allows winemakers to get the whole added value back and sustain their high costs of production. The ambition of the Valais winemakers is to get ranked as high quality wines and to get better known and drunk in Switzerland, with the export market only to keep up the fame of the Valais region and raise the interest of potential tourists and wealthy Swiss people.
The agricultural policy in Switzerland relies mostly on high subsidies linked to ecological requirements. This situation is justified by the multiple services provided by farmers in general and winegrowers in particular. These subsidies are to a large extent responsible for the land use in the Valais region, where vineyards still use an important share of the land, and visually cover landscapes on the right side of the Rhône.
5 Cross-cutting issues
In this section the question “What are the cross-cutting issues and emerging thematic questions and priorities for in-depth investigation?” is being addressed. Specifically, teams discuss what issues and trade-offs are similar in the two countries. Research gaps and further research questions are also identified.
5.1 Employment
Both local chains and, to a lesser degree, the global bottle chain, employ many seasonal workers for pruning and harvesting, in addition to permanent employees for routine work. On the other hand, the global bulk chain seems to rely much more on mechanized work, and does not provide many jobs for the region. This can be due to the size of vineyards as well as the topography.
In the Swiss local chain, seasonal workers are hard to find and may be underpaid compared to the Swiss cost of living (currently around 15 CHF/hr). This debated wage is still higher than the minimum offered in France, which is around 9.5€/hr. It seems that payment in black can still be found, though quite rare since the free movement agreements within the EU make the registration of workers very easy. The Valais canton suggested the federal law to force employers to declare their workers on their first day, as is the case in France. This proposal has not been voted yet.
Vineyards also have a strong effect on the rest of the local economy as they boost the image of the region and attract tourists. An important share of the sales for producers from the local chains comes from tourists. Vineyard landscapes are particularly attractive, especially in the Valais region where they are cultivated with terraces on the mountainside.
5.2 Branding (trust and labelling)
Branding in the wine sector is a critical issue to distinguish wine productions. This can be done as a region (through PDOs for instance), as a producers’ cooperative or as a private domain.
Winemakers in the same region have to agree on a marketing strategy: what kind of image and product do they want to offer to customers. The PDO scheme is efficient in that way, as it pushes winemakers to follow a same set
of rules. At the same time it offers individual domains a range of products from which they can decide, depending on the particular environment and individual choices, how they want to distinguish themselves from their neighbours.
PDO sets of certifications are a powerful tool to reduce yields and reach higher quality production. This was their main use at their creation: providing better quality wine to satisfy a changed and changing demand, in France as well as in Switzerland. However, the main challenge for both countries’ productions now is to distinguish themselves from the high quality wines produced in the “new world” countries (South Africa, Chile, Argentina…). Labelling for wine is usually not perceived by direct-selling producers as an efficient tool to communicate about their wine. They prefer building a word-to-mouth reputation and trust through wine tastings, participation to fairs, and direct selling. More global chains, on the other hand, need to build trust through efficient and more exhaustive labelling.
Organic labelling for wine in all studied chains is quite low as wine-makers seem to fear the administrative burden and the certification cost, while consumers are not particularly demanding of such standards for high-quality products. Some domains want to avoid a label associated more with food and cheaper products.
Fraud management is also particularly important, as it guarantees that all certifications were complied with. PDO members need to make sure that all members are abiding by the standards to secure the image of the specific PDO scheme. In the case of the Valais wine chain, the Giroud case (a court case with financial fraud and excessive blending with various grapes including black market grapes) revealed a lack of transparency and little coherency of the whole control system. The resulting scandal and discontentment on the consumers’ and producers’ sides are likely to soon bring changes in the way controls are coordinated, to avoid frauds regarding the traceability and the yield limitations in the future.
5.3 Subsidies
Direct payments in Switzerland are quite high, especially in the case of vines cultivated on steep land or on terraces8. Surfaces of interest for biodiversity are also valued through direct payments, including for “Wine surfaces with natural biodiversity”. Organic production is subsidized as well. However, all these subsidies are granted provided winegrowers abide by the Proof of Ecological Performance (PEP). These subsidies have a strong influence on the ecological and economic performance of winegrowers in Switzerland. The actual cost of the wine production is therefore not completely included in its price. High subsidies for agriculture are a result of its official role according to the federal constitution, as it not only is to provide agricultural products, but also to maintain natural resources and landscapes and to provide an economic activity for the whole territory.
5.4 Choice of cultivars
As a perennial crop which is kept for 35 to 50 years, the choice of cultivars is critical for wine-growers. They need to satisfy their particular customers, follow the PDO certifications, and anticipate climatic and demand change. The use of traditional cultivars is a hard choice. They are usually well adapted to their environment but may need greater care and may not be suited for a changing climate. For example, the local cultivar “Cornalin” in Valais, is quite sensible to heat and hard sunshine and requires attentive care, but on the other hand, customers value it as a Valais wine. PDOs have distinguished themselves by using particular cultivars, making wine from one (as is usually the case in the Valais region) or blending a few (more common in France). The list of authorized cultivars is longer for the Valais PDO (29 red cultivars) than for the French Languedoc PDO (12 red cultivars). This number is generally reduced in the case of more specific designations called “crus”. Since consumers associate PDOs to cultivars, it is hard for winemakers to change their production, even progressively. Moreover each cultivar’s growing and grape processing requires specific know-how to get the best out of it, which wine-growers would have to learn again.
8
Changes in the cultivars grown are however encouraged by the European Union which encourages these practices by allowing each region to subsidise such practices (removing vines and planting others9 )
5.5 Research gaps
Among many methodological discussions and limits, we may note that performance assessment through attributes and indicators remains a static approach. We mainly used qualitative sub-indicators and we focused on practices, highlighting actor’s strategies. Nevertheless, the analysis makes little place for a more comprehensive approach of performance, as well as for the inventory of “good practices” that could be promoted in the wine industry.
At this intermediary stage of research, criticisms can also be formulated on our benchmarking methodology. We started the benchmark using a participatory approach with experts, but therefore we had to refer to our own expertise that obviously limits the robustness of the references.
For many indicators, we were not able to collect all the needed information along the chains. We were often forced to focus on the farm level, where more information is available. Consequently, we assume that our assessment is sometimes “production oriented”, especially in the case of the global bulked wine chain. Nevertheless we reduced this bias by using expert contribution and secondary data, often coming from studies on similar wine chains in other regions.
We lack insight on the consumers’ side for all chains, and on the distribution side for global chains. This is mainly due to time constraints as many interviews were carried in Switzerland and three different chains were studied in the French case. In particular, the continuity of the global chains abroad is not much covered by this study and would need to be further studied. Some of the largest businesses were reluctant to give interviews or disclose business data.
The concept of representativeness of the sample was differently interpreted between both countries. In the French case, the analysis tried to cover the diversity of supply chains, which can be connected as one winemaker can
9
http://www.franceagrimer.fr/filiere-vin-et- cidriculture/Vin/Aides/Restructuration/Aide-a-la-restructuration-et-reconversion-du-vignoble
produce for different markets. In Switzerland, the study tried to analyse in depth with many interviews a particular kind of winemaker (direct-selling) and their related supply chains. This difference in the approach makes the comparison more difficult. It may have been easier if one global chain had been analysed in each country with a reasonable sample of stakeholders. We eventually used different categories for some indicator although coordination was regularly conducted throughout. We had to recompile each chain’s performance for each of the qualitative indicators, based on new common sets of categories.
6 Conclusion
The comparison allowed better assessing and explaining the main differences between the French and Swiss still red wine value chains studied. While both local chains present similarities, differences appear related mostly to employment, environmental performances and income between these two, as the Swiss chain performs better for these. The organisation of the value chain and the cooperation between stakeholders seems again to have a major influence on the performance of each chain for almost all attributes studied, as it determines common strategies and allows building a brand-like image and trust with consumers. Product labelling is eventually more important in the more global chains as this is their main mean to carry messages to consumers on the quality of the product.
Subsidies in the Swiss case seem to have a strong effect on the behaviour of the wine-growers as it gives strong incentives for environmental practices as well as consequent incomes to winegrowers. The problematic of choosing grape varieties proved to be quite different between chains and countries as they account for a large share to a common image of chains or regions and changing may be hard for varieties well-established as local.
Unfortunately time constraints did not allow us to study the consumer side of supply chains directly and relied on secondary data. Differences in the data gathering process regarding the number of actors interviewed made the quantitative comparison less relevant, this comparison is thus more qualitative, and focused more on explaining the contextual differences between chains and countries and their effects on each chain’s current situation.


![[PDF] Débuter avec le langage Prolog cours pdf | Formation informatique](data:image/gif;base64,R0lGODlhAQABAIAAAP///wAAACH5BAEAAAAALAAAAAABAAEAAAICRAEAOw==)