Advanced Data Bus Architecture
Using CDMA for Highly Reliable Systems
by Naoshin Haque
S.B. Electrical Science and Engineering, 2006 Massachusetts Institute of Technology
Submitted to the Department of Electrical Engineering and Computer Science in Partial Fulfillment of the Requirements for the Degree of
Master of Engineering in Electrical Engineering and Computer Science at the Massachusetts Institute of Technology
June 2007
©2007 Massachusetts Institute of Technology All rights reserved.
Author________________________________________________________________________ Department of Electrical Engineering and Computer Science May 11, 2007 Certified by____________________________________________________________________
Sharon L. Donald Group Leader of Digital Systems VI-A Company Thesis Supervisor Certified by____________________________________________________________________
Joel E. Schindall B. Gordon Professor of Electrical Engineering and Computer Science M.I.T. Thesis Supervisor Certified by____________________________________________________________________
Alejandro D. Dominguez-Garcia Ph.D. Candidate in Electrical Engineering and Computer Science M.I.T. Thesis Co-Supervisor Accepted by____________________________________________________________________
Advanced Data Bus Architecture
Using CDMA for Highly Reliable Systems
by Naoshin Haque Submitted to the
Department of Electrical Engineering and Computer Science May 11, 2007
In Partial Fulfillment of the Requirements for the Degree of Master of Engineering in Electrical Engineering and Computer Science
Abstract
Conventional fault-tolerant architectures require extensive cross-strapping of redundant modules. The purpose of this thesis is to prove the feasibility of the use of code division multiple access (CDMA) to permit shared data bus architecture for fault-tolerant applications. Four families of pseudorandom codes, the Barker, gold, maximal length, and GPS C/A codes, were evaluated for their performances with respect to minimum signal gain under different uncertainties, such as varying voltage and noise levels. For data buses with three devices, the GPS C/A code performed the best. A voting process consisting of two rounds of voting, based on an extension of a solution to the Byzantine general’s problem, was used to demonstrate that CDMA could be used successfully to contain a single fault in a data bus with three devices. Finally, extensions of this thesis were considered, such as having a variable number of devices on the advanced data bus system.
VI-A Company Thesis Supervisor: Sharon L. Donald Title: Group Leader of Digital Systems
MIT Thesis Supervisor: Joel E. Schindall
Title: B. Gordon Professor of Electrical Engineering and Computer Science MIT Thesis Co-Supervisor: Alejandro D. Dominguez-Garcia
Acknowledgements
The research presented in this thesis was made possible by the help of many people in the MIT and Draper communities. I would like to thank my VI-A Draper thesis supervisor, Sharon Donald, for all of her help in planning and initiating this project, as well as for her continued advice, feedback, and support throughout my entire thesis. Next, I must thank my MIT thesis supervisor, Professor Joel Schindall, for really pushing me, giving me advice, and helping make my thesis more focused and coherent. I would also like to thank my MIT thesis co-supervisor, Alejandro Dominguez-Garcia, without whose help, encouragement, ideas and thorough feedback, I would not have been able to present my ideas in this thesis as clearly or systematically.
I could not have done all of my experimental testing and data collection without the initial ideas and help of Michael Aiken in using the ComBlock© modules. Furthermore, I must thank Susan Amaral for ordering all of the ComBlock© parts that I needed every few weeks and Patricia Carr for helping me wire together all of the modules for my experimental setups. Alain Zarembowitch, the founder and president of ComBlock©, also gave me valuable technical assistance in using the ComBlock© modules. Without Ingrid Crete, I would not have been able to include pictures of one of my experimental setups. I would also like to thank MIT and Draper Laboratory for funding my research.
I would like to thank all of my friends for keeping me company as I wrote my thesis, for always being there when I needed someone to listen or talk to, for giving me
Finally, I would like to thank my parents, Mohammad and Monoara, and my older sister, Farhana, for all of their loving support. I would never have made it this far had it not been for all of their wake-up calls, continual encouragement, challenges to always strive to do my best and be ambitious, and amazing patience to listen to all of my stresses and worries about my thesis and life in general. Thank you.
Contents
1 Introduction 13
1.1 Spread Spectrum Communication...15
1.2 Previous Work...17
1.3 Thesis Outline ...18
2 Experimental Setups 21 2.1 Single Device Data Bus System Setup...21
2.2 Multiple Device Data Bus System Setup...22
2.3 Direct Sequence Spread Spectrum Modulator...22
2.4 Pseudorandom Codes ...25
2.5 Other Modules...27
2.6 Voltage Margins...28
2.7 Summary...29
3.3. Theoretical Predictions...34
3.4. One Active Device on Single and Multiple Device Buses ...36
3.5. Two Active Devices on Multiple Device Bus ...38
3.6. Three Active Devices on Multiple Device Bus ...40
3.7. Pseudorandom Code Family Analysis...41
3.8. Conclusions...45
4 Single-Fault-Tolerant Data Bus System 47 4.1. Solutions to Byzantine General’s Problem...47
4.2. Single-Fault-Tolerant Data Bus System Setup ...49
4.3. Voting Process ...51
4.4. No Fault Data Transmission and Reception ...54
4.5. Single Fault Containment ...55
4.6. Two or More Faults Introduced in System ...57
4.7. Summary...58
5 Concluding Remarks 59 5.1 Future Research...60
List of Figures
1-1 Conventional fault-tolerant architecture...13
1-2 Proposed fault-tolerant architecture ...14
1-3 Model of spread spectrum digital communications system [2] ...16
1-4 Spectra of various signals in spread spectrum system: (a) Data spectrum, (b) Pseudorandom signal spectrum, (c) Interference noise, (d) Modulated spectrum, (e) Demodulated spectrum...16
2-1 Single device data bus system setup...22
2-2 Multiple device data bus system setup ...23
2-3 Block diagram of direct sequence spread spectrum modulator [5]...23
2-4 Generation of pseudorandom bit stream [5] ...24
2-5 Generation of gold sequence using two LFSRs [6]...26
2-6 Generation of maximal length sequence using one LFSR [6] ...26
3-2 Required minimum signal gain vs. (a) voltage and (b) noise gain for two
active devices ...39
3-3 Required minimum signal gain vs. (a) voltage and (b) noise gain for three active devices ...40
3-4 Required minimum signal gain vs. (a) voltage and (b) noise gain for Barker code family ...42
3-5 Required minimum signal gain vs. (a) voltage and (b) noise gain for GPS C/A code family ...42
3-6 Required minimum signal gain vs. (a) voltage and (b) noise gain for gold sequence family...43
3-7 Required minimum signal gain vs. (a) voltage and (b) noise gain for maximal length sequence family...44
4-1 Solution to Byzantine general’s problem with signed messages ...49
4-2 Single-fault-tolerant data bus system setup ...50
4-3 Winsock code to transfer data from computer to devices and vice-versa ...52
4-4 Each round of voting process block diagram...53
A-1 Single device data bus system setup...63
A-2 Close-up of modulator, demodulator, and bit error rate modules...64
A-3 Register settings for Barker code ...65
Chapter 1
Introduction
Fault-tolerance is extremely important for safety- and mission-critical systems, such as space vehicular systems which are used for long term space flight and demand high reliability. Systems such as these require autonomous fault containment. However, conventional fault-tolerant architectures require each device to be physically cross-strapped to every other device, as indicated in Figure 1-1. The main problem with this architecture is the tremendous increase in the size, weight, and number of cables needed every time a new device gets added to the architecture.
Device 1 Device 2
The purpose of this thesis is to prove the feasibility of counteracting the problems of conventional fault-tolerant architectures by using the architecture displayed in Figure 1-2. In particular, this thesis will focus on the use of code division multiple access (CDMA). Through the use of orthogonal pseudorandom codes, CDMA technology allows multiple users to communicate on a single data bus. Since all of the devices are connected on the same bus, as shown in Figure 1-2, the volume and weight of the cables is drastically reduced in comparison to the conventional architecture.
Figures 1-1 and 1-2 are examples of fault-tolerant architectures using three devices. Both of these architectures show the use of dual wired systems, which increase the reliability of the systems by eliminating single points of failure. In the case of the conventional fault-tolerant architecture, shown in Figure 1-1, it can be seen that six cables are needed, while the proposed architecture of Figure 1-2 only requires two cables. This architecture is also easily and efficiently extensible, as new devices may be added to the existing data bus without additional cross-strapping. While the total number of devices on the advanced data bus system is still limited by the number of orthogonal pseudorandom codes in a pseudorandom code family, this extension can be accomplished within that limit without additional cabling.
1.1 Spread Spectrum Communication
The data bus architecture will be using CDMA, which is a form of direct sequence spread spectrum communications. In this type of communications system, the signal is spread over a much wider bandwidth, typically 100 times wider, than it needs to send information. Each signal is modulated by an independent code, allowing many users to use the same bandwidth. The only receiver that can receive this signal and recover the data is the one that is set to synchronize to the code that was used to transmit the data. These codes are independent of the data being sent and are pseudorandom in the sense that they are deterministic, but appear random to the unintended receiver [1].
A conventional spread spectrum system, shown in Figure 1-3, consists of two identical pseudorandom pattern generators. The first interfaces with the modulator to spread the information data signal, while the other interfaces with the demodulator to despread the modulated signal. The pseudorandom code generated at the receiver must be synchronized in time with the pseudorandom code contained in the modulated signal.
The frequency spectra of the data signal, pseudorandom signal, the interference noise, and the modulated signal received by the receiver are shown in Figures 4(a), 1-4(b), 1-4(c), and 1-4(d) respectively. As shown in the diagram of the modulated spectrum, Figure 1-4(d), there is some interference noise received by the receiver in addition to the modulated signal. If there were no interference noise, the demodulated spectrum, shown in Figure 1-4(e), would be identical to that of the data spectrum. However, since there is interference noise, it gets spread by the pseudorandom signal and
of the power of the interference signal demonstrates the noise immunity of CDMA systems [3].
(a) Data spectrum
(d) Modulated spectrum (e) Demodulated spectrum (b) Pseudorandom signal spectrum Signal Interference noise Signal
Figure 1-4 Spectra of various signals in spread spectrum system (c) Interference noise
Channel
encoder Modulator Channel Demodulator Channel decoder
Pseudorandom pattern generator Pseudorandom pattern generator Information sequence Output data
1.2 Previous Work
While CDMA has typically been used in wireless communications applications, such as in cellular telephone networks, there has also been some previous work using CDMA in a wired bus system. At the Osaka University in Japan, a new data bus architecture using CDMA was designed to be used in parallel processing systems. One of the proposed uses of this architecture is in future gigascale integrated systems due to its drastic reduction of the input and output pins necessary, as well as the reduction of the complexity of the interconnections [4].
The wired data bus system architecture achieved in Japan demonstrated that it is suitable for parallel processing due to its reduction of power dissipation. This reduction occurs because each transmitter has a small voltage amplitude for the modulated signal due to the noise tolerance of the data bus for white noise, through its usage of CDMA. Furthermore, the architecture has great dynamic flexibility, which is desirable for parallel processing systems. Finally, this new architecture proves that CDMA can be used in a data bus system with two transmitters and two receivers to accurately send and receive digital data using a small voltage step. This system used only one pseudorandom code family, the maximal length sequence family [4].
1.3 Thesis Outline
In contrast to the previous work done in Japan, the focus of this thesis is to assess the feasibility of using this type of CDMA wired data bus architecture in a fault-tolerant system. In Chapter 2 of this thesis, the experimental setups for a single device data bus system and a multiple device data bus system will be described. These setups will later be used to demonstrate that a wired bus using CDMA with ultimately three devices can reliably send and receive data messages.
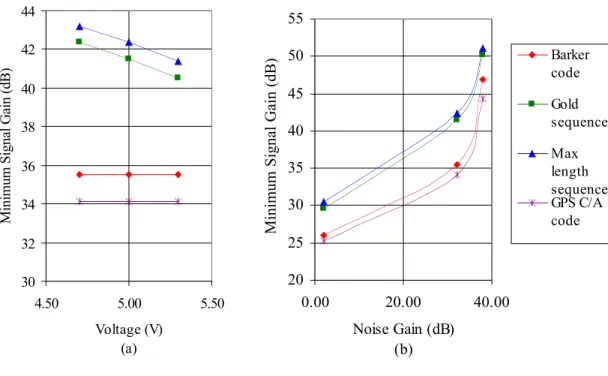
This thesis will also evaluate four different families of pseudorandom codes, unlike the use of only one in the previous work. Each of these pseudorandom code families, the Barker code, gold sequence, maximal length sequence, and GPS C/A code, will be tested and evaluated for both the single and multiple device data bus systems. In particular, they will be assessed on the performance metric of required minimum signal gain for different levels of voltage and noise gains. This assessment will be used to determine which pseudorandom code used gives the most accurate communication in presence of uncertainties. Chapter 3 will discuss the rankings of these pseudorandom codes and discuss their relationship with the predicted theoretical rankings.
Chapter 4 will demonstrate the ability of the multiple device data bus system to contain a single fault. The advanced data bus will use two rounds of voting, based on an extension to a solution of the Byzantine general’s problem, as well as a dual bus system in order to be a single-fault-tolerant data bus system.
In the ultimate chapter, Chapter 5, a summary of the results will be given. Finally, extensions to this thesis and further considerations will be assessed.
Chapter 2
Experimental Setups
This chapter will discuss the experimental setups for both the single device data bus system and the multiple device data bus system. The different features of the particular modules being used, all manufactured by ComBlock©, will be examined. Some features of interest include the input data stream, the pseudorandom codes, the noise injection, and the supply voltage variations. Later these advanced data bus setups will be used to transmit and receive data messages reliably using CDMA.
2.1 Single Device Data Bus System Setup
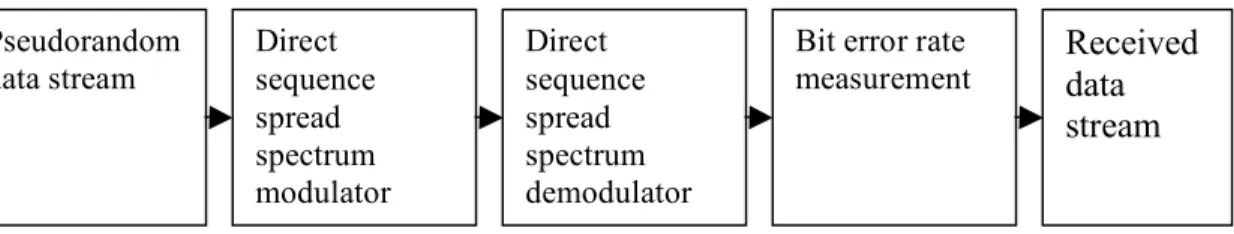
The data bus architecture for the single device data bus system consists of a direct sequence spread spectrum modulator, direct sequence spread spectrum demodulator, and bit error rate measurement module, as shown in Figure 2-1.
2.2 Multiple Device Data Bus System Setup
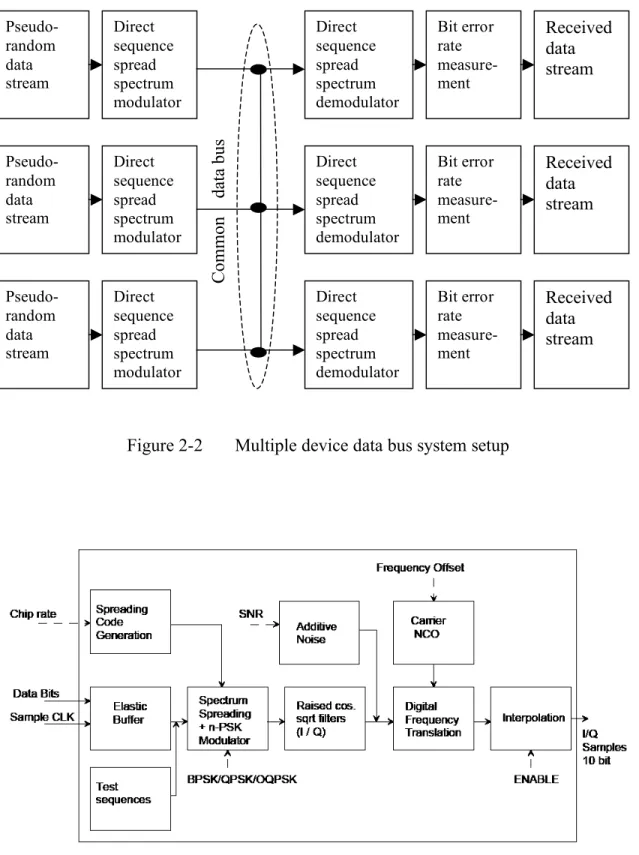
The main difference between the single and multiple device data bus systems is that the multiple device data bus system has three devices, each a replica of the single device data bus. Furthermore, in the multiple device system, the output of each direct sequence spread spectrum modulator is tied to the inputs of all of the direct sequence spread spectrum demodulators, as shown in Figure 2-2. If this setup allows the proper transmission and reception of messages, it will demonstrate that CDMA, through its use of pseudorandom codes, can work reliably for more than two devices on a wired bus system.
2.3 Direct Sequence Spread Spectrum Modulator
The COM-1019, the direct sequence spread spectrum modulator, is used to modulate the input signal. Figure 2-3, the block diagram of the modulator, shows that the modulator
Direct sequence spread spectrum modulator Direct sequence spread spectrum demodulator
Bit error rate measurement Pseudorandom
data stream Received data
stream
Direct sequence spread spectrum modulator Direct sequence spread spectrum demodulator Bit error rate measure-ment Pseudo-random data stream Received data stream
Figure 2-2 Multiple device data bus system setup
Direct sequence spread spectrum modulator Direct sequence spread spectrum demodulator Bit error rate measure-ment Pseudo-random data stream Received data stream Direct sequence spread spectrum modulator Direct sequence spread spectrum demodulator Bit error rate measure-ment Pseudo-random data stream Received data stream C om m on da ta bu s
modulates data bits or test sequences by spreading them with a pseudorandom code. After this modulation, the modulator has the capability to add additive noise to the system.
For the single and multiple device data bus systems, the input stream being used is the test sequence, which is a pseudorandom data stream. This sequence is used to test the reliability of the data bus using CDMA by allowing measurement of the end-to-end bit error rate of the system. This bit stream is a maximal length sequence that is 2047 bits long. It is generated by a linear feedback shift register (LFSR) with 11 taps, as shown in Figure 2-4. The signal gain of the pseudorandom data stream ranges from 0 to 255. Since a noise gain of 0 cannot be converted into decibels, using a lower bound of 1 and upper bound of 255 gives a range of 3.2 dB to 51.4 dB [5].
As shown earlier in Figure 2-3, the direct sequence spread spectrum modulator Figure 2-4 Generation of pseudorandom bit stream [5]
white Gaussian noise to the signal after it has been modulated. The range of the additive white noise gain is 0 to 255. Once again, setting the lower bound to 1 and upper bound to 255, this range converts to -10.1 dB to 38.1 dB. This range is different than that of the signal gain due to the different conversion gain factors used by the module. When the noise gain is set to its maximum, the standard deviation of the noise samples is 111 [5].
2.4 Pseudorandom Codes
The modulator spreads the input signal through the use of pseudorandom codes. Four different families of pseudorandom codes are used. They are the Barker code, the gold sequence, the maximal length sequence, and the GPS C/A code families.
The first pseudorandom code family used in these data bus systems is the Barker code family. The particular Barker code used has a spreading factor of 13. It can be represented by 0x1F35 in the hexadecimal system [5].
The next pseudorandom sequence that is used is the gold sequence. This sequence is generated by two LFSRs, each of which has 9 taps, as shown in Figure 2-5. These LFSRs generate two generator polynomials, of highest order 9, which uniquely describe the gold sequence. At the start of each code period, which is 511 bits, the LFSRs are initialized to all 1’s. The LFSRs will then generate all of the possible 9-bit combinations, besides the combination of all zeros [5].
The maximal length sequence, the third pseudorandom sequence used, is generated in a manner similar to that of the gold sequence. However, only one LFSR is
1 2 3 4 5 6 7 8 9
+
LFSR 1 Maximal length sequence 1 2 3 4 5 6 7 8 9+
LFSR 1+
1 2 3 4 5 6 7 8 9+
LFSR 2 Gold sequenceproperties of this LFSR are exactly the same as those of the LFSRs used to generate the gold sequence [5].
The GPS C/A code is the final pseudorandom code used and is a modification of the gold sequence. This code is only of length 1023 bits and the LFSRs used to generate the gold sequence are also used to generate this code. The first polynomial generated is the same for all GPS C/A codes and is 1+x3+x10, whereas the second polynomial, given by 1+x2+x3+x6+x8+x9+x10, is modified slightly for each pseudorandom signal number to create a distinct code for each signal. The second polynomial is generated uniquely by summing two specific taps of the LFSR. In this case, a pseudorandom signal number of 9 is used, which means that taps 3 and 10 will be summed [5].
2.5 Other Modules
Another module used in the single/multiple device data bus is the COM-1018, the direct sequence spread spectrum demodulator. The demodulator demodulates the modulated signal that it receives from the modulator by despreading it with the same pseudorandom code used by the modulator. The demodulator will only receive a signal from a particular modulator if they both are using the same pseudorandom code.
In most wireless CDMA systems, there is typically a delay for the synchronization of pseudorandom codes between the modulator and the demodulator. In
delay time since both the modulator and demodulator initialize the linear feedback shift registers used to generate the pseudorandom codes at the same time. In addition, the modules are physically situated right next to each other, further helping to compensate the delay.
The final module used in the advanced data buses is the COM-1005, the bit error rate measurement module. This module can be used to detect whether the modulator and demodulator are synchronized when they are using the same pseudorandom code. If they are synchronized, it means that transmission and reception of data messages can occur properly in the system. The other main purpose of the bit error rate measurement module is to measure the amount of bit errors in the received data stream.
2.6 Voltage Margins
The modulator, demodulator, and bit error rate measurement modules in the setups of the advanced data bus systems all require 5 volts of supply voltage. Varying the supply voltage in this particular setup is analogous to varying the dynamic range of the gain for the transmitters and receivers. Since this supply voltage can be varied, the voltage margins of the system were examined to determine the range of the supply voltages for which the systems can operate.
input signal could no longer be detected. By using this process, the lowest voltage that was tolerated by the system was found to be 4.70 V, which leads to a lower supply voltage margin of 0.3 V. To find the higher supply voltage margin of the system, the voltage would have to be raised to determine how high of a voltage the system can tolerate. However, too high a voltage may have resulted in damage to the parts. Therefore, a higher voltage margin was chosen to be 0.3 V in order to be symmetric to the lower voltage margin.
2.7 Summary
In this chapter, the experimental setups of the single and multiple device data bus systems were discussed. The different modules involved in these setups included the direct sequence spread spectrum modulators, direct sequence spread spectrum demodulators, and the bit error rate measurement modules. The various features of these modules were examined, such as the pseudorandom data stream and codes, white Gaussian noise, and the supply voltage required. These data bus experimental setups will be used to send, receive, and evaluate data messages using the different pseudorandom codes.
Chapter 3
Pseudorandom Code Evaluation
The goal of this chapter is to assess which pseudorandom code works best with respect to a performance metric, minimum signal gain, and its sensitivities to other parameters. This is ultimately an assessment of the robustness of the advanced data bus communications system. The metric performance will be used to rank each pseudorandom code in its ability to transmit and receive data messages accurately. These rankings will then be compared to theoretical predications to ensure consistency.
3.1 Performance Metric and Other Parameters
The pseudorandom codes will be evaluated on their performance with respect to the metric of minimum signal gain. The lowest possible minimum signal gain is desired, as this means messages can be transmitted and received without any errors, even if the signal gain is quite low. In addition, the lower this gain, the more the overall system
There is a minimum signal gain necessary to achieve synchronization of the pseudorandom codes in the modulator and demodulator, which is required for the data message to be transmitted and received. After the pseudorandom codes are synchronized, the signal gain must often be increased for the data message to be received with no bit errors. The ranking of the pseudorandom codes will be based on which code requires the lowest minimum signal gain in order to reliably transmit and receive data messages without any bit errors.
The minimum signal gain required by each of the pseudorandom codes will be tested for its sensitivity to uncertainties. These uncertainties include the parameters of voltage variations and additive white Gaussian noise in the advanced data bus systems. Assessing the effects of voltage variations, or analogously dynamic gain variations, is extremely important to give an idea of the robustness of this particular implementation and for designing receivers for these types of communications systems. The effects of injecting different amounts of white Gaussian noise are also crucial since all systems have inherent background noise. The better the performance of the pseudorandom codes in terms of these uncertainties, the more reliable the systems will be.
The required minimum signal gain will be tested for three different supply voltages. As explained in Chapter 2, these voltages are the nominal voltage and the nominal voltage with the lower and upper voltage margins, 5.00, 4.70, and 5.30 volts, respectively. The sensitivity of the required minimum signal gain will also be assessed with respect to three different levels of white Gaussian noise. These levels have been taken as 2.0, 32.1, and 38.1 dB, which are the minimum, intermediate, and maximum
3.2 Correlation Properties
Theoretical studies on the performance of pseudorandom codes focus on their correlation properties. Of particular importance are the autocorrelation and cross-correlation properties. Autocorrelation is the measure of the signal’s ability to distinguish itself from a time-shifted version of itself [6]. Autocorrelation is very important for the single device data bus system or one active device on the multiple device data bus system. One active device means that only one pair of modulator and demodulator is using the same pseudorandom codes that are synchronized in order to send and receive data messages. Cross-correlation is the measure of the signal’s ability to distinguish itself from other signals in the set [6]. This property is significant for two or more active devices on the multiple device data bus system.
When the autocorrelation or cross-correlation is a positive value, it means that the signal is difficult or impossible to distinguish from either the time-shifted version of the original signal or a different signal in the set, respectively. Negative values of correlation correspond to when the signal is distinguishable from the original or other signals. Finally, correlations of zero mean that the signal is geometrically orthogonal to a time-shifted version of itself or to other signals [6].
differentiated optimally. This property is extremely important because the receiver needs to be able to distinguish the pseudorandom code of the correct transmitter to synchronize with in order to receive the right data message. If not orthogonal, it is desirable for the pseudorandom codes to have a correlation value of -1, which means it can be discerned from other signals. However, a positive correlation is not desired since the signal would not be able to be identified [6].
3.3 Theoretical Predictions
While many studies have been done on the correlation properties of the different families of pseudorandom codes, not many have been done comparing the properties between the families. The most extensive comparison has been done about the maximal length and gold sequences. Out of the two, the maximal length sequence has the better autocorrelation function, due to its lower sidelobes, which are flat at a level of -1. Low autocorrelation sidelobes are important, because often part of the signal can be masked if the sidelobes are too high. Due to its ideal autocorrelation properties, the maximal length sequence is predicted to have superior bit error rate performance than the gold sequence for a single active device [7].
For more than one active device, the cross-correlation properties are equally, if not more, important than the autocorrelation properties. Maximal length sequences have much poorer cross-correlation properties than the gold sequences [6]. The gold sequences have cross-correlation functions with much higher occurrence frequencies of -1 than the maximal length sequence. The pseudorandom code with the higher probability of a -1 cross-correlation is better because negative correlations mean the pseudorandom sequence can be easily differentiated from other sequences, which is necessary for the receiver to reliably receive the correct data message. Therefore, it can be predicted that the maximal length sequence will be better than the gold sequence for one active device due to its better autocorrelation properties, but that it will be worse for two or more active devices due to its inferior cross-correlation properties [7].
Very few studies have been carried out that compare the other pseudorandom code families to each other. One comparison of the gold sequence and the GPS C/A code, a modified gold sequence of length 1023, demonstrated that they had cross-correlation values of -1 for 33 and 50 percent of the time, respectively [8]. From these percentages, the GPS C/A code is predicted to have better performance than the gold sequence for any number of active devices on an advanced data bus system.
codes were found to have more optimal correlation functions than the gold sequences [9]. Thus, Barker codes should theoretically have better performance than gold sequences for one or more active devices.
From these theoretical studies, it can be predicted that the maximal length sequence should be better than the gold sequence for one active device, but will be worse for two or more active devices. Furthermore, the GPS C/A and Barker codes are predicted to perform better than the gold sequence for any number of active devices.
3.4 One Active Device on Single and Multiple Device Buses
The minimum signal gain metric was evaluated in regards to its sensitivity to the two parameters for the four different pseudorandom codes. The minimum signal gain evaluated for any number of active devices is the gain necessary to transmit and receive data messages reliably without any bit errors. This gain was first assessed for the only device on the single device data bus system and then for one active device on the multiple device data bus system. Both evaluations yielded the same results for the minimum signal gain, as shown in Figure 3-1. However, one active device on the multiple device data bus system should have required a higher minimum signal gain than the one on the single device data bus system because of the extra background noise created by the larger number of devices on the multiple device data bus system. This discrepancy is actually caused by a limitation of the parts being used in the setups.
30 32 34 36 38 40 42 44 4.50 5.00 5.50 Voltage (V) (a) M in im um S ig na l G ai n (d B ) 20 25 30 35 40 45 50 55 0.00 10.00 20.00 30.00 40.00 Noise Gain (dB) (b) M in im um S ig na l G ai n (d B ) Barker code Gold sequence Max length sequence GPS C/A code
From Figure 3-1(a), the minimum signal gain is evaluated for its sensitivity with regards to voltage for one active device. Since the trends for voltage sensitivity are the same for any level of noise for any number of active devices, all of the figures regarding voltage sensitivity are shown for the medium noise level of 32.1 dB. It can be seen from Figure 3-1(a) that the level of gain necessary is similar for the Barker and GPS C/A codes. The necessary signal gain is also similar for the gold and maximal length sequences. Furthermore, both the Barker and GPS C/A codes are voltage invariant, while the gold and maximal length sequences both have the same trend of voltage dependence, Figure 3-1 Required minimum signal gain vs. (a) voltage and (b) noise gain for
Figure 3-1(b) demonstrates the dependence of the minimum signal gain on noise gain. For any voltage level for any number of active devices, the trends for noise gain sensitivity are identical. Thus, all of the figures show the noise sensitivity for the nominal voltage level of 5.00 volts. The assessment shown in Figure 3-1(b) once again shows that the minimum signal gain is similar for the Barker and GPS C/A codes. Likewise, the gain is again similar for the gold and maximal length sequences. All of the pseudorandom codes follow the same trend, which is an exponential dependence on noise gain. This trend makes sense since as more and more white Gaussian noise is added to the system, a significant increase in the required minimum signal gain would be needed in order for the signals to be distinguished amongst the increased noise.
From the assessment done on the minimum signal gain based on both voltage and noise sensitivities, it can be concluded that the best pseudorandom code is the GPS C/A code, followed by the Barker code, maximal length sequence, and the gold sequence. These results are consistent with the theoretical data on one active device since all of the other codes are better than the gold sequence as expected.
3.5 Two Active Devices on Multiple Device Bus
The voltage and noise level dependences of the minimum signal gain for two active devices on the multiple data bus system are displayed in Figure 3-2. Both dependences for two active devices had the same trend as for one active device, namely that the required minimum signal gain is similar for the Barker and GPS C/A codes. Furthermore,
30 32 34 36 38 40 42 44 4.50 5.00 5.50 Voltage (V) (a) M in im um S ig na l G ai n (d B ) 20 25 30 35 40 45 50 55 0.00 10.00 20.00 30.00 40.00 Noise Gain (dB) (b) M in im um S ig na l G ai n (d B ) Barkercode Gold sequence Max length sequence GPS C/A code
There are two main differences between the gain required for one and two active devices. The first difference is that the minimum signal gain necessary for two active devices is greater than that necessary for one active device. This increase is expected since each device on the multiple device data bus system perceives the extra signal gains from the other devices as extra background noise, meaning that the minimum signal gain needs to increase as the number of active devices on the bus increases.
The second main difference is that the gold sequence requires less minimum signal gain than the maximal length sequence to transmit and receive data messages reliably. Therefore, the rankings for the best pseudorandom codes have changed to the Figure 3-2 Required minimum signal gain vs. (a) voltage and (b) noise gain for
sequence has better cross-correlation properties than the maximal length sequence, so it should perform better for more than one active device on the multiple bus system. Furthermore, the GPS C/A and Barker codes still perform better than the gold sequence, as expected.
3.6 Three Active Devices on Multiple Device Bus
Figure 3-3 demonstrates the relationship between required minimum signal gain and different levels of voltage and noise for three active devices on the multiple device data bus system. All of the trends for the three active devices were the same as those for two
30 32 34 36 38 40 42 44 4.50 5.00 5.50 Voltage (V) (a) M in im um S ig na l G ai n (d B ) 20 25 30 35 40 45 50 55 0.00 20.00 40.00 Noise Gain (dB) (b) M in im um S ig na l G ai n (d B ) Barker code Gold sequence Max length sequence GPS C/A code
active devices. The trend of requiring more signal gain for more active devices on the multiple bus held true, as three active devices required more gain than two active devices for all pseudorandom codes. For three active devices, the ranking of the pseudorandom codes remained GPS C/A code, Barker code, gold sequence, and maximal length sequence, just as for two active devices.
3.7 Pseudorandom Code Family Analysis
The ultimate application of all of these pseudorandom codes is on a wired CDMA advanced data bus system using numerous devices. Therefore, it is important to look at the required minimum signal gain as more devices are added on to the bus for each of the pseudorandom code families.
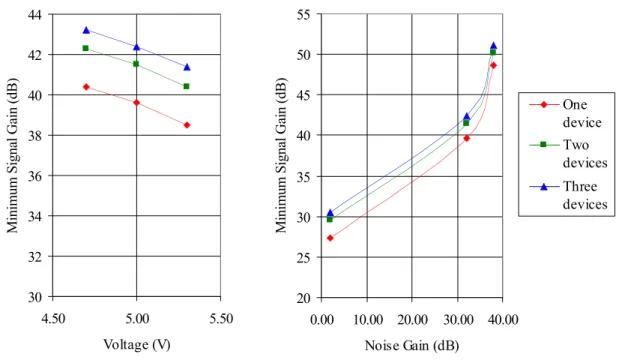
The Barker and GPS C/A codes are very similar in the minimum signal gain they require for any number of active devices, although the GPS C/A code consistently requires less minimum signal gain than the Barker code. As shown in Figures 3-4(a) and 3-5(a), both codes remain voltage invariant for one, two, and three active devices, which is desired for applications that are prone to voltage dependencies. Figures 4(b) and 3-5(b) demonstrate the required minimum signal gain for different amounts of noise gain for up to three active devices. For both families of pseudorandom codes, the minimum signal gain increased by the same amount, 1.0 dB, for each added active device on the multiple device data bus system.
30 32 34 36 38 40 42 44 4.50 5.00 5.50 Voltage (V) (a) M in im um S ig na l G ai n (d B ) 20 25 30 35 40 45 50 55 0.00 10.00 20.00 30.00 40.00 Noise Gain (dB) (b) M in im um S ig na l G ai n (d B ) One device Two devices Three devices 30 32 34 36 38 40 42 44 4.50 5.00 5.50 Voltage (V) (a) M in im um S ig na l G ai n (d B ) 20 25 30 35 40 45 50 55 0.00 10.00 20.00 30.00 40.00 Noise Gain (dB) (b) M in im um S ig na l G ai n (d B ) One device Two devices Three devices
Figure 3-4 Required minimum signal gain vs. (a) voltage and (b) noise gain for Barker code family
The gold and maximal length sequences have the same voltage dependences for one, two, and three active devices, namely that the minimum signal gain necessary decreases as the voltage level increases, as shown in Figures 3-6(a) and 3-7(a). For the noise gain sensitivity, the required minimum signal gain follows the same trend for the gold sequence, examined in Figure 3-6(b), as for the Barker and GPS C/A codes. While this trend means that the minimum signal gain increases by the same amount for each additional device on the multiple device data bus system, the amount of extra gain needed for the gold sequence is only 0.6 dB for the gold sequence in comparison to the 1.0 dB needed by the other codes.
30 32 34 36 38 40 42 44 4.50 5.00 5.50 Voltage (V) M in im um S ig na l G ai n (d B ) 20 25 30 35 40 45 50 55 0.00 10.00 20.00 30.00 40.00 Noise Gain (dB) M in im um S ig na l G ai n (d B ) One device Two devices Three devices
Figure 3-6 Required minimum signal gain vs. (a) voltage and (b) noise gain for gold sequence code family
In terms of noise sensitivity, the maximal length sequence is the only pseudorandom code that requires a significantly different amount of minimum signal gain for each active device added to the multiple device data bus, as shown in Figure 3-7(b). For the second additional active device on the bus, the extra minimum signal gain necessary is 1.9 dB. However, for the third additional active device, the extra required gain is 0.9 dB. This difference is not unexpected, since the theory predicts that the cross-correlation properties for the maximal length sequence are very poor for two or more devices, while the autocorrelation properties for one device are very good.
30 32 34 36 38 40 42 44 4.50 5.00 5.50 Voltage (V) M in im um S ig na l G ai n (d B ) 20 25 30 35 40 45 50 55 0.00 10.00 20.00 30.00 40.00 Noise Gain (dB) M in im um S ig na l G ai n (d B ) One device Two devices Three devices
Figure 3-7 Required minimum signal gain vs. (a) voltage and (b) noise gain for maximal length sequence family
3.8 Conclusions
All of the data collected demonstrates that the approach of a wired CDMA advanced data bus system with more than two devices is feasible and possible. Furthermore, this system shows which pseudorandom codes work best in terms of the required minimum signal gain metric under conditions of uncertainty, such as variable voltage and noise levels.
For up to three active devices, it can be concluded that the best pseudorandom code in regards to voltage invariance and the lowest minimum signal gain needed for different noise levels is the GPS C/A code, followed by the Barker code, gold sequence, and the maximal length sequence. These results are consistent with the theoretical predictions that the GPS C/A and Barker codes will perform better than the gold sequence, which will be superior to the maximal length sequence. While the experimental data leads to the conclusion that the Barker code is inferior to the GPS C/A code, no studies were found that confirm these results theoretically.
If the required minimum signal gain regarding noise gain levels increases linearly for each additional device on the data bus at the nominal voltage of 5.00 volts, the rankings of the pseudorandom codes will change after a certain number of added devices. This change is due to the fact that the extra gain for each additional device varies for the different pseudorandom codes, except for the Barker and GPS C/A codes, which both need 1.0 dB of extra gain. Therefore, the Barker code is predicted to always have higher minimum signal gain than the GPS C/A code and analogously always remain the inferior of the two.
Barker code for a data bus system with 15 devices. In comparison to the GPS C/A code, the gold sequence will need less gain on a bus with 19 devices.
For each added device to a data bus of two or more devices, the maximal length sequence requires 0.9 dB, which is close to that required by the Barker and GPS C/A codes. The minimum signal gain needed by the maximal length sequence will only be lower than that of the Barker and GPS C/A codes for data buses with 69 and 84 devices, respectively. However, the maximal length sequence will always be inferior to the gold sequence.
To determine which pseudorandom code will have the best performance for a certain application, the dynamic range of gain and number of devices needed for the application must be taken into consideration. For applications that use varying levels of dynamic gain, the best pseudorandom code to use is the GPS C/A code followed by the Barker code. For applications that maintain a constant level of gain, the rankings of the pseudorandom codes are predicted to change as more devices are added to the bus. At higher levels of gain, the gold sequence is predicted to outperform the Barker and GPS C/A codes on data buses with more than 12 and 16 devices respectively. The maximal length sequence would only outperform those codes for buses with over 58 and 73 devices, respectively, and would never outperform the gold sequence.
Chapter 4
Single-Fault-Tolerant Data Bus System
This chapter will demonstrate the successfulness of CDMA used in the multiple device data bus system to contain a single fault, essentially an analysis of the reliability of the system. Intentional faults will be introduced into the system, such as errors in the data stream. In order to have single fault containment, the advanced data bus system will use a voting process that is an extension of that used in the solution to the Byzantine general’s problem. Therefore, this single-fault-tolerant data bus system will show that in a system of three devices, one fault can be effectively contained, while two or more faults lead to a system failure.
4.1 Solutions to Byzantine General’s Problem
The devices in the data bus system will primarily be used to pass messages containing data values to the other devices in the system. Therefore, the architecture will apply an
devices may fail and send bad data or conflicting data values to the other components. The problem concerning this type of failure is conventionally described as the Byzantine general’s problem. In abstract terms, the generals of the Byzantine army communicate only through messengers and vote on whether to attack or retreat. Since there are traitorous generals who send conflicting information to other generals, the voting ensures that the loyal generals are able to agree on a good decision. It has been shown that when only oral messages, messages whose contents are under the complete control of the sender, are sent, more than two-thirds of the generals must be loyal in order for the problem to be solvable [10].
Another solution to this problem exists for which m traitors can be handled by any number of generals, as long as the number of generals is at least m + 2. In this solution, each message sent must be signed by that general, with the assumption that a loyal general’s signature can’t be forged and that the authenticity of any general’s signature can be verified. In this situation, one general sends a signed message to each of the generals, who then sign the message and send it to all of the other generals. Taking a situation with 3 generals, and assuming General 1 is a traitor, the following situation might occur as seen in Figure 4-1, where the signatures of Generals 1, 2, and 3 are 1, 2, and 3, respectively. As further shown in Figure 4-1, Generals 2 and 3 are now aware that General 1 is the traitor since General 1 signed both a “retreat” and “attack” message. Therefore, Generals 2 and 3 will make the default decision, which in this case is to retreat [10].
Analogously, in the data bus architecture system with 3 devices, after one device has sent its own data, it will receive data values from the other 2 devices on the bus. Each device will then find the majority of the values it received. If each device reaches the same majority, it means that at most one of the devices is faulty. However if they do not, it is possible that there is more than a single fault, which would not be tolerable in this system and would lead to a system failure. Therefore, by continuously going through this voting process, the system will be able to handle a single fault and work reliably.
4.2 Single-Fault-Tolerant Data Bus System Setup
In order to enable the voting process to take place, some changes have to be introduced to the multiple device data bus system setup. The setup for the single-fault-tolerant data bus
General 1 General 2 General 3 “attack”:1 “retreat”:1 “retreat”:1:2 “attack”:1:3
spectrum modulators and demodulators. Furthermore, the pseudorandom data stream will no longer be used, since it is not capable of introducing intentional faults into the system. Faults can be introduced by either intentionally altering the data message or by decreasing the minimum signal gain so that the devices transmit or receive data with errors. To control the data being transferred from the computer to each of the devices on the data bus and vice-versa, the IP gateway must be used. The bit error rate measurement modules are also no longer used because the data streams will be voted on by the three devices, making it redundant and less realistic to use these modules.
Received data stream
Figure 4-2 Single-fault-tolerant data bus system setup Received data stream Received data stream Data stream Data stream Data stream Direct sequence spread spectrum modulator Direct sequence spread spectrum demodulator Direct sequence spread spectrum modulator Direct sequence spread spectrum demodulator Direct sequence spread spectrum modulator Direct sequence spread spectrum demodulator IP gate-way IP gate-way
The IP gateway acts as a server and waits for initiation or termination of data transfer from the computer. It supports three bidirectional connections. There are two ports that can be used to transmit and receive two different data streams and one port to monitor and control the data. Different software languages may be used to interact with the IP gateway in order to send and receive data messages to and from the devices on the single-fault-tolerant bus. In this case, C-language Winsock programming has been used. Variations of the code shown in Figure 4-3 were used to transfer data from the computer to the devices and vice-verse and to introduce faults in the system.
4.3 Voting Process
The single-fault-tolerant data bus system has three identical devices, which can be used to send three different data messages or the same data message. A single fault can be contained in the data bus system when all of the devices are sending and receiving the same data message. This containment is possible by having the devices go through two rounds of a majority voting process, based on the solution to the Byzantine general’s problem, to ensure that correct data transmission is being done. The first round of voting is done after the data is sent to and from the modulators, which will demonstrate if there are any errors in these modules. The second round of voting is done after the data is received by the demodulators, which will demonstrate if either the modulator or demodulator has any errors. Each round of this voting process is shown in the block diagram in Figure 4-4.
#include <stdio.h> #include "winsock2.h" void main() {
// Initialize Winsock. WSADATA wsaData;
int iResult = WSAStartup( MAKEWORD(2,2), &wsaData ); if ( iResult != NO_ERROR )
printf("Error at WSAStartup()\n"); // Create a socket.
SOCKET m_socket;
m_socket = socket( AF_INET, SOCK_STREAM, IPPROTO_TCP ); if ( m_socket == INVALID_SOCKET ) {
printf( "Error at socket(): %ld\n", WSAGetLastError() ); WSACleanup(); return; } // Connect to a server. sockaddr_in clientService; clientService.sin_family = AF_INET; // insert destination address below
clientService.sin_addr.s_addr = inet_addr( "140.102.18.64" ); // insert destination port below
clientService.sin_port = htons(1024);
if ( connect( m_socket, (SOCKADDR*) &clientService, sizeof(clientService) ) == SOCKET_ERROR) {
printf( "Failed to connect.\n" ); WSACleanup();
return; }
// Send and receive data. int bytesSent;
int bytesRecv = SOCKET_ERROR;
char sendbuf[32] = "Client: Sending data."; char recvbuf[32] = "";
bytesSent = send( m_socket, sendbuf, strlen(sendbuf), 0 ); printf( "Bytes Sent: %ld\n", bytesSent );
while( bytesRecv == SOCKET_ERROR ) {
bytesRecv = recv( m_socket, recvbuf, 32, 0 );
if ( bytesRecv == 0 || bytesRecv == WSAECONNRESET ) { printf( "Connection Closed.\n");
break; }
if (bytesRecv < 0) return;
printf( "Bytes Recv: %ld\n", bytesRecv ); }
return;
Device 1 Measure data Sign and send value to all other devices Receive signed values from all other devices Find majority of values
Did all devices have same majority value? Device 2 Device 3 Yes No At most 1 device is faulty
Are there less than 3 devices? Yes
System failure! Determine faulty
device
No
Sign and send choice to others Receive signed choices from others Measure data
Sign and send value to all other devices Receive signed values from all other devices Find majority of values
Measure data Sign and send value to all other devices Receive signed values from all other devices Find majority of values Is there a majority choice? No Take out value for faulty device
To find the majority value of all of the devices, the IP gateway must be used extensively. As discussed previously, the gateway only has two ports to send and receive data streams. Thus, the ports are first used to send and receive the data to and from two of the devices. Then they are used for the same purpose with the last device. The data received from each device is gathered in the monitoring center and is then sent to the other two devices. All three devices then send back the data they received from the other two devices and a majority value for the data is taken for each device. The outcomes of the different cases presented by the rest of the block diagram after the first and second rounds of majority voting in Figure 4-4 will be examined, namely the cases of no faults, a single fault, or two or more faults in the data bus system.
4.4 No Fault Data Transmission and Reception
The case where no faults are introduced means that no intentional faults are introduced in the data stream. In addition, the minimum signal gain for each of the devices was set to be equal to or greater than the gain required for no errors in transmission or reception of the data message, as discussed previously in Chapter 3, in order for no faults to be introduced into the data bus system.
In this case, all three devices send and receive the correct identical data streams to and from each other. When each device finds the majority of the data values in both rounds of voting, its own value and the two it receives from the other devices, each device has the same majority value. As shown in the block diagram of Figure 4-4, when
all of the devices have the same majority value, at most one of the devices is faulty, and in this case none of them are, meaning that the system will function properly.
4.5 Single Fault Containment
There are two different scenarios for the single fault containment case. The first is when all three devices still have the same majority value and the second is when one of the devices has a different majority value than the other two devices. The first case can occur when one of the devices either transmits or receives faulty data.
The transmission of faulty data can occur when there is an intentional fault in the data stream or when the minimum signal gain of the device is below the necessary gain needed for no errors in transmission. For instance, if the correct data value is 5, and Device 1 always transmits a faulty data value of 6, then the three values Device 1 has are 6 from itself and 5 from the other two devices. Devices 2 and 3 both have values of 5 from themselves and a value of 5 and 6 from the other 2 devices. Taking the majority for each device in the first round of voting gives the correct value of 5. In order for the system to have at most a single fault, the demodulators all worked properly and had the same majority value for the second round of voting so that the data bus can still function properly.
Another scenario of the first case occurs when all of the modulators work correctly and have the same majority value for the first round of voting. Therefore, the reception of faulty data by one device from any of the other two devices occurs when the
receives a 6 and 5 from the other two devices, even though both of the other devices sent values of 5. In this case, the majority of all three devices is still 5, showing that the data bus can successfully run with the proper data values even with a single fault in the system.
The second case, in which one of the devices has a different majority value than the other two devices, occurs when one of the devices transmits and receives faulty data from either or both of the other devices in one of the rounds of voting. For instance, now Device 1 sends a 6 and receives a 6 and 5, while Devices 2 and 3 send values of 5 and receive values of 6 and 5. Thus, the majority of Device 1, which is 6, is different from that of Devices 2 and 3, which are 5.
Following the block diagram of Figure 4-4, it is seen that the majority values of all the devices is not the same, but there are not less than three devices on the data bus system. The faulty device is then determined by comparing the majority values of all of the devices. In this example, it can be concluded that Device 1 is the faulty device since its majority is different than the other devices. Regardless of which round of voting is taking place, the faulty device is taken out of the data bus system, meaning that any values it sends to the other devices will no longer be considered by the other devices in making their decisions of the majority value. Thus, it is like the data bus system only has two devices left.
The two devices left now send each other their values. In all of the cases tested for the introduction of a single fault in the system, it was always ensured that the remaining two devices on the bus had the same majority value. This result demonstrates that using
continue to function properly. However, if for any reason, the majority values for the two devices left on the bus were different, it would result in a system failure since it would no longer be able to be determined which device is faulty since there are only two data values to compare to each other and no majority can be taken.
The other single fault that could occur in the system is any single point of failure that caused one of the physical buses to fail. This failure was simulated by removing one of the physical buses. Since the single-fault-tolerant data bus system is a dual bus system, it still worked properly with the other physical bus that was still in place, once again demonstrating that it is capable of containing a single fault.
4.6 Two or More Faults Introduced in System
When two or more faults are introduced into this single-fault-tolerant data bus system, the system goes into system failure mode. One of the ways more than a single fault can be introduced into the system is if more than one of the devices transmits or receives faulty data. If this situation arises, the devices will not have the same majority in either of the rounds of voting. Even though there are still no less than three devices on the bus, the faulty device will not be able to be determined as the majority values of all the devices will be different and the correct device will not be able to be determined, resulting in a system failure.
Another way in which more than a single fault can be introduced into the system occurs after there are only two devices left on the data bus, such as when one faulty
remaining devices sends or receives faulty data, it means that the majority values of the two devices will no longer be identical. Since there are only two values to compare, it can no longer be resolved which device is faulty and which is not. Therefore, as shown in the flow chart in Figure 4-4, the majority values for one of the rounds of voting will not be the same and there are less than three devices on the bus, leading to a system failure.
4.7 Summary
The reliability of the single-fault-tolerant data bus system was assessed through the use of CDMA and an extension to the solution of the Byzantine general’s problem. The voting process that consisted of two rounds of voting, one round for the data being transmitted by the modulators and the other for the data being received by the demodulators, demonstrated that a single fault in any of the devices could be contained. Single faults were introduced into the system by either having a data stream with faults or using a lower minimum signal gain than that required for no errors.
If the device had a different majority value for either of the two rounds of voting, it would be taken out of the system. If it did not, it would remain in the system, but in either of the cases, a system failure would occur if an additional fault was introduced into the system. Furthermore, single points of failure that caused one of the physical buses to fail were eliminated since there was a second physical bus that still worked properly. Therefore, this assessment demonstrated that a single fault can be contained in the single-fault-tolerant data bus system with three devices, while more than a single fault led to a
Chapter 5
Concluding Remarks
Highly reliable systems, such as those used for space flight, require fault-tolerant architecture. However, conventional fault-tolerant architecture requires a large amount of cabling as more devices are added to the architecture. This thesis focuses on the usage of CDMA in a fault-tolerant data bus system in order to drastically reduce the amount of cabling needed since additional devices are just added to the existing advanced data bus system.
This thesis delved into two important reliability issues concerning the usage of CDMA in this data bus architecture. The first issue was the evaluation of the best pseudorandom code with respect to the performance metric of minimum signal gain. This gain was tested under different situations of uncertainty, including varying levels of voltage and white Gaussian noise. For the nominal voltage, it was concluded that the GPS C/A code was the best pseudorandom code. However, at higher voltages, the gold sequence is predicted to become the best pseudorandom code if there are more than 16
The second reliability issue was single fault containment for this advanced data bus architecture for the case of three devices. Using two rounds of a voting process based on an extension to the solution of the Byzantine general’s problem, the single-fault-tolerant data bus demonstrated that it is feasible to use CDMA in this fault-single-fault-tolerant setup. The different scenarios outlined in the voting process were all tested and affirmed that it is possible to use CDMA in this architecture with three devices to contain a single fault.
5.1 Future Research
Although this thesis examined many important reliability issues concerning the use of CDMA in a fault-tolerant architecture, there is still room for much further research. One extension to the research is to evaluate the advanced data bus system with a varying number of devices. In this scenario, there would be a method for any number of devices to dynamically connect and disconnect from the data bus. In addition, the effect on the minimum signal gain and the trend it follows for additional devices should be evaluated. Furthermore, if more devices or a dynamic number of devices are on the data bus system, an extension of the voting process that would be able to contain different amounts of faults depending on how many devices are on the bus would need to be used.
Another extension to the single fault containment would be to examine the case when two or more devices both send or receive the same faulty data. In this case, the devices would have the same majorities allowing the faulty data to go undetected. An additional extension would be to rewire a faulty modulator to a different demodulator or
of the system for a faulty module. In this way, the probability of system failures would be lessened.
Using different hardware could also have benefits. One of the limitations of the hardware used was that it simulated one active device on the multiple device data bus system the same way as the single device data bus system, even though there is inherently more background noise on the multiple device bus. Different hardware could also be used to increase the dynamic range of the gain of the modules. For applications that maintain a constant level of dynamic gain, it should be investigated whether the gold sequence performs the best at a higher level of gain after a particular number of devices are added to the data bus system, as predicted. If all of these extensions and further research are done, the reliability of using CDMA in a fault-tolerant advanced data bus system should be improved.
Appendix
Bibliography
[1] Yadav, Rajeev. “CDMA Technology.” 7 Aug. 2006. <www.ee.iitb.ac.in/eesa/ Techno-Journalism/prize-winning%20entries/1st_prize_CDMA_Technology_Rajee v_Yadav. pdf>.
[2] Proakis, John G. and Masoud Salehi. “Spread-Spectrum Communication Systems.” National Instruments. 10 Aug. 2006. <http://zone.ni.com/devzone/conceptd.nsf/web main/1A92E4CD19B1242D86256E1400718281#1>.
[3] Parkinson, Bradford W., et al. Global Positioning System: Theory and Applications. New York: American Institute of Aeronautics and Astronautics, 1996.
[4] Yoshimura, Ryuji, et al. “DS-CDMA Wired Bus with Simple Interconnection Topology for Parallel Processing System LSIs.” IEEE (2000): 2702-2703.
[5] “COM-1019: Direct-sequence Spread-spectrum Modulator, 20 Mchip/s.” ComBlock. 27 Sept. 2006. <http://www.comblock.com/download/com1019.pdf>. [6] Sarwate, Dilip V., and Michael B. Pursley. “Crosscorrelation Properties of
593-[7] Turkmani, A.M.D., and U.S. Goni. “Performance Evaluation of Maximal-length, Gold, and Kasami Codes as Spreading Sequences in CDMA Systems.” IEEE (1993): 970-974.
[8] Ndili, Awele. “GPS Pseudolite Signal Design.”
[9] Yepez, E.P., and P.M. Smith. “Real-Valued DS-CDMA Sequences.” IEEE (2000): 371-374.
[10] Lamport, Leslie, Robert Shostak, and Marshall Pease. “The Byzantine Generals Problem.” ACM Transactions on Programming Languages and Systems 4 (1982): 382-401.

![Figure 2-5 Generation of gold sequence using two LFSRs [5]](https://thumb-eu.123doks.com/thumbv2/123doknet/13878677.446610/26.918.184.748.111.1045/figure-generation-gold-sequence-using-lfsrs.webp)