HAL Id: hal-01082053
https://hal-univ-rennes1.archives-ouvertes.fr/hal-01082053
Submitted on 12 Nov 2014HAL is a multi-disciplinary open access archive for the deposit and dissemination of sci-entific research documents, whether they are pub-lished or not. The documents may come from teaching and research institutions in France or abroad, or from public or private research centers.
L’archive ouverte pluridisciplinaire HAL, est destinée au dépôt et à la diffusion de documents scientifiques de niveau recherche, publiés ou non, émanant des établissements d’enseignement et de recherche français ou étrangers, des laboratoires publics ou privés.
the RMQS BioDiv Programme
Cécile Villenave, Anne Jimenez, Muriel Guernion, Guénola Pérès, Daniel
Cluzeau, Thierry Mateille, Bernard Martiny, Mireille Fargette, Johannes
Tavoillot
To cite this version:
Cécile Villenave, Anne Jimenez, Muriel Guernion, Guénola Pérès, Daniel Cluzeau, et al.. Nematodes for Soil Quality Monitoring: Results from the RMQS BioDiv Programme. Open Journal of Soil Science, Scientific Research Publishing, 2013, 3, pp.30 - 45. �10.4236/ojss.2013.31005�. �hal-01082053�
doi:10.4236/ojss.2013.31005 Published Online March 2013 (http://www.scirp.org/journal/ojss)
Nematodes for Soil Quality Monitoring: Results from the
RMQS BioDiv Programme
Cécile Villenave1, Anne Jimenez1, Muriel Guernion2, Guénola Pérès2, Daniel Cluzeau2, Thierry Mateille3, Bernard Martiny3, Mireille Fargette3, Johannes Tavoillot3
1
ELISOL Environnement and IRD UMR 210 ECO & SOLS, Montpellier, France; 2UMR CNRS 6553 EcoBio, University Rennes 1, Rennes, France; 3IRD UMR 1062 CBGP, Montferrier sur Lez, Monteferrier, France.
Email: cecile.villenave@elisol-environnement.fr, anne.jimenez@elisol-environnement.fr, muriel.guernion@laposte.net, guenola.peres@univ-rennes1.fr, daniel.cluzeau@univ-rennes1.fr, thierry.mateille@ird.fr, bernard.martiny@ird.fr, mireille.fargette@ird.fr, Johannes.Tavoillot@ird.fr
Received December 19th, 2012; revised January 20th, 2013; accepted February 2nd, 2013
ABSTRACT
A French programme, “Réseau de mesure de la qualité des sols: biodiversité des organismes” (RMQS BioDiv) was de-veloped in Brittany (27,000 km² in the western part of France) as an initial assessment of soil biodiversity on a regional scale in relation to land use and pedoclimatic parameters. The nematode community assemblages were compared among the land use categories. Crops were characterised by a high abundance of bacterial-feeders, particularly oppor-tunistic bacterial-feeders belonging to Rhabditidae. Meadows presented a higher total abundance of nematodes than did crops (20.6 ind·g−1 dry soil vs. 13.1 ind·g−1 dry soil), and they were mainly linked to the great abundance of plant-parasitic nematodes, particularly Meloidogyne, but with a very high heterogeneity between sampled plots. The nematodes were most abundant in forests (23.7 ind·g−1 dry soil) and presented the most structured community (SI = 82.2 in forests vs. 58.6 and 55.5 in crops and meadows, respectively). Forests had also the higher fungal component (fungal-feeders and facultative plant-feeders belonging to the Tylenchidae) leading to a significant higher part of the fungal decomposition pathway in forests than in crops. The ability of different taxonomic levels of nematode identifica- tion to discriminate among different cropping systems (i.e., continuous cropping system, crop with meadow in the rota- tion, meadow with crop in the rotation and permanent meadow) was also tested. The family level (48 families identified in these samples) was more efficient than the other taxonomic levels (86 taxa, 17 functional guilds and 6 trophic groups): best statistical significant discrimination for time spent in identification. The relation between the nematode ecological indices, the abundance of nematode trophic groups and the crop management practices were studied. The effects of fertilization, ploughing frequency, use of pesticides and management systems on ecological indices, particu- larly on the Maturity Indices, were observed.
Keywords: Agricultural Practices; Bioindicators; Crop; Forest; Meadow; Soil Biodiversity Monitoring
1. Introduction
The Convention on Biological Diversity (CBD) recog- nized the importance of biodiversity for ecosystem func- tioning and for the provisioning of soil services to hu- mankind ([1]; www.cbd.int). Soil biota is thought to harbour a large portion of the biodiversity of the world, but there is still limited knowledge regarding this domain. The European Union (EU) has underscored that an interest in the biological compartment of soil and that the role of biodiversity in the maintenance of ecological functions (i.e., life support functions) in the soil requires more at- tention. Therefore, the EU has mandated biological re- search on soil management policies, including character- rizing species and the biological functions of some soil organisms [2]. In Europe, indicators related to soil bio-
diversity are still rarely measured [3]; according to the report of the European project ENVASSO [4], only a few countries have monitoring sites for soil fauna, such as Germany, the Netherlands, Ireland, Austria, Latvia, Es- tonia and France [3,5-7]. Several international syntheses have reported on soil biota as bioindicators of human activities [8-12].
To fulfill the need expressed by the European Union to study soil biodiversity (species and function) in relation to pedoclimatic parameters and land use (mainly agri-cultural practices), a French programme, RMQS BioDiv, was developed at a wide regional scale (Brittany) from 2006 to 2009. It studied most soil biological guilds (total macrofauna, earthworms, mites, collembola, nematodes, microorganisms) [13] in locations where physical and
chemical soil properties and agricultural practices have already been monitored [14,15].
The objectives of this study focusing on soil nema- todes were to 1) investigate the relations between nema- todes and land uses, 2) prioritize the different levels of taxonomic determination based on their ability to distin- guish between situations, 3) investigate the relations be- tween nematodes and agricultural management practices, and 4) incorporate nematodes as part of the soil quality descriptors in ecosystem service management for French and European policies.
2. Materials and Methods
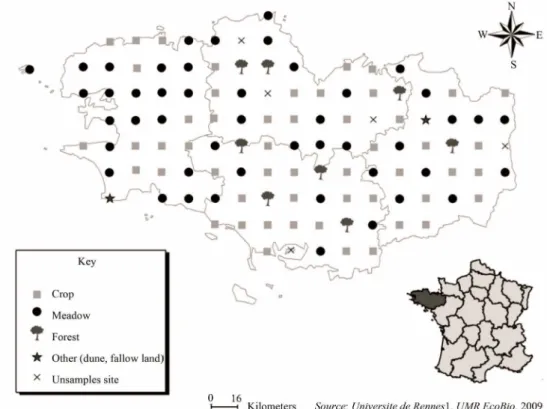
2.1. Sampling Site NetworkThe sampling site network is located in Brittany in the western part of France (Figure 1), between 2˚ to 5˚ W longitude and 47˚ to 49˚ N latitude. The climate is tem- perate oceanic, with the mean annual air temperature ranging from 7.6˚C to 15.9˚C and the mean annual rain- fall ranging from 1400 mm in the west to 700 mm in the eastern part of the region. Cambisol and Luvisol are the major recorded soils. The study site network, comprising 109 monitoring sites, was based on a 16 × 16 km sys- tematic grid covering the entire area (27,000 km²) and was also used by the RMQS, which monitored the physical and chemical soil parameters and agricultural practices [15].
To link the biological data to the agricultural, physical and chemical data, the RMQS BioDiv sampling area was located 5 meters from the RMQS area for each sampling site. Within the network, the primary land uses were meadows and crops (90%) and forests (10%). Because of its variability in geology, climate and land-use, the Brit- tany region offers a large gradient of pedoclimatic land use and management. The biological samples were col-lected in 2006 and 2007 springs. The “baselines” ob-tained for nematological indicators are consequently valid for spring conditions. This study was conducted in real farmer fields and forests; it is not an experiment conducted in experimental station. Then, it is possible that the land use reflect differences in soil type. As a matter of fact, farmers can select different kind of areas of land for cropping, pasture or forestry on the basis of soil characteristics, such as the ability to cultivate the land (stone content, slope) or the organic content (carbon, nitrogen… ) or the physical properties (soil structure, bulk density); however this will not be analysed in this article.
2.2. Nematode Sampling
For each site sampled on the BioDiv grid, a single sam- ple was composited from 32 samples collected from the surface soil layer (0 - 15 cm). In forest soils, it was cho- sen to remove the litter before soil sampling in order to compare forest soil without humus with cultivated soil
even if, doing so, important information on the ecosys- tem functioning in forests was lost. The soil was sieved through 6 mm mesh to remove large stones and plant debris. The soil samples (approximately 3 kg fresh weight) were then homogenised, shipped and stored at 4˚C until being used.
For each fresh sample, the nematodes were extracted from approximately 300 g wet soil by elutriation, fol- lowed by an active pass through a cotton wool filter for 48 hours using the Seinhorst method [16]; they were then counted using a binocular microscope. The composition of the soil nematofauna was determined after fixing in a formaldehyde-glycerol mixture and transferring to mass slides [17]. On average, 200 nematodes per mass slide were identified to the family or genus level at 400 × magnification. For some morphotypes, it was impossible to find adults, allowing only identification to genus or family level using several identification books [18-20].
The nematode taxa were assigned to trophic groups modified from [21]: bacterial-feeders (Ba), fungal feed-ers (Fu), facultative plant-feedfeed-ers (Fpf), obligate plant- feeders (Pf), omnivores (Om) and carnivores (Ca). The nematodes were also allocated to coloniser-persister (cp) classes following [22]. The coloniser-persister scale ranged from 1 to 5 and could vary within a trophic group; thus, bacterial-feeders with a cp class of 1 were placed in the functional guild Ba1, and fungal-feeders with a cp
class of 4 were placed in the functional guild Fu4.
Eight nematode ecological indices were calculated af- ter Bongers [22], Ferris et al. [23] and Yeates [24].
Maturity Index (MI = Σvi pi), where vi is the colo- niser-persister value assigned to taxon i (from cp 1 to cp 5) and pi is the frequency of taxon i; the MI is calculated for all of the free-living nematodes; lower values of this Index indicate disturbed and nutrient enriched environ- ments whereas higher values indicate more stable condi- tions. The BaMI, FuMI and PPI are the same indices calculated for the bacterial-feeding nematodes, fun- gal-feeding nematodes and plant-feeding nematodes, res- pecttively.
Enrichment Index (EI = 100 × [e/(e + b)]), Structure Index (SI = 100 × [s/(b + s)]) and Channel Index (CI = 100(0.8 Fu2)/(3.2 Ba1 + 0.8 Fu2)), where e is the abun-
dance of nematodes in the basal component weighted by their ke values; b is the abundance of nematodes in the basal component weighted by their kb values; s is the abundance of nematodes in the structural component weighted by their ks values; ke is the weighting assigned to the guilds Ba1 and Fu2 (enrichment component); kb is
the weighting assigned to the guilds Ba2 and Fu2 (basal
component); and ks is the weighting assigned to the guilds Ba3-5, Fu3-5, Om4-5 and Pr2-5 (structural compo-
nent).
The EI is meant to assess the food web response to the
availability of resources [23]. The SI indicates whether the soil community is basal (typical for disturbed systems) or structured (typical of more stable systems) [23]. The CI indicates the putative predominant decomposition pathways, i.e., it is meant to quantify the relative impor- tance of the fungal-fed and the bacterial-fed trophic channels of the soil decomposer food web [23].
The Nematode Channel Ratio (NCR) was calculated after [24]: NCR = B/(B + F), where B and F are, respect- tively, the relative contributions of the bacterial- and fungal-feeding nematodes to the total nematode abun- dance.
2.3. Explanatory Variables
The explanatory data were from the RMQS programme and were collected by the Orleans INRA [14]. These data included the physicochemical soil parameters, land use and agricultural practices. Relation between nematologi- cal data and five physico-chemical soil parameters were studied. Total organic carbon (TOC) and total nitrogen (N) contents were measured by dry combustion (NF ISO 10694 and 13878); C ranged from 6.0 to 50.5 with a mean of 25.8 g·kg−1; total N ranged from 0.7 to 4.5 g·kg−1 with a mean of 2.3 g·kg−1. C/N ranged from 8.2 to 22.6 with a mean of 11.0. pHwater ranged from 4.0 to 8.6
with a mean of 5.9. Assimilable P (P2O5 Olsen method NF ISO 11263) ranged from 0.00 to 0.32 with a mean of 0.10 g·kg−1. Other soil physico-chemical characteristics are given in Table 1. To assess the relations between the biological data and the agricultural practices, nine agri- cultural management variables were grouped: land use (crop field, permanent meadow, meadow with crops in rotation, crops with meadow in rotation, or forest), mana- gement system (intensive, integrated, sustainable systems, or organic farming), use of fertilisers (no fertilisers, mi- neral fertilisers, organic fertilisers, or organic + mineral fertilisers), ploughing frequency (high, low), time since last tillage (<5 months, >5 months), and pesticide use (yes, no).
2.4. Statistical Analysis
Spearman correlation tests were made between nema- tological parameters and physico-chemical parameters (quantitative explanatory variables). The global nema- tode parameters (densities of trophic groups and nema- tode ecological indices) were compared among the three land uses sampled in Brittany: crops, meadows and fo- rests. The relations between the nematode parameters and agricultural practices were also tested. The tests used were non-parametric Kruskal-Wallis test (5% signify- cance level) followed by Bonferroni post-hoc multiple comparisons to test for differences between the means.
Table 1. Main physico-chemical characteristics of the 108 sampled locations.
Minimum Mean Standard deviation Maximum Clay (%) 5.9 17.89 5.25 49.7 Silt (%) 14.00 51.2 13.42 73.8 Sand (%) 9.8 30.9 14.91 80.1 C (g·kg−1) 5.97 25.44 10.19 50.5 Total N (g·kg−1) 0.72 2.345 0.8 4.5 C/N 8.2 10.91 1.83 20.68 pHwater 4.00 5.85 0.66 8.2 Polsen (g·kg−1) 0.00 0.11 0.06 0.319 ECC (cmol+·kg−1) 2.5 7.22 2.44 13,00 Exchangeable Ca (cmol+·kg−1) 0.01 5.61 2.6 11.3 Exchangeable Mg (cmol+·kg−1) 0.09 0.81 0.78 7.52 Exchangeable K (cmol+·kg−1) 0.08 0.39 0.24 1.34 Water content (%) 12.16 23.58 5.26 42.39
Mann-Whitney tests were also used when comparing only two modalities of a variable. The analyses were performed using XLStat 2008 (Addinsoft). The multi- variate patterns in the nematode communities were in- vestigated on transformed abundances from 4 datasets at different taxonomic levels: the highest level of identifi-cation (86 taxa), family level (48 families), functional guilds (17) and trophic groups (6). A permutational mul-tivariate ANOVA (PERMANOVA) was performed to determine the statistical significance of the effects of treatments and sampling time on the nematode commu- nity structure. The PERMANOVA tests were based on 9999 restricted permutations of the data. Pairwise com- parisons were performed within treatments and sampling times to test for significant (p < 0.05) nematode commu- nity patterns. Non-metric multi-dimensional scaling (nMDS) was performed on the data from two different datasets (86 taxa, 17 functional guilds) to illustrate the differences in plot separation when using different iden- tification levels [25]. MDS relies on a two-dimensional map in which the degree of similarity among the obser- vations is indicated by the proximity of their representa- tive points (the closer, the more similar). The axes of the map hold no specific value and can be rotated or mir- rored without influencing the relative distances between the observations. PERMANOVA and MDS were per- formed using PRIMER v6 with PERMANOVA+ [26].
3. Results
3.1. Relation between Nematode Parameters and Five Main Physico-Chemical Parameters Positive correlations were measured between total nema-
tode abundance and soil C and N contents (Table 2). Opportunistic bacterial-feeders were correlated to avail-able P. Others bacterial-feeders were correlated with soil C. Fungal-feeders were correlated with soil C, total N and available P. Plant-parasitic nematodes were lated with C and N contents. MI was positively corre-lated Polsen. BaMI was positively correcorre-lated with C/N and pH and negatively correlated with available P. FuMI was positively correlated with C/N, available P and pH. NCR was positively correlated with C, N and available P. EI was positively correlated with N, Polsen and pH. CI was positively correlated with available P. PPI and SI were not correlated with these physico-chemical pa- rameters.
3.2. Regional Average of Nematode Parameters in Crops, Meadows and Forests
Nematodes were more abundant in meadows and forests than in crops (Table 3). The opportunistic bacte- rial-feeding nematodes (Ba1) and the other bacte-
rial-feeders (Ba234) showed different land use distribu-
tions; the Ba1 were significantly more abundant in crops
than in meadows or forests. Land use had no influence on the density of the Ba234. Fungal-feeders (Fu) and facul- tative plant-feeders (RHF) were more numerous in fo- rests than in other land uses. Omnivores (Om) were more abundant in forests than in crops, with intermediate den- sity in meadows. Carnivores (Ca) were more abundant in crops than in meadows. The highest abundances of plant parasitic nematodes (Pf) were found in meadows. These differences in nematode trophic group densities observed among the land uses resulted in completely different community structures (Figure 2). Microbivorous (Ba and
Table 2. Relations between the abundances of the nematode trophic groups and the nematode ecological indices and the five physico-chemical soil parameters using Spearman correlations and significant difference among means for the Brittany re-gion. Values indicated in the table are the p-value of the significant correlations.
Nematode trophic groups Carbon Total Nitrogen C/N Polsen pHwater
(ind·g−1 dry soil) (g·kg−1) (g·kg−1) (g·kg−1)
Opportunistic bacterial-feeders Ba1 ns ns ns <0.0001 ns Others bacterial-feeders Ba234 0.046 ns ns ns ns Fungal-feeders Fu 0.031 0.011 ns 0.006 ns Omnivores Om ns ns ns ns ns Carnivores Ca ns ns ns ns ns Plant-parasitic nematodes Pf 0.003 0.0001 ns ns ns Facultative plant feeders RHF ns ns ns ns ns
Total 0.006 0.005 ns ns ns
Nematode ecological indices
Maturity Index MI ns ns ns 0.0005 ns Maturity Index on bacterial-feeders BaMI ns ns 0.011 0.0001(-)1 0.0002
Maturity Index on fungal-feeders FuMI ns ns 0.018 0.001 0.021 Nematode Channel Ratio NCR 0.015 0.002 ns <0.0001 ns
Plant Parasitic Index PPI ns ns ns ns ns Enrichment Index EI ns 0.011 ns 0.0005 0.009
Structure Index SI ns ns ns ns ns Channel Index CI ns ns ns <0.0001 ns
1(-) indicate a negative correlation.
Figure 2. The relative abundances of the nematode trophic groups in crops, meadows and forests. The pie-charts are proportional to the nematode densities: (a) Crops; (b) Meadows; (c) Forests.
Fu) nematodes dominated in crops, whereas strict and facultative fungal-feeders (Fu and RHF) prevailed in forests. Plant-feeders (Pf) were the most abundant tro-phic group in meadows.
The nematode ecological indices also differed signify- cantly among the three land uses (Table 4). The MI, FuMI, SI and CI were significantly higher in forests than
in crops or meadows. The BaMI increased from crops to meadows and from meadow to forests. The EI and NCR were significantly higher in crops than in forests. More- over, the EI was higher in crops than in meadows, whereas the NCR did not differ significantly between those two land-uses. Finally, the PPI increased from fo- rests to crops and from crops to meadows.
3.3. Regional Average of Nematode Taxa Composition in Crops, Meadows and Forests The densities of the dominant taxa found in the 109 sam-ples from Brittany are presented in Table 4. Among bac-terial-feeding nematodes (Ba), Alaimus (cp 4), Wil-sonema (cp 2), Prismatolaimus (cp 3) and Metaterato-cephalus (cp 3) were mostly found in forests. In contrast, Eucephalobus (cp 2) were more abundant in cropped areas. The densities of Rhabditidae (cp 1), and Panagro-laimidae (cp 1), were 10 times higher in crops than in forests. Tylolaimorphorus (cp 4) and Tylencholaimus (cp 4) were more abundant in forests than in cultivated areas.
Among plant-feeders (Pf and RHF), the main differ-ence between the crops and meadows concerned the high abundance of the genus Meloidogyne (cp 3) in meadows. The high variability of its density in meadows (CV = 149%) clearly indicates heterogeneous population levels among plots. However, M. naasi occurred abundantly in
Table 3. Means (M), standard deviation (SD), minimum (min) and maximum (max) values of the abundance (ind 100 g−1 dry soil) of the nematode trophic groups and the nematode ecological indices recorded by the RMQS Biodiv programme (n = 109) for the three main land uses: crops (n = 52), meadows (n = 47) and forests (n = 8).
Crops Meadows Forests min - max M ± SD min - max M ± SD min - max M ± SD
Nematodes trophic groups Opportunistic bacterial-feeders Ba1 32 - 1511 326.1 ± 270.2 c* 9 - 994 224.3 ± 204.1 b 0 - 123 50.3 ± 52.8 a*** Others bacterial-feeders Ba234 46 - 1399 291.5 ± 211.2 a 93 - 1175 360.5 ± 261.3 a 40 - 668 381 ± 203.6 ans Fungal-feeders Fu 6 - 262 84.5 ± 61.6 a 0 - 570 88.5 ± 91.7 a 34 - 609 305.2 ± 202.9 b** Omnivores Om 0 - 313 45.9 ± 58.6 a 0 - 522 96 ± 112.7 ab 1 - 342 169.4 ± 106 b** Carnivores Ca 3 - 207 53.7 ± 45.8 b 0 - 178 35 ± 40.4 a 0 - 198 60 ± 71.5 ab* Plant-parasitic nematodes Pf 20 - 983 254.6 ± 214.4 a 0 - 3922 999.1 ± 1046.7 b 12 - 3018 497.3 ± 979.7 a *** Facultative plant-feeders RHF 11 - 817 255.7 ± 195.4 a 0 - 1211 257.7 ± 305.3 a 78 - 1698 907.1 ± 559.8 b ** Total 384 - 3548 1312 ± 589.7 a 370 - 5271 2061.1 ± 1289.4 b 173 - 5794 2370.3 ± 1551.3 b* Nematode ecological indices Maturity Index MI 1.4 - 3 1.98 ± 0.33 a 1.4 - 3 2.18 ± 0.44 a 2.3 - 3.4 2.99 ± 0.38 b*** Maturity Index on bacterial-feeders BaMI 1.2 - 2.1 1.56 ± 0.22 a 1.2 - 2.1 1.69 ± 0.22 b 1.9 - 2.5 2.36 ± 0.18 c*** Maturity Index on fungal-feeders FuMI 2 - 2.8 2.08 ± 0.16 a 2 - 3.7 2.17 ± 0.34 a 2.5 - 3.6 2.97 ± 0.34 b*** Nematode Channel Ratio NCR 56 - 99 86.9 ± 8.5 b 66 - 100 86.3 ± 8.2 b 43 - 88 59.1 ± 14.9 a ***
Plant parasitic Index PPI 2.1 - 3 2.48 ± 0.23 b 2 - 3 2.65 ± 0.26 c 2 - 2.4 2.1 ± 0.13 a***
Enrichment Index EI 46 - 96 76.4 ± 11.5 b 13 - 95 64.4 ± 18.6 a 6 - 72 40.9 ± 23.8 a***
Structure Index SI 16 - 91 58.6 ± 17.5 a 0 - 91 55.5 ± 22.9 a 49 - 94 82.2 ± 14.7 b**
Channel Index CI 1 - 24 7.4 ± 5.7 a 0 - 69 11.1 ± 11.5 a 11 - 100 51.7 ± 33.6 b*** *
Varying letters (a, b, c) indicate significant differences between means (Kruskal-Wallis test followed by Bonferoni correction, *p < 0.05; **p < 0.01; ***p < 0.01).
several meadow samples. Paratylenchus species (cp 2) were found in some forest plots in extremely high densi-ties (maximum 24 ind·g−1 dry soil). Meadows and forests contained more Hoplolaimidae than did crops. Among omnivorous nematodes (Om), Belondiridae (cp 5) and Qudsianematidae (cp 4) were mainly found in forests whereas Thornematidae (cp 5) and Nordiidae (cp 4) were more common in meadows. The carnivorous (Ca) genus Clarkus (cp 4) was mostly found in cropped areas. 3.4. Discrimination of the Cropping Modalities
by the Taxonomic Rank
Four taxonomic levels of identification (genus, family,
functional guilds, trophic groups) were used with PER- MANOVA analysis to discriminate among five modali- ties of land-use (Table 5): meadows with crops in rota- tion (Mc), permanent meadows (M), crops with meadows in rotation (Cm), continuous crops (C), and forests (F). None of the four taxonomic levels distinguished between the Mc and M modalities, or the C and Cm modalities (except the functional-guild level for C/Cm, with a low significance, p = 0.054). Both functional-guild and tro- phic-group levels did not distinguish between the Mc and Cm modalities. Otherwise, all of the taxonomic levels concerned were able to distinguish between the other land-use modalities. Two MDS analyses were performed,
Table 4. Means (M), standard deviation (SD), minimum (min) and maximum (max) values of the abundance (ind 100 g−1 dry soil) of the nematode taxa recorded by the RMQS Biodiv programme (n=109) for the three main land uses: crops (n = 52), meadows (n = 47) and forest (n = 8).
Genera Crops Meadows Forests Superfamilies/
families/subfamilies min - max M ± SD min - max M ± SD min - max M ± SD Plant and root hair feeders
Belonolaiminae Morulaimus 0 - 0 0 ± 0 0 - 0 0 ± 0 0 - 18 2.3 ± 6 Criconematidae Criconema + Hemicriconemoides 0 - 0 0 ± 0 0 - 0 0 ± 0 0 - 62 7.7 ± 20.4 Heteroderidae Heterodera 0 - 66 2.7 ± 12.8 0 - 697 49.3 ± 130.7 0 - 0 0 ± 0 Hoplolaimidae Helicotylenchus 0 - 93 3.4 ± 13.2 0 - 2116 98.6 ± 323.9 0 - 539 92.2 ± 181 Hoplolaimidae Rotylenchus 0 - 267 12 ± 39.6 0 - 43 1.8 ± 6.6 0 - 411 52.1 ± 135.7 Longidoridae Longidorus 0 - 235 11.1 ± 40 0 - 214 13.7 ± 43.7 0 - 27 3.4 ± 8.9 Longidoridae Xiphinema 0 - 0 0 ± 0 0 - 286 6.3 ± 40.5 0 - 0 0 ± 0 Meloidogynae Meloidogyne 0 - 415 33.1 ± 75.4 0 - 3559 599.5 ± 893.2 0 - 0 0 ± 0 Paratylenchidae Paratylenchus + Gracilacus 0 - 271 24.7 ± 55.3 0 - 665 88.6 ± 146.5 0 - 2425 329.9 ± 792.8
Pratylenchidae Pratylenchus 0 - 933 92.4 ± 154.8 0 - 890 70.3 ± 134.6 0 - 27 5 ± 9.4 Telotylenchidae Tylenchorhynchus + Amplimerlinius* 0 - 579 56.5 ± 95.5 0 - 557 69.8 ± 115.5 0 - 37 4.7 ± 12.4
Trichodoridae Paratrichodorus 0 - 25 0.7 ± 3.7 0 - 0 0 ± 0 0 - 0 0 ± 0 Tylenchidae Boleodorus + Coslenchus + Filenchus + unidentified genera 11 - 817 255.7 ± 195.4 0 - 1211 257.7 ± 305.3 78 - 1698 907.1 ± 559.8 Omnivores Belondiridae Dorylaimellus + other genera 0 - 0 0 ± 0 0 - 81 3.3 ± 12.9 0 - 119 24.7 ± 40.1 Dorylaimoidea unidentified genera 0 - 21 2.4 ± 5.3 0 - 47 5.6 ± 9.8 0 - 27 5.3 ± 9.6
Nordiidae Pugentus 0 - 67 4.8 ± 10.8 0 - 186 22.5 ± 36.2 0 - 135 16.8 ± 44.6 Nordiidae unidentified genera 0 - 0 0 ± 0 0 - 36 1.4 ± 6 0 - 27 3.3 ± 8.8 Qudsianematidae Eucumenicus 0 - 83 6.2 ± 17.9 0 - 110 6.5 ± 20.1 0 - 18 4.2 ± 7.2 Qudsianematidae Eudorylaimus 0 - 86 5.4 ± 13.5 0 - 55 5.9 ± 13 0 - 294 51.7 ± 96.3 Qudsianematidae unidentified genera 0 - 249 11.8 ± 34.7 0 - 71 6.3 ± 12.1 0 - 225 56.5 ± 77.1 Thornenematidae Mesodorylaimus 0 - 101 6.1 ± 6.2 0 - 241 24.8 ± 48.6 0 - 13 1.7 ± 4.4 Thornenematidae Prodorylaimus 0 - 108 7.7 ± 17.4 0 - 296 17 ± 47.1 0 - 27 5.3 ± 9.6 Thornenematidae unidentified genera 0 - 30 1.4 ± 4.9 0 - 36 2.5 ± 7.3 0 - 0 0 ± 0
Carnivores
Anatonchidae Michonchus 0 - 10 0.5 ± 1.9 0 - 28 0.7 ± 4.1 0 - 27 3.4 ± 8.9 Aphelenchoididae Seinura 0 - 50 2.2 ± 7.7 0 - 36 1.4 ± 5.5 0 - 27 3.4 ± 8.9 Aporcelaimidae Aporcelaimus + other genera 0 - 83 17.8 ± 20 0 - 107 14.1 ± 19.7 0 - 54 12.8 ± 20.1
Discolaimidae Discolaimus 0 - 0 0 ± 0 0 - 26 1.1 ± 4.7 0 - 0 0 ± 0 Mononchidae Clarkus 0 - 124 18 ± 25.1 0 - 40 4 ± 9 0 - 1 0.2 ± 0.4 Mononchidae Coomansus 0 - 9 0.2 ± 1.3 0 - 43 0.9 ± 6.1 0 - 0 0 ± 0
Continued Mononchidae Mononchus 0 - 27 2.2 ± 6.1 0 - 66 3.2 ± 10.3 0 - 27 3.3 ± Mononchidae Mylonchulus 0 - 10 1 ± 2.7 0 - 14 0.5 ± 2.4 0 - 27 3.4 ± 8.9 Mononchidae Prionchulus 0 - 45 1.4 ± 6.6 0 - 14 0.5 ± 2.3 0 - 13 2.4 ± 4.5 Nygolaimidae Paravulvus 0 - 86 8.6 ± 17.7 0 - 77 5.9 ± 16.8 0 - 183 30.8 ± 59.1 Tripylidae Tripyla 0 - 16 1 ± 3.5 0 - 57 3.1 ± 9.9 0 - 15 3.7 ± 6.1 Bacterial-feeders Achromodoridae Achromodora 0 - 33 1.1 ± 5 0 - 14 0.7 ± 2.9 0 - 0 0 ± 0 Alaimidae Alaimus 0 - 100 15.9 ± 21.9 0 - 98 9.6 ± 21 0 - 135 61 ± 37.9 Alaimidae Amphidelus 0 - 19 0.7 ± 2.9 0 - 29 0.6 ± 4 0 - 0 0 ± 0 Bastianiidae Bastiania 0 - 18 0.4 ± 2.5 0 - 13 0.3 ± 1.9 0 - 13 1.7 ± 4.4 Cephalobidae Acrobeles 0 - 271 5.3 ± 37.5 0 - 0 0 ± 0 0 - 18 2.3 ± 6 Cephalobidae Acrobeloides 0 - 400 35.7 ± 66.9 m - 126 30.1 ± 29.1 18 - 189 67.3 ± 60.3 Cephalobidae Acrobeloides + Cephalobus 0 - 34 1.9 ± 6.9 0 - 26 1.6 ± 5.1 0 - 46 5.8 ± 15.3 Cephalobidae Cephalobus 0 - 200 33.7 ± 38 0 - 400 46.8 ± 82 0 - 135 22.2 ± 43 Cephalobidae Cervidellus 0 - 17 1 ± 3.1 0 - 40 2 ± 7 0 - 12 1.5 ± 4 Cephalobidae Chiloplacus 0 - 114 15.2 ± 25.9 0 - 80 12.7 ± 20.2 0 - 6 1.1 ± 2.1 Cephalobidae Eucephalobus 4 - 400 118 ± 79.8 10 - 948 m ± 189 0 - 135 24.1 ± 43.8 Cephalobidae Heterocephalobus 0 - 20 2.6 ± 5.4 0 - 46 4.4 ± 10.3 0 - 0 0 ± 0 Cephalobidae Stegelata + Acrobelophis 0 - 24 2.3 ± 5.6 0 - 38 3.2 ± 8.4 0 - 0 0 ± 0 Cephalobidae Zeldia 0 - 38 0.9 ± 5.4 0 - 0 0 ± 0 0 - 0 0 ± 0 Diplogasteridae unidentified genera 0 - 13 0.5 ± 2.1 0 - 28 1 ± 4.5 0 - 0 0 ± 0 Diplopeltidae Cylindrolaimus 0 - 107 2.1 ± 14.8 0 - 0 0 ± 0 0 - 0 0 ± 0 Leptolaimidae Chronogaster + Leptolaimus 0 - 47 1.7 ± 7.5 0 - 11 0.2 ± 1.6 0 - 6 0.8 ± 2 Monhysteridae Monhystera + others 0 - 27 1.7 ± 5.2 0 - 33 4.5 ± 8.6 0 - 0 0 ± 0 Neodiplogasteridae unidentified genera 0 - 131 5.7 ± 22.1 0 - 64 5.1 ± 13.5 0 - 0 0 ± 0 Odontopharyngidae Odontopharynx 0 - 0 0 ± 0 0 - 0 0 ± 0 0 - 27 3.4 ± 8.9
Osstellidae Drilocephalobus 0 - 14 0.5 ± 2.6 0 - 0 0 ± 0 0 - 0 0 ± 0 Panagrolaimidae Panagrolaimus + others 0 - 77 10.9 ± 18 0 - 233 23.3 ± 39.4 0 - 13 1.7 ± 4.4
Plectidae Anaplectus 0 - 55 5.1 ± 10.7 0 - 175 13.2 ± 28.6 0 - 27 5.8 ± 9.2 Plectidae Plectus 0 - 207 37.6 ± 49.6 0 - 261 42.9 ± 53.4 8 - 198 69.1 ± 62.2 Plectidae Plectus + Anaplectus1 0 - 67 3.3 ± 10 0 - 29 4.7 ± 7.9 0 - 3 0.3 ± 0.9
Plectidae Wilsonema 0 - 0 0 ± 0 0 - 0 0 ± 0 0 - 102 20.1 ± 34.2 Prismatolaimidae Prismatolaimus 0 - 22 2.2 ± 5.4 0 - 50 3.7 ± 10.2 0 - 87 40.2 ± 33.4 Rhabditidae unidentified genera 0 - 866 232.9 ± 197.7 0 - 754 157 ± 158.7 0 - 66 24.4 ± 28.4 Rhabditidae Dauer 0 - 601 74.5 ± 104.6 0 - 227 35 ± 50.8 0 - 62 20.8 ± 20.6 Rhabdolaimidae Rhabdolaimus 0 - 0 0 ± 0 0 - 14 0.3 ± 2 0 - 6 0.8 ± 2 Teratocephalidae Metateratocephalus 0 - 0 0 ± 0 0 - 4 0.1 ± 0.5 0 - 154 49.1 ± 55.6
Continued Teratocephalidae Teratocephalus 0 - 0 0 ± 0 0 - 11 0.4 ± 1.8 0 - 37 4.7 ± 12.4 Fungal-feeders Anguinidae Ditylenchus 0 - 42 3.8 ± 8.8 0 - 71 4.1 ± 11.3 0 - 37 10.5 ± 12.3 Aphelenchidae Aphelenchus 0 - 140 26.5 ± 27.7 0 - 285 33 ± 47.1 0 - 27 5.2 ± 9.3 Aphelenchoididae Aphelenchoides 0 - 262 47.2 ± 49.4 0 - 143 35 ± 32.5 0 - 169 59.3 ± 64 Diphterophoridae Diphterophora 0 - 62 3.8 ± 10.2 0 - 107 7.6 ± 19.7 0 - 0 0 ± 0 Diphterophoridae Tylolaimorphus 0 - 0 0 ± 0 0 - 0 0 ± 0 0 - 335 115.7 ± 132.2
Leptonchidae Tylencholaimus + other
genera 0 - 23 0.9 ± 3.6 0 - 110 7.2 ± 20.2 0 - 278 111.1 ± 117.3
Others2 31 11.1 4
1
Separation between the two genus was not possible; 2Unidentified nematodes which were groups with nematodes having the most similar morphological structures to calculate trophic groups abundances and indices.
Table 5. Results of the pairwise test of the PERMANOVA comparing the structure of the nematode communities based on 4 taxonomic levels of identification: P values of the Mann-Whitney or Kruskal-Wallis and Bonferroni tests.
Land-use modalities 86 genera 48 families 17 functional guilds 7 trophic groups Meadow (with crop in rotation)/ Crop 0.001 *** 0.001 *** 0.001 *** 0.002 **
Meadow (with crop in rotation)/ Permanent meadow 0.657 ns 0.593 ns 0.214 ns 0.115 ns Meadow (with crop in rotation)/ Crop (with meadow in rotation) 0.002 ** 0.003 ** 0.082 ns 0.051 ns
Meadow (with crop in rotation)/ Forests 0.001 *** 0.001 *** 0.001 *** 0.001 ***
Crop/ Permanent meadow 0.001 *** 0.001 *** 0.001 *** 0.001 ***
Crop/ Crop (with meadow in rotation) 0.054 ns 0.024 * 0.246 ns 0.325 ns
Crop/ Forests 0.001 *** 0.001 *** 0.001 *** 0.001 ***
Permanent meadow/ Crop (with meadow in rotation) 0.001 *** 0.001 *** 0.002 ** 0.001 ***
Permanent meadow/ Forests 0.001 *** 0.001 *** 0.001 *** 0.001 ***
Crop (with meadow in rotation)/ Forests 0.001 *** 0.001 *** 0.001 *** 0.001 ***
The symbol *indicates that Mann-Whitney or Kruskal-Wallis and Bonferoni tests are significant with p < 0.05; **significant at p < 0.01; *** significant
at p < 0.01.
one at the genus levels (Figure 3(a)) and the other at the functional-guild level (Figure 3(b)). The forest, crop and meadow samples were significantly separated from each other at the genus level, whereas the functional-guild level was not discriminative. Neither of the two taxo- nomic ranks distinguished the effect of rotations (C vs. Cm and M vs. Mc).
2D Stress: 0.22 2D Stress: 0.14
(a) (b)
Permanent meadow
Meadow (with crop in rotation) Crop (with meadow in rotation) Crop (continuous cropping system) Forests
3.5. Relations between Nematodes Communities, Land Use and Technical Cropping Practices The nematode ecological indices, such as the MI, BaMI, NCR and PPI, significantly responded to land use and technical cropping practices; 33 significant differences were obtained between nematode ecological indices and the crop managements (Table 6). In contrast, the total abundance of nematodes and the abundance of the dif- ferent trophic groups were discriminated to a lesser ex- tent by more or less technical cropping practices (Table
6); only 18 significant differences were recorded between
Figure 3. Multidimensional scaling on (a) nematode taxa (86) and (b) nematode functional guilds (17) for the 109 sites. nematode abundances and the crop managements.
The abundances of plant-parasitic nematodes (Pf) and of the opportunistic bacterial-feeders (Ba1) were
signifi-cantly different between crops and meadows (with or without crops in rotation). Consequently, the EI and PPI
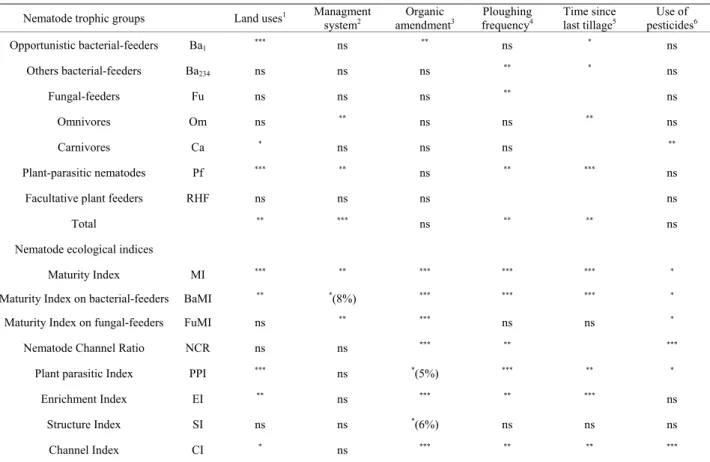
Table 6. Relations between the abundances of the nematode trophic groups and the nematode ecological indices and the crop management modalities studied using non-parametric Kruskal-Wallis and Mann-Whitney tests.
Nematode trophic groups Land uses1 Managment system2 amendmentOrganic 3 frequencyPloughing 4 Time since last tillage5 pesticidesUse of 6
Opportunistic bacterial-feeders Ba1 *** ns ** ns * ns Others bacterial-feeders Ba234 ns ns ns ** * ns Fungal-feeders Fu ns ns ns ** ns Omnivores Om ns ** ns ns ** ns Carnivores Ca * ns ns ns ** Plant-parasitic nematodes Pf *** ** ns ** *** ns
Facultative plant feeders RHF ns ns ns ns
Total ** *** ns ** ** ns
Nematode ecological indices Maturity Index MI *** ** *** *** *** *
Maturity Index on bacterial-feeders BaMI ** *(8%) *** *** *** *
Maturity Index on fungal-feeders FuMI ns ** *** ns ns *
Nematode Channel Ratio NCR ns ns *** ** ***
Plant parasitic Index PPI *** ns *(5%) *** ** *
Enrichment Index EI ** ns *** ** *** ns
Structure Index SI ns ns *(6%) ns ns ns
Channel Index CI * ns *** ** ** ***
The symbol *indicate that Mann-Whitney or Kruskal-Wallis and Bonferoni tests are significant with p < 0.05; **significant at p < 0.01; ***significant at p < 0.01; ns means not significant difference; crop, crop with meadow in rotation, 1meadow with crop in rotation, permanent meadow; 2intensive, moderate, sustainable, organic; 3none, slurry, manure, both slurry and manure; 4low, high; 5<5 months, >5 months; 6yes, no.
significantly differed by land-use. Crops with meadow in the rotation exhibit intermediate values for these pa- rameters. Total density was significantly higher in per- manent meadows than in continuous crops.
The total abundance as well as the omnivorous and plant-feeder abundances were significantly higher under sustainable crop systems vs. intensive crop systems (re- spectively from 28.4, 13.5, 1.7 ind·g−1 under sustainable vs. 15.0, 4.7, 6.0 ind·g−1 under intensive) but did not dis-tinguish among the other systems. Three of the indices were higher in sustainable systems than in intensive sys-tems (Figure 4(a)): MI (2.5 vs. 2.0), BaMI (1.8 vs. 1.6) and FuMI (2.3 vs. 2.1). Organic management did not lead to significantly different nematode community parame-ters when compared to intensive, moderate or sustainable managements. Differences were observed between plots that were not fertilised and fertilised plots, regardless of the type of amendment. The Ba1 were less abundant in no
fertilised plots (0.7 ind·g−1 vs. 2.9 ind·g−1 in average). The MI, BaMI, FuMI, CI were higher without fertilisa- tion (respectively 2.4 vs. 2.1 in average; 1.8 vs. 1.6 in average and 2.2 vs. 2.1 in average), whereas the NCR and EI were lower without fertilisation (respectively 82.4
vs. 86.9 in average and 54.4 vs. 71.5 in average) (Figure
4(b)).
Although the nematode community did not show dif- ferences among tillage practices, deep plough, pseu- do-ploughing, superficial ploughing or no ploughing (results not shown), the frequency of the ploughing sig- nificantly impacted the nematodes, as did the time since last tillage. When time since last tillage was less than five months, several parameters were reduced in comparison with plots where time since last tillage was greater than five months (Figure 4(d)): MI (1.96 vs. 2.23), BaMI (1.55 vs. 1.72), PPI (2.66 vs. 2.50), Ba234 (2.9 vs. 3.7
ind·g−1), Om (0.5 vs. 1.0 ind·g−1), Pf (3.9 vs. 9.1 ind·g−1) and total abundance (14.0 vs. 20.3 ind·g−1); in contrast, the EI (76.1 vs. 63.8) and Ba1 (3.3 vs. 2.2 ind·g−1)
in-creased; Ca were not affected (0.4 vs. 0.5 ind·g−1). Low ploughing frequency led to higher abundances of nema- todes than with high ploughing frequency (23.4 vs. 13.0 ind·g−1) and Ba234 (4.1 vs. 2.8 ind·g−1), Fu (1.1 vs. 0.6
ind·g−1), PF (11.8 vs. 3.0 ind·g−1) leading to higher MI (2.24 vs 1.99), BaMI (1.73 vs. 1.56), PPI (2.68 vs. 2.50), CI (13.1 vs. 6.9) and lower EI (61.1 vs. 76.1) (Figure
Figure 4. Box plot of the nematode parameters in relation to agricultural practices: (a) Management system and the nema- tode ecological indices MI, BaMI and FuMI; (b) Fertilisers and the nematode ecological indices MI, NCR and EI; (c) Plough- ing frequency and the nematode ecological indices MI, PPI and CI; (d) Time since last tillage and the nematode ecological indices MI, PPI and EI; (e) Use of pesticides and the nematode ecological indices MI, NCR and CI (n = 99; forest sites ex- cluded from these analyses).
nematode communities, but when pesticides were not used, the decomposition pathway was more bacterial than fungal (NCR increased and CI decreased) (Figure
4(e)).
4. Discussion
The study site network comprises 109 monitoring sites located on a 16 × 16 km systematic grid covering a very large area of 27,000 km². The sites covered contrasting pedoclimatic conditions and land uses from natural fo- rests to permanent meadows to intensive cropping. 4.1. Nematode Abundances and Soil Organic
Matter Content
Soil characteristics are the first elements that structure the nematode community even if the relation between nematodes and soil physico-chemical characteristics is rarely studied [27,28]. We analysed the relation between the nematode community characteristics and five impor- tant soil parameters (C content, total N content, C/N, available P, pH), whatever the land uses and agricultural practices. The total nematode abundance as well as the plant-parasitic nematode, the bacterial-feeder and the fungal-feeder abundances were positively correlated with the soil C content: the more organic resources are avail- able, the more nematodes are abundant [28-30]. More- over opportunistic bacterial-feeder abundance was highly correlated with available P, which is in agreement with the assumption that these nematodes multiply under rich conditions [9,22]. Bacterial-feeding nematodes are, with protozoa, the main grazers of soil bacteria. Interactions between bacteria and nematodes have important reper- cussions on soil functioning increasing the nutrient availability [29,31].
Nematode abundances, whatever the trophic groups, not correlated with the soil pH. The Nematode Channel Ratio (NCR) increased with increasing soil C, N and available P contents, indicating that, in soil with higher fertility in the Britanny area, the decomposition pathway was more bacterial than fungal. Enrichment Index and Maturity indices based on bacterial-feeders and fun-gal-feeders (BaMI and FuMI) were higher in soil high available P confirming the relation of these indices with the high nutrient status of soils. The structure Index was not significantly correlated to soil chemical fertility indi- cating that disturbances other than reduction of soil or- ganic matter content can lead to short and simple soil foodwebs (i.e. low SI).
4.2. Regional Average of Nematode Parameters and Taxa Composition in Crops, Meadows and Forests
Using this unique dataset, it was possible to clearly dis-
tinguish the nematode communities of the three main land uses. As found by van Ekeren et al. [32] in the Netherlands, and Hanel [33,34] in the Czech Republic, the nematode abundance was greater in grasslands than in crops; meadows were characterised by values ranged from 3.7 to 52.7 with an average of 20.6 ind·g−1, and croplands were characterised by values ranged from 3.8 to 35.5 with an average of 13.2 ind·g−1. The differences in densities between the crops and meadows were mainly linked to the higher abundances of plant-parasitic nema- todes in the meadows, as also seen in van Ekeren et al. [32]. The crop areas were dominated by bacterial-feeders, particularly opportunistic bacterial-feeders, indicating greater nutrient enriched conditions in crops than in meadows [35,36]. Even if it was not precisely quantified in this study, it can be said that usually, crops receive more fertilizers (mineral) than meadows in Brittany, which explain the greatest abundances of opportunistic bacterial-feeders in crops. The fungal-feeders, omnivores and facultative plant-feeders were present in similar den- sities in these two agricultural uses of lands.
Forests were characterised by total densities of nema- todes ranging from 1.7 to 57.9 with an average of 23.7 ind·g−1 and by the dominance of facultative plant-feeders, also called myco-phytophages (9.1 ind·g−1 soil). High variations in the abundances of plant-parasitic nematode observed in the forest areas (ranging from 0.1 to 30.3 in·g−1 soil) were probably due to the different types of forest sampled, from old spruce or oak forests with low phytoparasitic nematode densities to young copse forests with high densities of this trophic group [37].
The analysis of decomposition pathways by nematodes shows differences among land uses. The very low CI in crops and meadows (7.4 and 11.1 on average) indicated a dominant bacterial-decomposition pathway, more en- hanced than that found by [38] (18 and 24 respectively in crop-fields and meadows). The CI in forests was higher than in crops and meadows; extremely variable values (11 to 100, average = 51.7) may reflect the different types of forests, e.g., the coniferous forests exhibited higher CI than the deciduous forests [38]. The NCRs in crops and meadows (86 on average) were comparable to those found by van Eekeren et al. [32]. The EI was on average 76.4 (min: 46, max: 96) in crops, which is a high value at a regional scale. The high EI in meadows (greater than 64 on average; min: 13, max: 95) could be because of the large use of organic amendments in Brit- tany, which can lead to water pollution [39]. The matu- rity indices (MI, BaMI and FuMI) followed the same trends, indicating that the agricultural fields are more disturbed and show mostly very enriched conditions than the forests, with the crops being even more enriched (EI, FuMI) than the meadows [24]. The SI in forests was characterised by values ranging from 49 to 94, with an
average of 82, which was significantly higher than in the meadows and crops (average of 56 and 59, respectively), indicating longer and more complex micro-food webs in forests than in agricultural lands. However, very high variability in the SI was measured in agricultural lands, from 16 to 91 in crops and 0 to 91 in meadows, reflecting the effects of the agricultural practices.
Cephalobidae were the predominant bacterial-feeders in Brittany meadows, as also reported by [28] from vari- ous experiments. Rhabditidae outnumbered Cephalo- bidae in crops, a situation that was only reported in con- ventionally managed arable land by [24]. Plectidae were more represented in forests, particularly Wilsonema, which were found only in these ecosystems. Prismato-laimus, and Teratocephalidae, were also quite exclu-sively present in the forests. Hanel [33] found the same pattern for these bacterial-feeders, and he also found more Tylencholaimus in forests than in crops and mead-ows. However, he did not find higher densities of Tylolaimophorus in forests. The predators Clarkus and Mylonchulus have previously been found not to be af- fected by agricultural practices such as tillage [40], and Clarkus were even more abundant in crops in Brittany than in the other land uses. Clarkus and Aporcelaimellus were also found to be abundant predators in agricultural fields by Vestergard [41]. Plant-feeding nematode densi-ties are very heterogeneous across all land uses, varying from 0 to 39.2 ind·g−1. The nematode communities were dominated by Tylenchorhynchus and Pratylenchus in the cropped fields, by Meloidogyne in the meadows and by Paratylenchus in the forests. The greater abundances of the plant-parasitic nematodes, especially Meloidogyne, that were detected in the perennial sites than in the an-nual sites may be linked in part to the vegetation state on the sampling date; in March and April, the meadows have developed a higher root biomass than have the an-nual crops that have just begun their vegetative cycle. 4.3. The Taxonomic Rank of Determination as a
Tool to Discriminate Modalities
The objective of this study was not to determine the nematode diversity at species level; it would have re-quired a much more intensive effort to identify the 21,820 observed nematodes. Such a nematode species inventory is absent for France, and it should be of great interest in the future to have a complete study of the bio-diversity of these organisms and, particularly, its loss [4]. However, for the ecological analysis and evaluation of the soil ecosystem services supported by the mi-cro-regulators [11,42,43], and for the commercial use of nematodes as bioindicators [44], a time/money compati-ble taxonomical resolution is required. Total nematode abundance is know, since long time, to be well correlated
to herbage production in pasture [45]. However, when studying other land uses, it is not always such a good parameter to evaluate soil quality as it includes orga- nisms with very different roles in agrosystem functioning, such as parasites of plants and micro-regulators [46]. Trophic groups are the first pertinent level of nematode grouping [21], followed by functional guilds (trophic group × cp class), families, whose genera and species usually belong to the same functional guild, and finally, the highest level of identification, species or genera [23,24].
In this study, four different taxonomic levels (genus: 86; families: 48; functional guilds: 17 and trophic groups: 6) were used to distinguish among five land uses. The distinction between permanent meadows, continuous crops and forests was highly significant for all taxonomic levels. The distinction between permanent meadows and meadows with crops in the rotation was never possible for any taxonomic level. Continuous crops and crops with meadows in rotation were significantly different only for the family level. Finally, meadows with crops in rotation and crops with meadows in rotation were sig- nificantly different for both genus and family levels. From these results, it appeared that analysis at the family level (and genus for families that include species with different trophic behaviours) was the most efficient for soil quality monitoring programmes using nematodes as descriptors.
4.4. Relations between Biological Data and Agricultural Practices
The nematodes parameters (the densities of the trophic groups and the nematode ecological indices) have been partly confronted to explanatory variables such as the agricultural management practices.
The management modalities considered here influence the abundance of soil nematodes significantly. The low- est abundances were found under both intensive and or- ganic management, whereas the highest was found under sustainable management. Several studies have shown that the abundance of soil nematodes is increased under or- ganic agriculture compared to intensive agriculture [28,47], however, such results were not found in French Brittany. Sustainable strategies led to higher MIs (in- cluding those of bacterial- and fungal-feeders), indicating a less disturbed situation with significantly more persis- tent microbivores than opportunist microbivores. For some indices, no differences were found between organic, moderate and conventional management systems, as was expected [48,49], possibly because of the low numbers of plots with organic (=7) and moderate (n = 4) manage- ment systems. Tillage is known to greatly influence the soil biological activities and nematode structures [30,35].
No differences were found in the nematode patterns or indices between the upper or deep tillage practices; however, the ploughing frequency and time since last tillage led to disturbances in the nematode communities, as shown by the reduction in the Maturity Index, the in- crease in the Enrichment Index and the decrease in the BaMI. The decomposition pathways were more bacte- rial-based in areas with high ploughing frequencies and time since last tillage reduced (higher CI, lower NCR).
According to the literature, mineral and organic amendments can cause increases in microbivorous ne- matodes [23,29,50]. In this study, very few plots received no fertiliser (neither organic nor mineral), but they ex- hibited higher Maturity Indices and lower NCR than those fertilised with organic and mineral amendments in combination, indicating a decrease of the opportunistic Rhabditidae and an enhancement of the fungal-feeders in these communities. The only significant, measured ef-fects of pesticides on the nematode parameters were on NCR and CI, suggesting the involvement of pesticides in the fungal decomposition pathway.
This study shows the relevance of nematode descrip-tors, especially the ecological indices, to distinguish among most agricultural practices. These parameters could be used as bioindicators of land use practices.
5. Conclusion
The RMQS BioDiv programme provided the opportunity to develop a database with relevant frame of references for nematodes assemblages. This dataset could contribute to the development of biological indicators at the Euro- pean scale. This initial inventory will be used over time to assess the dynamics of the biological status of soils from land use, agricultural practices, contamination and climate changes.
6. Acknowledgements
We thank all of the farmers who kindly allowed us to access to their land and all of the contributors who col-lected soil data, especially Vincent MERCIER. This pro-gramme was part of “Bioindicator-Phase1” projects funded by ADEME (French Environment and Energy Management Agency).
REFERENCES
[1] UNCED, “United Nations Conference on Environment and Development Agenda 21, Rio de Janeiro,” 1992. [2] European Commission, “Communication from the Com-
mission to the Council, the European Parliament, the Eu- ropean Economic and Social Committee and the Com- mittee of the Regions: Thematic Strategy for Soil Protec-tion,” Vol. 231, 2006.
http://ec.europa.eu/environment/soil/
[3] X. Morvan, N. P. A. Saby, D. Arrouays, C. Le Bas, R. J. A. Jones, F. G. A. Verheijen, P. H. Bellamy, M. Stephens and M. G. Kibblewhite, “Soil Monitoring in Europe: A Review of Existing Systems and Requirements for Har-monisation,” Sciences of Total Environment, Vol. 391, No. 1, 2008, pp. 1-12.
[4] A. Bispo, G. Pérès, D. Cluzeau, U. Graefe, J. Römbke, M. Rutgers, M. Fuchs, J. P. Sousa, R. Schulte, M. Dombos, B. Simon, A. Gal, J. Cortet, R. Chaussod, K. Ritz, R. E. Creamer, A. Winding, M. English, J. Boixadera and J. Rubio, “ENVASSO (Environmental Assessment of Soil for Monitoring) WP 5—Decline in Soil Biodiversity,” 2007.
[5] S. Krück, M. Joschko, R. Schultz-Sternberg, B. Krosche- wski and J. Tessmann, “A Classification Scheme for Ear- thworm Populations (Lumbricidae) in Cultivated Agri- cultural Soils in Brandenburg, Germany,” Journal of Plant Nutrition and Soil Science, Vol. 169, No. 5, 2006, pp. 651-660.
[6] D. Cluzeau, G. Pérès, M. Guernion, R. Chaussod, J. Cor- tet, M. Fargette, F. Martin-Laurent, T. Mateille, C. Pernin, J.-F. Ponge, N. Ruiz-Camacho, C. Villenave, L. Rougé, V. Mercier, A. Bellido, M. Cannavacciuolo, D. Piron, D. Arrouays, L. Boulonne, C. Jolivet, P. Lavelle, E. Velas- quez, O. Plantard, C. Walter, B. Foucaud-Lemercier, S. Tico, J.-L. Giteau and A. Bispo, “Integrating Biodiversity in Soil Quality Monitoring Networks: Example of the Pi- lot Programme at the Regional Scale, the ‘RMQS Bio- Div’ (Intégration de la Biodiversité des Sols Dans les réSeaux de Surveillance de la Qualité des Sols: Exemple du Programme-Pilote à L'éChelle Régionale, le RMQS BioDiv),” Study and Soil Management (Etude et Gestion des Sols), Vol. 16, No. 3-4, 2009, pp. 187-201.
[7] M. Rutgers, A. J. Schouten, J. Bloem, Eekeren van N. J. M, R. G. M. de Goede, G. A. J. M. Jagers op Akkerhuis, A. Van der Wal, C. Mulder, L. Brussaard and A. M. Breure, “Biological Measurements in a Nationwide Soil Monitoring Network,” European Journal of Soil Science, Vol. 60, No. 5, 2009, pp. 820-832.
[8] M. G. Paoletti, “Using Bioindicators Based on Biodiver- sity to Assess Landscape Sustainability,” Agriculture, Eco- systems & Environment, Vol. 74, No. 1-3, 1999, pp. 1-18. [9] T. Bongers and H. Ferris, “Nematode Community Struc-
ture as a Bioindicator in Environmental Monitoring,” Trends in Ecology and Evolution, Vol. 14, No. 6, 1999, pp. 224-228. doi:10.1016/S0169-5347(98)01583-3
[10] J. Cortet, A. G. De Vauflery, N. P. Balaguer, L. Gomot, C. Texier and D. Cluzeau, “The Use of Invertebrate Soil Fauna in Monitoring Pollutant Effects,” European Jour- nal of Soil Biology, Vol. 35, No. 3, 1999, pp. 115-134.
doi:10.1016/S1164-5563(00)00116-3
[11] L. Brussaard, “Soil Biodiversity for Agricultural Sustai- nability,” Agriculture, Ecosystems and Environment, Vol. 121, No. 3, 2007, pp. 233-244.
[12] A. Bispo, D. Cluzeau, R. E. Creamer, U. Graefe, P. H. Krogh, J. P. Sousa, G. Peres, M. Rutgers, A. Winding and J. Römbke, “Indicators for Monitoring Soil Biodiversity,” Integrated Environment Assessment Management, Vol. 5, No. 4, 2009, pp. 717-719.
rent, C. Villenave, J. Cortet, N. Ruiz-Camacho, C. Pernin, T. Mateille, L. Philippot, A. Bellido, L. Rougé, D. Ar- rouays, A. Bispo and G. Pérès, “Integration of Biodiver- sity in Soil Quality Monitoring: Baselines for Microbial and Soil Fauna Parameters for Different Land-Use Types,” European Journal of Soil Biology, Vol. 49, 2012, pp. 63-72.
[14] D. Arrouays, C. Jolivet, L. Boulonne, G. Bodineau, N. P. A. Saby and E. Grolleau, “A New Initiative in France: A Multi-Institutional Soil Quality Monitoring Network,” Comptes Rendus de l’Academie d’Agriculture de France, Vol. 88, No. 2, 2002, pp. 93-103.
[15] N. P. A. Saby, J. Thioulouse, C. Jolivet, C. Ratié, L. Bou- lonne, A. Bispo and D. Arrouays, “Multivariate Analysis of the Spatial Patterns of 8 Trace Elements Using the French Soil Monitoring Network Data,” Sciences of Total Environment, Vol. 407, No. 21, 2009, pp. 5644-5652. [16] J. W. Seinhorst, “Modifications of the Elutriation Method
for Extracting Nematodes from Soil,” Nematologica, Vol. 8, No. 2, 1962, pp. 117-128.
[17] ISO 23611-4, “Soil Quality—Sampling of Soil Inverte- brates. Part 4: Sampling, Extraction and Determination of Soil-Inhabiting Nematodes,” Geneva, 2007.
[18] I. Andrassy, “Klasse Nematoda (Ordnungen Monhysteri- da, Desmoscolecida, Araeolaimida, Chromadorida, Rhab- ditida),” Akademie-Verlag, Berlin, 1984.
[19] T. Bongers, “Nematodes from Netherlands (De Nemato- den van Nederland),” Koninklijke Nederlandse Natuu- rhistorische Vereniging, Utrecht, 1994.
[20] M. R. Siddiqi, “Tylenchida. Parasites of Plants and In- sects,” CABI, 2000. doi:10.1079/9780851992020.0000
[21] G. W. Yeates, T. Bongers, R. G. M. de Goede, D. W. Fre- ckman and S. S. Georgieva, “Feeding Habits in Soil Nematode Families and Genera—An Outline for Soil Ecologists,” Journal of Nematology, Vol. 25, No. 3, 1993, pp. 315-331.
[22] T. Bongers, “The Maturity Index: An Ecological Measure of Environmental Disturbance Based on Nematode Spe- cies Composition,” Oecologia, Vol. 83, No. 1, 1990, pp. 14-19.
[23] H. Ferris, T. Bongers and R. de Goede, “A Framework for Soil Food Web Diagnostics: Extension of the Nema- tode Faunal Analysis Concept,” Applied Soil Ecology, Vol. 18, No. 1, 2001, pp. 13-29.
doi:10.1016/S0929-1393(01)00152-4
[24] G. W. Yeates, “Nematodes as Soil Indicators: Functional and Biodiversity Aspects,” Biology and Fertility of Soils, Vol. 37, No. 4, 2003, pp. 199-210.
[25] J. B. Kruskal and M. Wish, “Multidimensional Scaling. on Quantitative Applications in the Social Sciences,” Sage Publications, London., 1978.
[26] M. J. Anderson, R. N. Gorley and K. R. Clarke, “Perma- nova+ for Primer. Guide to Software and Statistical Methods,” PRIMER-E, Ltd., Plymouth, 2008.
[27] C. Villenave and P. Cadet, “Influence of Soil Organic Mat- ter and Ion Concentration on Some Senegalese Plant-Pa- rasitic Nematodes,” European Journal of Soil Biology, Vol. 35, No. 4, 1999, pp. 189-197.
doi:10.1016/S1164-5563(10)70005-4
[28] G. W. Yeates, R. D. Bardgett, R. Cook, P. J. Hobbs, P. J. Bowling and J. F. Potter, “Faunal and Microbial Diversity in Three Welsh Grassland Soils under Conventional and Organic Management Regimes,” Journal of Applied Ecol-ogy, Vol. 34, No. 2, 1997, pp. 453-470.
doi:10.2307/2404890
[29] C. Villenave, K. Ekschmitt, S. Nazaret and T. Bongers, “Interactions between Nematodes and Microbial Com- munities in a Tropical Soil Following Manipulation of the Soil Food Web,” Soil Biology & Biochemistry, Vol., No. 36, 2004, pp. 2033-2043.
[30] C. Villenave, A. O. Ba and B. Rabary, “Analysis of Soil Biological Functionning by the Study of Nematofauna: Direct Seeding Versus Tillage in the Highlands near Ant- sirabe (Madagascar) (Analyse du Fonctionnement Biolo- gique du sol Par L’étude de la Nematofaune: Semis Di-rect Versus Labour sur les Hautes Terres près d’Antsirabé (Madagascar)),” Study and Soil Management, Vol. 16, No. 3-4, 2009, pp. 369-378.
[31] U. Irshad, C. Villenave, A. Brauman and C. Plassard, “Gra- zing by Nematodes on Rhizosphere Bacteria Enhances Nitrate and Phosphorus Availability to Pinus Pinaster Seedlings,” Soil Biology & Biochemistry, Vol. 43, No. 10, 2011, pp. 2121-2126.
[32] N. van Eekeren, L. Bommele, J. Bloem, T. Schouten, M. Rutgers, R. G. M. deGoede, D. Reheul and L. Brussaard, “Soil Biological Quality after 36 Years of Ley-Arable Cropping, Permanent Grassland and Permanent Arable Cropping,” Applied Soil Ecology, Vol. 40, No. 3, 2008, pp. 432-446. doi:10.1016/j.apsoil.2008.06.010
[33] L. Hanel, “Secondary Successional Stages of Soil Nema- todes in Cambisols of South Bohemia,” Nematologica, Vol. 41, No. 1-5, 1995, pp. 197-218.
[34] L. Hanel, “Recovery of Soil Nematode Populations from Cropping Stress by Natural Secondary Succession to Meadow Land,” Applied Soil Ecology, Vol. 22, No. 3, 2003, pp. 255-270. doi:10.1016/S0929-1393(02)00152-X
[35] H. Okada and H. Haradaba, “Effects of Tillage and Fer-tilizer on Nematode Communities in a Japanese Soybean Field,” Applied Soil Ecology, Vol. 35, No. 3, 2007, pp. 582-598.
[36] W. Liang, Y. Lou, L. Q. S. Zhong, X. Zhang and J. Wang, “Nematode Faunal Response to Long-Term Application of Nitrogen Fertilizer and Organic Manure in Northeast China,” Soil Biology & Biochemistry, Vol. 41, No. 5, 2009, pp. 883-890.
[37] L. Hanel, “Soil Nematodes in Five Spruce Forests of the Beskydy Montains, Czech Republic,” Fundamental and Applied Nematology, Vol. 19, No. 1, 1996, pp. 15-24. [38] L. Ruess, “Nematode Soil Faunal Analysis of Decompo-
sition Pathways in Different Ecosystems,” Nematology, Vol. 5, No. 2, 2003, pp. 179-181.
doi:10.1163/156854103767139662
[39] J. Molénat, P. Durand, C. Gascuel-Odoux, P. Davy and G. Gruau, “Mechanisms of Nitrate Transfer from Soil to Stream in an Agricultural Watershed of French Brittany,” Water Air Soil Pollution, Vol. 133, No. 1-4, 2002, pp. 161-183.
[40] D. W. Freckman and C. H. Ettema, “Assessing Nematode Communities in Agroecosystems of Varying Human In-tervention,” Agriculture, Ecosystems & Environment, Vol. 45, No. 3-4, 1993, pp. 239-261.
[41] M. Vestergard, “Nematode Assemblages in the Rhizos- phere of Spring Barley (Hordeum Vulgare L.) Depended on Fertilisation and Plant Growth Phase,” Pedobiologia, Vol. 48, No. 3, 2004, pp. 257-265.
doi:10.1016/j.pedobi.2004.01.003
[42] G. A. Adams and D. H. Wall, “Biodiversity above and below the Surface of Soils and Sediments: Linkages and Implications for Global Change,” Bioscience, Vol. 50, No. 12, 2000, pp. 1043-1048.
doi:10.1641/0006-3568(2000)050[1043:BAABTS]2.0.C O;2
[43] P. Lavelle, T. Decaëns, A. Aubert, S. Barot, M. Blouin, F. Bureau, P. Margerie, P. Mora and J.-P. Rossi, “Soil In- vertebrates and Ecosystem Services,” European Journal of Soil Biology, Vol. 42, Suppl. 1, 2006, pp. S3-S15. [44] M. W. Trett, B. C. Urbano, S. J. Forster and S. P. Trett,
“Commercial Aspects of the Use of Nematodes as Bioin- dicators,” In: M. J. Wilson and T. Kakouli-Duarte, (Eds), Nematodes as Environmental Indicators, CABI, Walling- ford, 2009, pp. 1-44.
[45] G. W. Yeates, “Soil Nematodes in Terrestrial Ecosystems,”
Journal of Nematology, Vol. 11, No. 3, 1979, pp. 213-229. [46] T. Bongers, H. van der Meulen and G. Korthals, “Inverse
Relationship between the Nematode Maturity Index and Plant Parasitic Index under Enriched Nutrient Condi-tions,” Applied Soil Ecology, Vol. 6, No. 2, 1997, pp. 195- 199.
[47] P. Coll, E. Le Cadre, E. Blanchart, P. Hinsinger and C. Villenave, “Organic Viticulture and Soil Quality: A Long- Term Study in Southern France,” Applied Soil Ecology, Vol. 50, No. 1, 2011, pp. 37-44.
[48] D. A. Neher, “Soil Community Composition and Ecosys- tem Processes—Comparing Agricultural Ecosystems with Natural Ecosystems,” Agroforestry Systems, Vol. 45, No. 1-3, 1999, pp. 159-185. doi:10.1023/A:1006299100678
[49] C. Mulder, D. De-Zwart, H. J. Van Wijnen, A. J. Schou- ten and A. M. Breure, “Observational and Simulated Evi- dence of Ecological Shifts within the Soil Nematode Com- munity of Agroecosystems under Conventional and Or- ganic Farming,” Functional Ecology, Vol. 17, No. 4, 2003, pp. 516-525. doi:10.1046/j.1365-2435.2003.00755.x
[50] C. Villenave, S. Saj, A.-L. Pablo, S. Sall, D. Djigal, J.-L. Chotte and M. Bonzi, “Influence of Long-Term Organic and Mineral Fertilization on Soil Nematofauna when Growing Sorghum Bicolor in Burkina Faso,” Biology and Fertility of Soils, Vol. 46, No. 7, 2010, pp. 659-670.