Aggregate Model and Analysis of the Energy Dynamics in the Kingdom of Saudi Arabia By
Khalid A. Al-Ahmed
Bachelor of Science, Computer Science 2003 Pennsylvania State University, University Park PA 16802
Submitted to the System Design and Management Program in Partial Fulfillment of the Requirements for the Degree of
MASTER OF SCIENCE IN ENGINEERING AND MANAGEMENT At the
MASSACHUSETTS INSTITUTE OF TECHNOLOGY May 2012
Khalid A. Al-Ahmed All Rights Reserved
The author hereby grants to MIT permission to reproduce and to distribute publicly paper and electronic copies of this thesis document in whole or in part in any medium now known or hereafter created.
Signature of the Author System Design and Management Program
/ May 11, 2012
Certified by Professor Olivier de Weck
Thesis Supervisor Professor of Aeronauti nd Astronautic En~e n Systemsug
pted by
L.- - Patrick C. Hale Director, System Design and Management Program
Dedication
This thesis is dedicated to my parents and my brothers and sisters. My older sister Farida deserves special mention, for playing a vital role in my academic development in my early school years. I am also grateful to my lovely wife Sarah for her support of my work, and to my son Faisal whose future inspired me to choose this topic.
Acknowledgments
This research would have not been possible without the guidance and help of several individuals. I owe Dr. Olivier de Weck my utmost gratitude for his sincere guidance, encouragement, and support from the first day, and every step of this research. My fellow researchers at the Center for Complex Engineering Systems (CCES) here at MIT and the CCES team in King Abdulaziz City for Science and Technology in Saudi Arabia provided guidance, feedback, and help in the data collection process.
The time I have spent with my colleagues at the System Design and Management program in the classroom and on projects has proven to be one of the most rewarding of aspects of my work here. Their diverse backgrounds and expertise have contributed immensely to my learning experience at MIT. My other colleagues at the MIT Sloan School of Management have added immensely to my academic and personal growth.
Abstract
The Kingdom of Saudi Arabia is facing a crisis in the near future centered on increasing energy consumption. Today, the kingdom consumes approximately 1/3 of its oil
production. If no action is taken and the kingdom continues business as usual, by 2026 it will consume 50% of its production, and by 2047 its entire production. A large
percentage of oil produced in the kingdom is used for electrical generation and to fulfill increasing industrial, transportation, and water demand. In 2010 the kingdom
consumed 212,262.6 GWh-9.7% more electricity than in the previous year. This thesis analyzes how the current situation has developed, then lays out the important elements of Saudi energy dynamics on a national scale. The following chapters demonstrate the application of causal loop analysis to the Saudi situation through a system dynamics model. Technical, financial, and socio-economic challenges in energy management were used to derive key dynamic variables included in the model which shows how increasing
GDP and population drive local electrical demand. Energy policy scenarios involving
increased use of natural gas and/or diversification into solar electrical generation were simulated by the model. The model showed that the result would be increased oil exports, which in return yielded a higher GDP and more investments in economic and industrial growth. The output of the model showed that diversification would defer the crisis for only a few years if current consumption trends continue. A hybrid scenario that couples diversification with an aggressive energy efficiency policy to stimulate reduced consumption demonstrated electrical consumption levels below 400,000 GWh,
sustainable over the next 35 years. In all other scenarios electrical consumption increased rapidly beyond 600,000 GWh over the same period. The thesis concludes with some key findings and recommendations for the future development of
Table of Contents
Introduction ... 9
Organization of the Thesis... 10
Chapter 1: The Case for Energy Diversification in Saudi Arabia ... 13
The Energy Challenge ... 13
Population Growth ... 16
Water Consumption ... 21
Remedies to the Energy Problem... 24
Chapter 2: Electrical Consum ption in Saudi Arabia ... 27
Current Situation ... 27
Installed Capacity ... 29
Consumption by Sector... 30
Electricity W aste Streams... 31
The Price of Electricity ... 33
Electrical Generation Efficiency... 34
S um m a ry ... 35
Chapter 3: Analyzing the Energy Challenge in Saudi Arabia Using System Dynamics (Building the Model)...36
Thesis M ethodology - The System Dynamics Approach ... 36
Purpose of the M odel ... 38
System Dynamics vs. Open-Loop Thinking... 38
System Dynamics M odel-Building Process ... 40
A Systems Approach to Energy Diversification ... 41
M odel Building ... 42
Explanation of the M ain Causal Loops ... 44
Variables Used in Modeling Energy ... 47
M ain Drivers of Energy Consumption ... 48
Oil Revenue and Economic Sector Growth in Relation to GDP ... 48
GDP in Relation to Change in Electrical Consumption Level... 52
Dynamic Complexities and Challenges to Modeling Energy Use in Saudi Arabia Using System D yn a m ics ... 55
S u m m a ry ... 5 9 Chapter 4: Electrical Conservation Through Efficiency and Awareness ... 61
Electrical Conservation Through Efficiency... 61
Electrical Conservation through Awareness ... 64
Behavior: Areas for Reduced Electricity Consumption... 65
A Combined Approach to Conservation: Efficiency and Consumer Behavior Working Together ... 6 7 Efficiency M odel Assumptions ... 68
Awareness M odel Assumptions ... 69
Conservation Causal Loop Diagram... 70
Sites and Potentials ... 77
What Type of Solar Technology is Most Suitable for Saudi Arabia?... 78
Cost and Efficiency of Solar Cells ... 81
Solar Capacity Expansion System Dynamics Sub-Model... 82
Other Potential Uses for Solar Power in the Kingdom ... 84
Chapter 6 Aggregate Energy M odel and Sim ulation Results ... 86
Aggregate Model... 86
Accounting for Population in the Model... 88
Scenario 1: Base Case Scenario ... 91
Model Validation ... 93
Scenario 2: Increase in Natural Gas Used for Electrical Generation ... 97
Scenario 3: Introduction of Solar Energy ... 100
Scenario 4: Government Efficiency Policy... 102
Monte Carlo Simulation Analysis... 108
Chapter 7: Conclusions and Recom mendations... 113
The World Bank Approach... 113
Fu ture W o rk... 118
Appendices ... 121
Appendix A: System Dynamics Model Diagram... 121
Appendix B: Model Documentation and Equations... 122
Appendix C: Scenario 4 Long Period Simulation ... 129
Appendix D: Additional Monte Carlo Simulation Outputs ... 129
Introduction
This study uses systems dynamics to model potential directions for managing rapidly increasing electricity consumption in the Kingdom of Saudi Arabia (KSA). Saudi Arabia has felt the impacts of a rapidly growing population, and an aggressive industrial and urban expansion. The critical links between energy production, population growth, industrial expansion, and electricity consumption are discussed below. In this, the kingdom parallels a similar evolution of other rapidly evolving nations world wide relationship worldwide.
Energy abundance in the form of petroleum reserves, and global oil prices have created cycles of oil booms in the kingdom, to which the Saudi government has responded with massive spending on infrastructure, industrial expansion, education, and many other areas. Though low oil cycles have been met with conservative spending, the cumulative effect of oil booms has contributed to the development of the nation over the past 80 years.
That development has been contributed to increased energy demand. The kingdom today is faced with a domestic energy crisis in a period of relatively high global oil prices (on the order of $100 per barrel). Government officials are challenged to make smart and calculated decisions that would guarantee the energy security today and the wealth and sustainability of the nation tomorrow. This study focuses on electrical consumption
However, improved electricity consumption and management in Saudi Arabia require approaches that reflect the kingdom's unique combination of industrial, cultural, and geographical characteristics. This study develops and combines several system dynamics models, applying different ways to understand the causal loop effects of electricity use in Saudi Arabia. Included are analyses of the potential impact of alternative energy options, particularly solar energy. The study concludes with
recommendations for government policy tailored to Saudi Arabia's people and energy requirements that will help reshape the current energy system and set it on a more sustainable trajectory.
Organization of the Thesis
In this thesis, Saudi Arabia's energy challenge is highlighted in chapter 1, and the current energy facts are laid out to explain the causes of the energy crisis in the kingdom. The effect of population growth and industrial activity on water and electrical consumption is then discussed. The chapter concludes with a list of potential remedies to the energy problem. The effectiveness of these remedial actions will then be quantified and tested in subsequent chapters.
Chapter 2 focuses on electrical consumption in the kingdom and current demand and consumption per capita, as well as consumption by sector and operational area. The chapter also lists the types of fuels used for electrical generation, their efficiencies, and the price of electricity as a major factor in the energy challenge.
Chapter 3 discusses the value of system dynamics as a non-linear method to analyze the current aggregate situation in the kingdom as well as the possible outcomes of
government energy policies. This chapter includes a step-by-step explanation of building a system dynamics model. It also lays out the complexities of mapping
variables and representing the current energy situation as a validated system dynamics model.
Chapter 4 presents the potential value of energy conservation and efficiency. A system dynamics model suggests that savings could be realized through technical efficiency in air conditioning units and more conservative consumer behavior. The model assumes that government subsidies that promote efficiency and investment in awareness are critical to achieving energy savings in the long run.
Chapter 5 discusses the possibilities of utilizing alternative energy sources for electrical generation and presents another system dynamics model that represents the potential growth of solar energy use in the kingdom. The chapter includes data about the type of solar technology that is most suitable for the kingdom based on geographical data, atmospheric conditions and solar irradiation. The solar discussion concludes with other potential uses of solar technologies in the kingdom.
Chapter 6 shows the aggregation of all the system dynamics models developed in Chapters 3 and 5 into an integrated model, and presents four different scenarios and their outcomes. The objective of the analysis is to identify the most effective approach to the energy problem based on the aggregate system dynamics model as a decision support tool. A set of model output variables are monitored and analyzed in each simulation scenario.
Chapter 7 reviews and discusses the conclusions of the study. Based on the system dynamics model presented and analysis of the data, a set of energy policy
recommendations is presented. The chapter also lists future areas of research that might be studied under the umbrella of energy diversification in Saudi Arabia.
Chapter 1: The Case for Energy Diversification in Saudi Arabia
The Energy Challenge
The Kingdom of Saudi Arabia (KSA) relies heavily on the burning of fossil fuels but has the potential to develop sustainable energy technologies with world-wide applicability. Today, the Kingdom is delving into nuclear and renewable energy sources in an effort to reduce its reliance on hydrocarbons. At present (2010) approximately 877,000 barrels of oil are used per day for electricity generation, corresponding to about 320 million barrels per year (Singh 2010). This represents roughly 10% of Saudi oil production. All this is occurring in parallel to rapid industrial and residential growth. At the current rate and by continuing business as usual, by 2030 this acceleration will increase internal consumption and reliance on fossil fuels for electrical generation to approximately three times the amount that is consumed today
4.0 3.5 3 1.0 5 2.5 0 e1.5 1. C 0 0.5 0.0 1970 1974 1978 1982 1986 1990 1994 1998 2002 2006 2010 (Jadwa 2011)
the KSA Energy Efficiency Report, energy consumption has grown at a rate of 5.8% per year since 1990, tripling between 1990 and 2009 (Enerdata ). This rapid growth in primary energy consumption will surely continue if no corrective measures are taken. Action must be taken to control energy consumption and protect natural energy resources while sustaining economic growth and mitigating environmental impact.
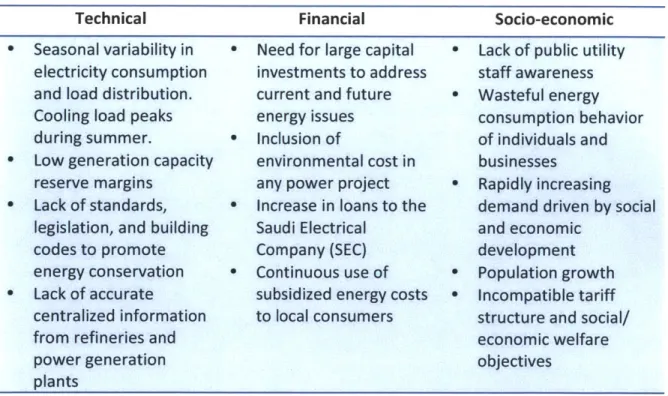
Saudi Arabia's electrical energy challenge is aggravated by a combination of technical, financial, and socio-economic challenges:
Technical Financial Socio-economic
* Seasonal variability in e Need for large capital e Lack of public utility
electricity consumption investments to address staff awareness and load distribution. current and future e Wasteful energy
Cooling load peaks energy issues consumption behavior
during summer. - Inclusion of of individuals and
* Low generation capacity environmental cost in businesses
reserve margins any power project - Rapidly increasing
e Lack of standards, * Increase in loans to the demand driven by social legislation, and building Saudi Electrical and economic
codes to promote Company (SEC) development
energy conservation e Continuous use of * Population growth * Lack of accurate subsidized energy costs e Incompatible tariff
centralized information to local consumers structure and social/
from refineries and economic welfare
power generation objectives
plants
Table 1.1 - Challenges to Effective Management of Energy Consumption in KSA (Al-Ajlan
2006)
To address the complexities and challenges of industrial and economic expansion as well as population growth, decision makers and stakeholders require a model that enables
them to better understand current energy flows in the kingdom. Because regional and sectoral demand for energy varies, managers need an improved understanding of more specific supply and demand dynamics. A linear model that simply projects forward past growth trends is insufficient because it does not account for the coupled nature of the underlying dynamics of the energy system and the emergent behaviors (both helpful and detrimental) caused by various policy actions.
While many technical modeling methods exist, this study contends that simulating a combination of models is the only way to understand the problem in detail sufficient to indicate appropriate measures to resolve it.
Forecasts indicate that primary energy consumption will sharply increase in the next 30 years. The government is aware that the kingdom's rapid increases in water and
electricity demand are driven by a combination of high population growth, urbanization, lack of efficiency, and economic development. In response, the government continues to invest heavily in expanding refining capacity and boosting natural gas production. At the same time it continues to support the petrochemical industry as well as the
non-oil-intensive sectors to boost the economy more broadly (QNB Capital ). Capacity expansion is an obvious action to be taken faced with increasing demand. One of the objectives oft this research, however, is to investigate other actions that could be taken, either alone, or in conjunction with capacity expansion that could lead to a better future state.
Population Growth
It has been argued that population growth is the main driver of energy consumption worldwide. In his article, Paul Chefurka (2007) argues that overpopulation is the root of all converging crises in today's world. He claims that the environment is unable to keep up with what an exploding population needs across all sectors including food, energy, waste disposal, air, fresh water, etc. While a detailed analysis of world population and energy growth is not essential to the argument presented here, the relationship is discussed below to set the stage for the study as a whole and to underscore the urgency of the problem.
Chefurka introduced the term "Carrying Capacity" which is basically defined as the population level that can be supported sustainably using available resources. Therefore, it can be inferred that an increase in population is an advance toward the limits of
planetary carrying capacity. However, carrying capacity can be expanded in some dimensions as we discover more resources (oil, metals, uninhabited land, etc.) or introduce new technologies to exploit them more efficiently. One major resource that
has contributed to the exploding global population is available energy, more specifically oil energy as well as advances in other areas such as agriculture and health care.
Figure 1.2 below, shows the increase in human population over the last 2000 years. It also shows use of oil more and more intensively as a source of energy beginning around
years, we can development
infer that energy abundance has played a major role in the expansion and of other industries that eventually led to such growth.
Figure 1.2 - World Population and Oil Production (2000 Years) (Chefurka 2007) Figure 1.3 shows a strong correlation between oil-based energy production and global population growth during the twentieth century. Oil has enabled us to grow many other industries resulting in an increase in global carrying capacity through urbanization, food production, and discovery of more finite resources.
World Population and Oil Production
7 30 6 25 5
377
-10"
22 1 5 o 0 0 0 0 0 200 400 600 800 1000 1200 1400 1600 1800 2000Figure 1.3 - World Oil Production and Population 1900-2005 (Chefurka 2007)
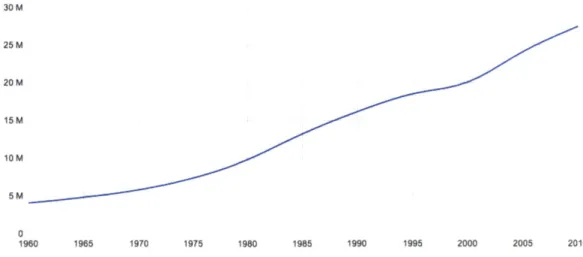
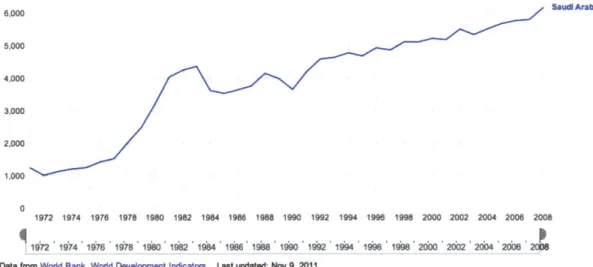
On a national scale, Saudi Arabia has followed that global trend; population has grown in parallel to the increase in oil production. The total population of the kingdom today, approximately 27 million people, coupled with increasing per capita energy
consumption, is a major driver of energy consumption in Saudi Arabia. If these trends continue, more energy will be required to increase the "carrying capacity" for Saudi Arabia. The diagram below shows the kingdom's population over the past 50 years, a sharp increase for the period after 1980, and even a slightly sharper increase after 2000.
World Oil Production and Population 1900-2005
7 90 80 6 70 1 5 60 41 50 20. *4 C 40 ~ FO3 -30 22 10 1 0 1900 1910 1920 1930 1940 1950 1960 1970 1980 1990 2000
30 M 25M 20 M 15M 10M 5M 0 1960 1965 1970 1975 1980 1985 1990 1995 2000 2005 2010
Figure 1.4 - Saudi Arabia's Population 1960-2010 (World Bank 2010) Though the current population is around 27 million people, Saudi Arabian nationals represent only 66% of the population (18 million). With the rapid growth of many
industries, the number of expatriates working in the kingdom continues to contribute to population growth. In 2010 Saudi Arabia ranked fourth in immigration among all
countries. As part of a program of "Saudization", KSA now requires local companies to employ a percentage of Saudi nationals. Despite such laws, the number of immigrants is likely to stay high due to rapid economic growth in non-oil sectors.
Top iInMme ea
CousrMes,
2010- of nmisgat, neil. United Statesb 42.8 Russian Federuion." 12.3 eM"an 10.8 Saui Arabia' 7.3 Canada' 7.2 United KlisM ' 7.0 Spaim' 6.9 France' L7 Austrlia' 5.j India' 5.
Other elements are contributing to the increased population of Saudi Arabia. For example, life expectancy is currently at 73.3 years, significantly higher than the 44.5 years it was in 1960. Also, higher fertility rates and a sharp drop in infant mortality rate have all contributed to the population increase in the kingdom (Chefurka 2007). Based on the "carrying capacity" argument and experience from developed nations, one can anticipate that population growth in Saudi Arabia will eventually slow and level off in the next 50 years. Other factors contributing to the decrease in population growth are increased economic development, rising GDP, higher levels of education, as well as the involvement of women in the workforce. In addition, the cost of energy and other resources in the kingdom will together challenge the high growth rates of the last 40 years.
Changes in women's lives have combined to reduce the fertility rate in the kingdom. Women are getting married at a more advanced age than they have in the past 30 years. While no specific data is available, the author has observed that many married women are delaying pregnancy. As more women are educated and obtain higher degrees, they want to work; to do so, they will reduce the number of children they eventually have as well as delay the birth of the first child. The rising divorce rate among young couples may also contribute to lower fertility rates.
Water Consumption
The water situation in Saudi Arabia is one of most critical factors in energy consumption. The kingdom's water consumption per capita is the third highest in the world--350 liters/capita/day (SAMA 2011). This level of consumption far exceeds the capacity of natural aquifers. Demand for urban water consumption is increasingly met through the energy-intensive process of desalination. Most of the freshwater withdrawals today are from fossil aquifers and about 85% of water consumption occurs in agriculture.
Water consumption in the past 30 years in agriculture was driven largely by the "wheat subsidization program". In the past few years the kingdom has scaled back this program. Curtailment of the program led to an overall reduction of 4.8% of total water
consumption. Meanwhile, water consumption in the industrial sector rose by 2%. Industrial expansion and its water requirements are likely to continue to grow in the next 30 years.
Despite the aggressive reduction of the "wheat subsidization program" and the resulting water savings through food imports, the kingdom realizes the upcoming demands, and continues to invest in water desalination. The capacity of the Saline Water Conversion Corporation (SWCC) is currently at 3.2 million cubic meters/day. Another 1.7 million cubic meters/day are produced by privately owned plants. QNB Capital reports that, "there are plans to double the capacity by building ten new desalination plants in
2010-According to SWCC, the two methods currently used for water desalination in the kingdom are multi-stage flash distillation and reverse osmosis. The majority of the plants run the multi-stage flash process. Because this method requires a large amount of power to evaporate the water, desalinization is a major consumer of oil and gas. However, some amount of electricity is then recovered through co-generation via steam turbines.
I
Jordan DNA %e Al 4 tIDL*"K
ASIAA "LIUK SWMAI t- I[d.n Iraq Iran AJL ~JAIJI~ LISR '45A(JA ,QATAR U.A.E. Omnan MUMB RAFUM .*%AJRAN OkA8Figure 1.6 - National Saline Water Conversion Plants and Served Cities in Saudi Arabia' The table below shows the current capacity of all major water desalination plants in the kingdom:
1 Map does not include water desalination plants that are owned by the private sector
Company Name National Saline Water Conversion Corporation Jubail Water and Electricity
Co.
Shauibah Water and Elec. Co.
Tuhamah Power Co. Marafiq Co. (Yanbu) Alshaqeeq Water and Electricity Co.
Rabigh Arabia Water and Electricity Co.
Jubail Electricity Co. Shuaiba Expansion Project Bawarij International Co. Total Number of Plants 15 1 1 4 1 1 1 1 1 2 28 Electrical Generation Capacity (MWh) 5,120 2,942 1,191 1,083 1,038 1,020 481 250 13,125 Water Desalination Capacity (cubic meter / day) 3,246,950 805,464 888,000 95,760 216,000 172,042 150,000 52,000 5,626,216 Steam Production (ton/hour) 25,613 5,170 4,405 3,819 510 39,517 (ECRA 2010)
Table 1.2 - Water Desalination Plants in Saudi Arabia (status 2010)
The ministry of water and electricity (MOWE) is taking strategic steps through the National Water Corporation to raise the performance and efficiency level of water and sewage facilities through:
1. Reforming procedures on a national level to improve demand management;
2. Internal changes and restructuring procedures to establish advanced centers for client services and organizational structures;
3. Raising awareness of water consumption issues and encouraging wise use; and
4. Attracting investment, domestically and internationally. (SAMA 2011) The important element of awareness and rationalization of consumption will be discussed in later chapters.
Water consumption in the kingdom is the second highest among the major oil-exporting countries in the region in terms of the water used as a percentage of renewable
resources available. Figure 1.7 shows the severity of the water problem in the region in terms of consumption per capita. The demand gap will continue to increase if
consumption levels remain the same while the population continues to grow.
951% 798% 1600%
1814 270 624%
Omani
Bahraini
Saudi
Libyan
Qatari
Emirati
W/ater used as a perrflntaiie XX',,
Available renewable water
resources per capita per day
(Carboun 2011)
Figure 1.7 - Per Capita Water Consumption in Middle Eastern Oil Producing Countries
Remedies to the Energy Problem
To address these challenges, government officials in Saudi Arabia established the Saudi Energy Efficiency Center (SEEC) on October 31, 2010. The center is supervised by a committee of stakeholders that include the ministry of water and electricity, Saudi Aramco, the Saudi Electrical Company, the Ministry of Petroleum, the Electricity and Cogeneration Regulatory Authority, and many other stakeholders.
Most recently, the Center for Complex Engineering Systems (CCES) was established as a joint effort between MIT and King Abdulaziz City for Science and Technology (KACST) to
study multi-domain interactions in complex systems such as water, energy and
transportation. Also, the Ministry of Petroleum and Saudi Aramco have established the King Abdullah Petroleum Studies and Research Center (KAPSARC) to study solutions to the energy challenges.
With so many stakeholders and entities addressing the energy problem, one might
anticipate redundant studies and initiatives that would be prolonged and costly. SEEC is
working closely with all stakeholders and research centers to streamline efforts and reach the most optimal solution through the collaboration of all entities.
Study and research regarding the kingdom's energy problem are clustered in seven focus areas:
* Deployment of solar farms across the kingdom to reduce the amount of fossil fuels required for electrical generation;
" Wind power (the kingdom is considered to have below average wind speeds for power generation but it is a viable option in some local or regional areas) (Patlitzians et al. 2006)
" Use of future nuclear energy for electrical generation; * Energy conservation
* Greater reliance on efficient fuels for fossil power generation;
" Replacement of legacy power generation units with more efficient and environmentally friendly units; and
* Importation of natural gas from neighboring countries to support the electrical generation demand.
This thesis investigates the combined effects of some of these energy efficiency
measures on the KSA energy system, taking into account non-linearalities and coupling effects in the system.
Chapter 2: Electrical Consumption in Saudi Arabia
Current Situation
Currently fossil fuels are the sole source of electricity in Saudi Arabia. The kingdom relies exclusively on oil and gas to generate electricity and meet its demand. The types of fuel used by power generation plants are: natural gas, crude oil, diesel, and heavy fuel (HFO). The total maximum output of all types of fuel is around 40.4GW, of the four fuels used, natural gas has the highest efficiency and crude oil has the lowest as shown in Table 2.1.
Maximum Output Minimum Weighted Average
Type of Fuel (MW) Output (MW) Average Availability
Efficiency2 Natural Gas 19,512 5,441 30.8% 84.7% Heavy Fuel 10,620 3,416 33.0% 85.1% (HFO) Diesel 4,985 1,026 27.6% 85.1% Arab Light 5,250 1,268 28.6% 83.4% Crude Oil
(MOWE 2010), (KAPSARC and LAHMEYER International 2011)
Table 2.1 - Types of Fuel Used by Saudi Electrical Company for Electrical Generation in
Saudi Arabia3
Oil accounts for more than 50% of fuel used for power generation. The diagram below shows the growth of fuel consumption for electrical generation, and the proportions of gas and oil used.
250 200 t00 Gas sos 0 1990 2000 2009
Figure 2.1 - Fuel Consumption for Electricity in Saudi Arabia by Type
Figure 2.1 shows the sharp increase in fuel consumption over the past 20 years. The efficiency of thermal power plants increased from 27% in 1990 to 31% in 2009. This is mainly due to the increasing share of "gas-fired capacity", which was about 6.5% per year (Enerdata 2011). Figure 1.2 shows that fuel consumption in Saudi Arabia was ~220 TWh per year in 2009, this may seem low when compared to the total installed capacity from Table 2.2. This difference is due to seasonal demand and peak versus average power consumption, also more plants have come online since data was recorded in Figure 1.2.
The following map shows the distribution of the three types of electrical generation stations in the kingdom.
(SEC 2010) Figure 2.2 - Map of Electrical Generation Stations
Installed Capacity
The current installed capacity in the kingdom is around 55 GWh. The table below shows the number of stations in the kingdom and the capacity by generation entity. The Saudi
Electricity Company (SEC) provides 74% of the total capacity; the Saline Water Conversion Corporation (SWCC) is responsible for a capacity of 5,120 MW (~10%).
Generating Entity SEC
SWCC
Jubail Water & Elec. Co. Shauibah Water & Elec. Co. Tuhama Power Company Marafiq (Yanbu)
Shaqiq Water & Elec. Co. Saudi Aramco
Rabigh Arabian Water & Elec. Co. Saudi Cement Co.
Jubail Power Co. Total Number of Stations 49 15 1 1 4 1 1 6 1 2 1 82 Capacity (MW) 40,856 5,120 2,942 1,191 1,083 1,038 1,020 1,018 481 266 250 55,265
Table 2.2 - Electrical Generation Stations 2011
Saudi Arabia's Water and Electricity Ministry estimates that the country will require up to 20,000 MW of additional power-generating capacity by 2015. Current data indicate that electricity demand in the country is growing at the rate of 6% per annum (MOWE). In 2010, the increase in the generation and consumption resulted in an increase of peak load by 11.7% (reaching 45,661 megawatts) from the previous year. Actual power generation capacity grew by 5.2% (SAMA). The sharp increase in peak loads has caused troublesome power cuts. In 2006, in the central and western provinces, such
occurrences resulted in major losses for industries in that region (GIH Saudi Electrical Company 2006). This is a scenario that government officials want to eliminate in the future.
Consumption by Sector
In 2011, total estimated electricity consumption in the kingdom was 212,262.6 GWh, which is consistent with Figure 2.1. The geographic breakdown was: 31% for the
eastern region; 30.7% for the western region; 30% for the central region; and 8.3% for the southern region (SAMA 2011). The overall increase over the previous year was
9.7%.
Consumption sectors include residential, industrial, commercial, government, and other sectors (hospitals, streets, mosques, schools). The highest consumption was in the residential sector--51.2% of the total consumption.
Sector Residential 13.40% Commercial Government -Industrial Others
Figure 2.3 - Relative Electrical Consumption by Sector (2011)
Electricity Waste Streams
Saudi Arabia is located in a hot region with average summer temperatures of 81*-109* F in non-coastal or inland areas, and 80* -100* F in coastal areas. Air conditioning accounts
for 35% of the total electrical consumption in the kingdom.
Figure 2.4 represents about 70% of the 51.2% of residential electricity consumption (ECRA 2010). At present the sun is driving major energy consumption rather than serving as a major source of energy through photovoltaics and other means such as rooftop heaters.
Government industrial Others Commercial AAir Conditioning Other Residential
Figure 2.4 - Residential Electrical Consumption (2011)
In addition to air conditioning, other appliances in the household use a major portion of electrical consumption. Water heating is another source. Although we were not able to find statistical data about water heaters and their consumption, electrically operated
water heaters in the kingdom often run continuously in households during the short winter period.
While home appliances are necessary, the extremely wasteful Saudi consumer behavior is a significant contributor to the kingdom's energy problem. Based on personal
observations as a resident and a citizen of Saudi Arabia, the author has noted several behaviors that involve needless energy use:
e Over lighting of houses, shops, and restaurants;
e Overuse of street lighting and unnecessary use of lighting on roads between
towns and cities;
e Home air conditioners running at full capacity 24 hours a day, seven days a week,
e Lights kept on in unused rooms during evening hours (residential);
e Office lights kept on overnight, with little utilization of dimmer or automatic shut
off functions;
* Lack of heat insulation in old buildings;
* Overuse of windows and open spaces in newer houses and buildings, which dictates air-cooling for the whole building rather than portions of it;
* Commercial shop closings between noon and late afternoon, then remaining open until late hours of the night4.
The overall Saudi Arabian culture of utilizing evening hours for all kinds of activities, shopping, social gatherings, running errands, etc., drives excessive electrical
consumption.
The Price of Electricity
The government heavily subsidizes oil and gas for electrical generation. In February 2012, the governor of the Electricity and Cogeneration Regulatory Authority (ECRA), Dr. Abdullah Alshehry, revealed that the government sells a barrel of oil to the Saudi Electricity Co. (SEC) for $2, while a barrel sold in the international market was close to
$100 (Argaam )5
Commercial and private customers in the kingdom are charged $0.04/kWh of electricity, approximately 90% less than "internationally applicable market prices". The electricity
tariff for the commercial and private customers has been the same since 2000 (Argaam 2012), while the tariff for the industrial and government customers was adjusted in 2010. According to KAPSARC and LAHMEYER International, "Such adaptations are determined by the Ministry of Petroleum and Minerals to account for any declines in oil exports" (KAPSARC and LAHMEYER International 2011). The heavy subsidization of electricity prices is a main contributor to the consumption problem in the kingdom. Since electricity is cheap and subsidized, consumers do not feel a direct financial
incentive to use electricity judiciously. It has been shown in other settings that once commodities become scarce and their true price is reflected, consumer behaviors change quickly.
However, it is part of the Saudi government's welfare policy and culture to provide cheap and abundant electricity as a way to implicitly share the country's oil-generated wealth with the population at large. This fundamental tension is at the root of the problem of higher than average per capita energy consumption. How can consumer behaviors be changed without radically increasing electricity prices; an action that could lead to reduced economic growth and potential civil unrest?
Electrical Generation Efficiency
End user efficiency: The government is turning some attention to reducing electrical
consumption through increased efficiency for all electrical devices, from the smallest house appliances to street lighting. A great deal of savings can be realized through implementing policies on imports of electrical equipment. Through a minimal tariff on
inefficient imports, combined savings can be immense for a population of more than 27 million people. An example will be shown quantitatively in Chapter 4.
End user efficiency: As generation units in power plants become outdated and are due
for replacement, the updates to cleaner and more efficient generators can also contribute to fuel savings.
Summary
In Chapter 2, we presented information about electrical generation and demand, challenges and consumption trends that contribute to the energy crisis in the kingdom. These will be used below to model the electrical consumption. Potential conservation
through efficiency and user awareness is highlighted in Chapter 4. Recommendations regarding electrical consumption are made in chapter 7.
Chapter 3: Analyzing the Energy Challenge in Saudi Arabia Using
System Dynamics (Building the Model)
Thesis Methodology - The System Dynamics Approach
In an attempt to analyze the energy challenge in Saudi Arabia with a focus on electrical consumption, this study investigates the issue through causal loop thinking based on a system dynamics model. A holistic view model of the electrical consumption issue will be discussed in detail in this chapter. The model will quantify the energy dynamics for the kingdom as a whole in the aggregate and will not focus on regional or local
differences. A more detailed spatial analysis of energy system dynamics is left for future work.
The energy problem in Saudi Arabia did not arise only in the last few years; the
government has been aware of it for several decades and has been slowly taking steps to address the issue. Many reports and analyses have been conducted and are currently
being done as mentioned above. System dynamics is a powerful method that connects a matrix of variables through causal relationships (Forrester 1969; Sterman 2000) . No one method can provide a comprehensive understanding of the problem, but system dynamics can provide a perspective of special use in the decision-making process.
Since Jay Forrester founded the field of system dynamics in 1957, it has been applied to an array of complex problems in business, politics, and social sciences. The field
continues to grow as the method is applied to different areas including medical, technical, and cross-domain applications.
Although system dynamics requires some assumptions, the application of sensitivity analysis and the adjustment of variables and equations can assist in building a model that reflects reality through careful calibration and can be validated through simulations and comparisons with other models and data. For the purpose of this thesis, a more holistic approach was considered, covering social, technical, political, and economic relationships to best represent the implications of different energy policies and decisions.
In this chapter, the steps in building the model are detailed along with the assumptions on constructing the feedback loops. Based on literature research, workshops, interviews with stakeholders, and collaboration with other researches, a list of variables, stocks, and flow rates have been identified. A causal relationship diagram was then mapped based on the data gathered. The qualitative validity of the diagram was then tested and analyzed; finally, the mapped loops were labeled as either balancing (negative) or reinforcing (positive loops). At this point, the mathematical equations to complement the causal relationships were further developed in the model. Through an iterative process, the causalities and mathematical relationships were refined to prepare the model for full simulation.
Purpose of the Model
The purpose of this model is to simulate the flow of fossil (non-renewable) and alternative energy to supply electrical generation to the demand side, and to
demonstrate a range of potential future impacts on GDP, energy intensity, and domestic
6
oil consumption in Saudi Arabia during the period 2011-2046 . In addition, it
investigates how the system reacts to different scenarios in energy policy (alternatives, conservation). The model will provide policy makers with improved insight regarding energy policies and their impacts through the causal loop analysis. The model was built based on the most recent data available from various sources for the 2010-2011 period.
System Dynamics vs. Open-Loop Thinking
"Much of the art of system dynamics modeling is discovering and representing the feedback processes, which along with stock and flow structures, time delays, and
nonlinearities, determine the dynamics of a system." (Sterman 2000)
As highlighted in Chapter 1, many reports and analyses have been conducted regarding the energy challenge in Saudi Arabia. However, most of the work has used "open loop thinking". These generally use a linear approach - extrapolating past trends - which can be criticized for being one directional, only useful for narrow purposes, not covering side effects, and triggering policy resistance for not offering insights into intended and
unintended consequences of future actions.
6 Most energy outlook reports forecast for 30 years; beyond this period, prediction becomes less
In the first chapter of Systems Thinking and Modeling for a Complex World (2000), John Sterman discusses the following points regarding the open-loop approach to complex analysis:
" The solutions that were implemented in the past become the problems that we
are trying to solve today. "Yesterday's solution becomes today's problem" - Not having full understanding and perspective of all feedbacks in a system is the
main reason for policy resistance, actions taken alter the system, which creates reactions from other parties to correct the balance, then more reactions take place.
* Decisions, actions, or solutions taken within a system may eventually create a ripple effect that could result in negative and unintended consequences, hence resulting in ineffective policies.
- The interaction between "balancing" and "reinforcing" forces is what makes a system dynamic. Reinforcing loops tend to generate expansion or growth, while balancing loops are self-correcting and opposing change.
e "People generally adopt an event-based, open-loop view of causality, ignore
feedback processes, fail to appreciate time delays between action and response and in the reporting of information, do not understand stocks and flows and are insensitive to nonlinearities that may alter the strength of different feedback loops as a system evolves."
The points highlighted are the basis for a solid argument on why system dynamics is potentially an effective tool to analyze the energy challenges in Saudi Arabia. The approach can be applied to an array of complex systems concerning energy security in the kingdom.
Decision makers often assume that human behavior is purposeful, with most decisions motivated by logic based on information (Sterman 2000). If such were entirely the case it might be argued that the problem is clear and the solution is intuitive--diversifying energy sources, conservation, and efficiency policies are the answer. However, the complex energy system of the kingdom might well include "unknowable unknowns". System dynamics is one way to test for such unknowns through feedback loop analysis.
System Dynamics Model-Building Process
The system dynamics Model-Building Process requires five steps:
1. Problem Articulation (Boundary Mapping): In this step, the problem statement
and dynamic hypothesis are identified. The model boundaries are set, including the time horizon of the model and the variables needed based on reference modes to describe the behavior of the system.
2. Mapping: Causal relationships between variables, stocks, and flows are established and mapped at this stage.
3. Formulation: Based on the causalities of mapped variables, the nature of loops
balancing loops. In addition, mathematical equations are written to facilitate and instantiate the model simulation.
4. Testing: In this step the data introduced in the exogenous variables and stocks are initialized. The model is then checked for unit consistencies and syntax errors. A few initial simulations take place, followed by model calibration and initial validation. In this thesis the model should not only be able to predict the future behavior of the system from 2012-2040, but also replicate its past behavior.
5. Policy Formulation and Evaluation: Following the testing and initial simulation,
the model is cross-validated with reference modes. Once the model works effectively, sensitivity analysis can be applied and different future scenarios simulated by applying different values for exogenous variables and monitoring change.
A Systems Approach to Energy Diversification
Literature search and extensive data analysis suggested that building a system dynamics model for the energy system in Saudi Arabia would involve a high level of complexity. Therefore, model boundaries and limitations were drawn to create a simple model that would serve the purpose of this thesis by adopting a holistic systems approach.
To begin, a clear problem was identified. This problem is embodied in the following two research questions:
1. What are the steps that need to be taken in order to address the unsustainably
increasing primary domestic energy usage in the kingdom?
2. How could policy actions (through conservation and/or the introduction of
alternative energy) influence the domestic consumption offossilfuels for electrical generation?
Early attempts to simulate the current situation in the kingdom have proven to be extremely complex. The challenge of obtaining recent, accurate, and consistent data has also been difficult since most of the data resides with the individual stakeholders and the channels of communication and collaboration with the Center of Complex Engineering Systems7 (CCES) are still maturing. The center is presently in its first year of
operation.
Model Building
"There is an assumption that expensive sponsorship must precede an effort to address important issues. However, if the objective is sufficiently clear, a rather powerful small model can be created, and the insights sharply focused. Often, the consequences of such a book will be so dramatic and controversial that few financial sponsors are willing to be drawn into the fray. However, the task can lie within the resources of an individual. Where are the people who can carry system dynamics to the public?"
(Forrester, 2007 p. 362) Based on Forrester's recommendation, the model for this study was built to capture the effect of increasing domestic electrical consumption levels on domestic oil consumption
CCES is collaboration between KACST and MIT to address an array of complex systems problems arising
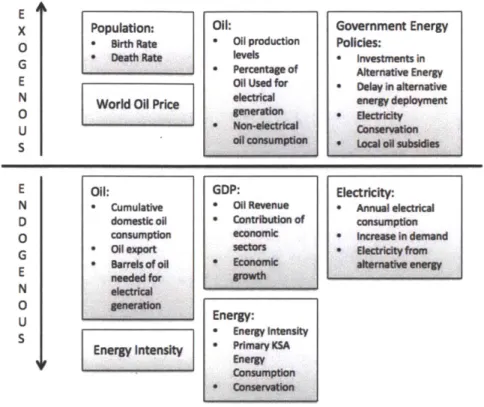
in Saudi Arabia, and consequently its effect on oil exports and GDP. Based on the reference modes of step one of the model-building process, model variables were identified based on model boundaries.
Population:
* Bi tRate
e Death Rate
World Oil Price
Oil:
* Oil production levels " Percentage of
Oil Used for electrical genenation * Nmoli ol consumtion Government Energy Policies: e Investments in Alternative Energy . Dela in alternative energy deployrent e Decotricit Conarvation - Local ol..subi~e Oil: e Cumulative domestIc ol consumption - Oilexport * Barrelsofoll needed for eltrical generation Energy Intensity GDP: e Oil Revenue * ContrIbution of economic Sectors * Economic growth Electricity: " Annual electrical consumption * Increase in demand * Nctriityfrom altarnativ energy
Figure 3.1 -Summary of KSA Energy System Dynamics Model Boundaries Following the second step of the model building process, variable, stocks, and flows were mapped. The result was the following set of two main loops.
j E X 0 G E N 0 U s E N D 0 G E N 0 U s
Non-electrical
Oil export oil cons.
Cumulative domest oil
Oil Revenue consumption
Barrels needed for
GDP alactricitrBOEI
+
Annual electrical consumption Population
Figure 3.2 - Balancing Loop of Oil Consumption for Electricity
Oil Re
investmr
auternat
Non-electrical
Oil export oil cons.
Cumulative
domest oil
venue consumption
R
ent in Barrels needed forelectrllt(BOIE)
Wv eWeVy
Barrels of oil Alternative energy replaced (BOE)
elec. capacit
Figure 3.3 - Reinforcing Feedback Loop for Alternative Energy Oil Replacement
Explanation of the Main Causal Loops
Figure 3.2 captures the relationship between oil revenue from exports and domestic oil consumption. Domestic electrical consumption drives cumulative oil consumption in the
kingdom. Based on the explanations in Chapter 1, electrical consumption in 2011 comprised about 65% of total domestic oil consumption. The amount of domestic oil consumption subtracted from overall production levels, determines the quantity of oil that can be exported. Oil revenue from abroad is the main driver of the Saudi economy, accounting for more than 65% of the GDP. The energy consumed in the kingdom is in turn influenced by GDP. For the purposes of this model, the impact of GDP on electricity consumption levels is calculated using a regression equation based on statistical and
historical data from the World Bank, the Saudi Arabian Monetary Authority, and the US Energy Information Administration. The higher the level of economic activity, the higher the GDP, the more energy will be consumed domestically.
The value of a barrel of oil equivalent (BOE) needed for electricity generation is
calculated based on the amount of electrical energy, expressed in units of kWh that can be generated from a single barrel of oil:
1 Barrel of oil = 5.8 million British thermal units (BTU) (Investopedia; EIA).
Also through regression, the amount of BOE needed for electrical generation is
converted into real barrels. This amount is added to the non-electrical oil consumption before calculating the available oil export levels based on the production levels at the time. This is a "balancing" loop because the system is trying to correct and balance itself. An increase in oil export produces an increase in oil revenue, leading to an increase in GDP and then increased electrical consumption. More electricity consumed
export assuming constant levels of production. Note that oil production levels have been near constant for the last 30 years just below 10 million barrels per day. The causal arrow between cumulative oil consumption and oil exports has a negative
polarity, thus balancing the loop.
Figure 3.3 shows the reinforcing nature of introducing another source of energy to support domestic electrical consumption. This loop shares a few variables with the first
loop. However, in this scenario, part of oil revenue from export is invested in alternative energy sources (such as solar, nuclear, etc.). The introduction of an alternative source of energy affects the number of real barrels of oil needed to meet domestic demand. An
increase in alternative energy for electrical generation means that fewer barrels of real oil are needed because alternative energy substitutes for the burning of fossil fuels (see Table 2.1) to produce the required electricity. This loop shows a reinforcement of growth since domestic oil consumption savings enables more export and higher oil
revenues, which in turn can be invested in more alternative energy or other domestic infrastructure projects, including the creation of new economic sectors that will contribute to the GDP, without depending directly on oil.
Figure 3.4 shows the combined diagram of the two interacting loops discussed above. These two interacting loops are at the core of the KSA energy dynamics. In addition, the diagram includes causal relationships to represent the effect of population growth on
non-electrical oil consumption, and the effect of oil revenue on other economic sectors, and subsequently its effect on GDP.
Oil export
Non-electrical
Oil Revenue oil cons.
Cumulative
iR domest oil
Ecors GDP + consumption
invetmnt in Oil Replacement <Population>
GDP Alternative
energy ca
Barrels of oil Barrels of oil
Oil for Elect. replaced (BOE) needed (BOE)
Population Annual elec.
~-~! cons.
Figure 3.4 - Aggregate Energy Dynamics Causal Loop Diagram8
Variables Used in Modeling Energy
Different variables were implemented in the system dynamics model, including
exogenous variables, stocks, and flows. Figure 3.4 shows the main endogenous variables of the model, stocks and other exogenous variables were omitted from Figure 3.4 but are shown in detail in Chapter 6. Table 6.1 lists a short description for the variables used in the detailed model.
Main Drivers of Energy Consumption
As discussed in Chapter 1, population growth, and diversification and growth of
economic sectors are the main drivers of the increased electrical consumption in Saudi Arabia. To capture these two separate yet related effects, the population effect on
electrical consumption is shown in Figure 3.4 above in the lower left corner. The growth of non-oil economic sectors (including industrial expansion) also affects GDP; this
growth is partially influenced by oil revenue as well as its own growth. The specific basis of the mathematical relationship is discussed in detail below.
Oil Revenue and Economic Sector Growth in Relation to GDP
In Figure 3.2, finding a mathematical equation that would best represent the
relationship between Oil Revenue and GPD, and Oil Revenue and Economic Sectors and their contribution to GDP was one of the most challenging steps in building the model. This relationship can be fairly complex for a major oil- and gas- producing country like Saudi Arabia. In fact, many system dynamics models might be built to represent that relationship in detail. However, to capture the contributions of oil and non-oil economic sectors to GDP for the purposes of this model, further investigation had to be done to better understand the relationship and find simple yet adequate equations that would fit the purpose of this model.
The reliance of Saudi Arabia on oil revenue from exports as a major contributor to its GDP is not surprising, however as a result the kingdom has undergone cycles of
economic booms due to high oil prices and global demand for energy. Over the past 30 years, Saudi Arabia and other Middle Eastern oil-producing countries have increased the
competitiveness of their non-oil sector in an effort to dampen the effect of down cycles of oil prices. The eventual goal is for the economic sectors that do not directly depend on oil exports to become diversified and resilient in the face of fluctuating world crude oil prices. According to Jadwa Investment, the global demand for fossil fuels as a source of energy may gradually and slightly drop as countries rely more on renewables and
become more efficient (Jadwa 2011).
If we compare the labor market and the role of the states in the economy in GCC
countries, including KSA, now to the situation 30 years ago, we observe a dramatic increase in economic reform programs, stability of funds, and a higher degree of economic integration within countries in the region. In fact, the financial markets in Gulf Cooperation Council (GCC) countries are now deeper and better integrated into the world system than they were in the late '70s and early '80s with the first major oil booms (AI-Moneef 2006). These factors support the growth and sustainability of the non-oil sector in oil-producing countries, both major and minor.
Dr. Majid AI-Moneef, former Governor of Saudi Arabia to OPEC explained that the contribution of the oil sector to economies takes place through five linkages:
1. Fiscal Linkages: Linkages relating to macroeconomic and monetary policies
involve the allocation of oil revenue through government expenditure to
competing needs. For example, during the period 1985-1999, some oil-producing countries initiated various measures towards economic reform. Dr. Al-Moneef
enterprises and activities, diversifying the government revenue base through fees, establishing the oil stabilization funds, adopting conservative oil price assumptions in planning government expenditures, reducing government subsidies, and reforming energy prices to reflect marginal costs."
2. Forward Linkages: "The actual physical output from the oil and gas sectors that feeds into the economy includes the input of oil into the refining industry, and the input of gas into feed stocks for the petrochemical industry, as well as the input of oil and gas into the electricity production", with which we are mainly concerned with in the model developed in this thesis.
3. Backward Linkages: This refers to the services provided to the petroleum
industry by the domestic sector. Obviously such service providers would be directly affected by any decline in oil prices and demand.
4. Consumption Linkages: This linkage was represented in the causal loop diagram
shown in Figure 3.2, regarding the impact of oil income on the country's
economy. Under this linkage, a common phenomenon referred to as the "Dutch Disease" 9 may occur. An economy rich in natural resources and spending
excessively is more susceptible to a situation in which manufactured goods become less internationally competitive and exports of manufactured goods decrease. It is common for non-oil exports to increase during periods of low oil
9 The term "Dutch disease" originates from a crisis in the Netherlands in the 1960s that resulted from
discoveries of vast natural gas deposits in the North Sea. The newfound wealth caused the Dutch guilder to rise, making exports of all non-oil products less competitive on the world market. ("Dutch disease" Investopedia)
prices, while imports decrease as the government spends more conservatively during the same period.
5. Socio-Political: This linkage is concerned with the impact of oil wealth on the
political system and its consequent effect on the economy.
(Al-Moneef 2006) Figure 3.5 shows the linkages between world oil price, oil revenue, GDP, and economic growth.
World Oil Price
Oil Revenue n e
+ contribution of Oconomoc Economic growth sectors
GDP
Figure 3.5 - The Role of Oil Revenue in GDP Evolution and Economic Growth To best express the relationship in this part of the model, the effects of the "Dutch Disease" were considered and the following assumptions were made:
Tabe 31 -Oil revenue contribution to D.ecnae'
O0 Temelue Oil that so contribution to revenue Economic sectors self
thethe u growth of economic
sectors
> 25% of GDP 2.6% 2.9%
< 25% of GDP 0% 3.5%
0% (no contribution) *0 0% -1.1%
Table 3.1 - Oil Revenue Contribution to GDP Percentages"
GDP in Relation to Change in Electrical Consumption Level
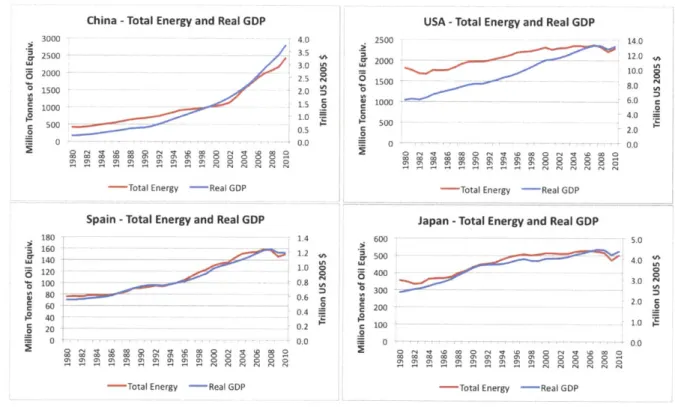
Diagram 3.2 shows a causal relationship between GPD and Annual Electrical Consumption. There is clearly a causal relationship between GDP and energy consumption on a national level; however, there are many arguments over the accuracy, scale, and coupling of these two variables. Some may argue that the relationship between GDP and Primary Energy Consumption maybe decoupled in response to efficiency, energy price volatility, the price of renewables, etc. However, Figures 3.6 and 3.7 show that, in fact, global GDP and total aggregate Energy
Consumption are becoming tightly correlated.
World - Total Energy and Real GDP
14000 60.0 - 12000 50.0 UJ L 10000 40.0 V6 8000 o 30.0 m W 6000 r £ 20.0 .2 C 4000 C 2000 10.0 S 0 0.0 00 (N q* %D 00 0 (i t %D 00 0 (N(7W r- r- - - -4 v- r- - 4 -4 v- 4 r4 " N N r4 N fN
Total Energy - Real GDP
Figure 3.6 - Global Energy Consumption and Real GDP (Tverberg 2011)
Energy consumption indicators in any given country maybe altered if energy-intensive industries are offshored to other countries and the contribution of less energy intensive
1 The percentages in this table were derived from Jadwa's assumptions about non-oil revenue: if there is no change in tax policy and no new policies are adopted to raise non-oil revenues, we project that non-oil revenue will grow by 8% per year. This was the average annual growth rate between 2001 and 2010.)