HAL Id: hal-02666903
https://hal.inrae.fr/hal-02666903
Submitted on 31 May 2020
HAL is a multi-disciplinary open access
archive for the deposit and dissemination of
sci-entific research documents, whether they are
pub-lished or not. The documents may come from
teaching and research institutions in France or
abroad, or from public or private research centers.
L’archive ouverte pluridisciplinaire HAL, est
destinée au dépôt et à la diffusion de documents
scientifiques de niveau recherche, publiés ou non,
émanant des établissements d’enseignement et de
recherche français ou étrangers, des laboratoires
publics ou privés.
Geography, Plants, and Growing Systems Shape the
Genetic Structure of Tunisian Botrytis cinerea
Populations
S. Karchani-Balma, Angelique Gautier, A. Raies, Elisabeth Fournier
To cite this version:
S. Karchani-Balma, Angelique Gautier, A. Raies, Elisabeth Fournier. Geography, Plants, and
Grow-ing Systems Shape the Genetic Structure of Tunisian Botrytis cinerea Populations. Phytopathology,
American Phytopathological Society, 2008, 98 (12), pp.1271-1279. �10.1094/PHYTO-98-12-1271�.
�hal-02666903�
Population Biology
Geography, Plants, and Growing Systems Shape the Genetic Structure
of Tunisian Botrytis cinerea Populations
S. Karchani-Balma, A. Gautier, A. Raies, and E. Fournier
First and third authors: Laboratoire des Microorganismes et Biomolécules Actives, Faculté des Sciences de Tunis, Campus Universitaire, 2092 MANAR II, Tunisie; second author: UMR BIOGER-CPP, Route de Saint-Cyr, F-78026 Versailles cedex, France; and fourth author: UMR BGPI, TA A 54/K, Campus International de Baillarguet, F-34398 Montpellier cedex 5, France. First and fourth authors have contributed equally to this work.
Accepted for publication 27 July 2008.
ABSTRACT Karchani-Balma, S., Gautier, A., Raies, A., and Fournier, E. 2008. Geography, plants, and growing systems shape the genetic structure of Tunisian Botrytis cinerea populations. Phytopathology 98:1271-1279.
Botrytis cinerea, considered for a long time as a generalist fungal pathogen of a multitude of plants, was recently shown to exhibit signifi-cant population structure in France according to the host, suggesting sympatric specialization. Recent models also showed that adaptation to new hosts may facilitate the process of sympatric speciation in fungal plant pathogens. The present work aimed at investigating if host plants, combined with geographic origin and growing systems, shape the diver-sity and structure of Tunisian populations of B. cinerea. We genotyped 153 isolates with 9 microsatellites. In all the investigated populations, the
fungus reproduced mainly sexually. Gene flow was significantly reduced between greenhouses and open fields from strawberry but not from grape-vine. Populations from tomatoes, sampled under greenhouses only, exhibited a low genotypic diversity. The effects of plant and geography from open fields were investigated on a sample of 74 isolates. Six populations were inferred, mainly structured according to a geographic barrier corresponding to the Grande Dorsale Mountain. However, this effect could not be separated from the host plant origin of isolates. The analysis of 63 isolates recovered from strawberries and faba beans in the Cap Bon and Centre regions did not reveal any significant effect of plant on pathogen population differentiation.
Additional keyword: parasite.
The adaptive potential of a species conditions their response to selective pressures, hence their evolutionary trajectories. Fungal plant pathogens show numerous cases of adaptive evolution (e.g., plant resistance breakdowns, host jumps, or evolution of resis-tance to antifungal compounds) (34). Deciphering the adaptive potential of economically damaging phytopathogenic fungi is then crucial to set up durable resistance strategies. The adaptive potential depends on several processes, among which are con-temporary gene flow and reproductive mode. Both processes may be shaped by different factors, such as landscape structure and geographic distance, host plant species, and host plant growing system. In the present study, we were interested in describing these two processes and examining the main factors explaining them in the plant pathogenic fungus Botrytis cinerea.
B. cinerea Pers.: Fr. (teleomorph Botryotinia fuckeliana [de
Bary] Whetzel) is a haploid, heterothallic Ascomycete. It causes gray mold on more than 200 Eudicotyledon species (43), among which many cultivated and ornamental crops, being responsible for serious economic losses in pre- and postharvest. This fungus exhibits a great morphological, physiological, and genetic variability (5,8,14,16,19,30,48). Its life cycle is divided in a saprophytic and a parasitic phase, to which various pathogenicity factors are associated (9,45). Several studies reported a gradual decrease of the efficiency of some fungicides in the field (12,23,27,40).
Phenotypic variability was attributed to parasexuality (6,46). At the genetic level B. cinerea has been considered a clonal species
for a long time, due to the great production of conidia and the scarcity of sexual structures observed in natural conditions. This view, however, was totally revised during the last decade. For instance, several molecular studies using random amplified polymorphism DNA (RAPD) (35,38,44), or restriction fragment length polymorphism (RFLP), and transposable elements (19) showed a great genetic variability and a lack of linkage disequi-librium compatible with the existence of genetic recombination probably due to regular sexual reproduction, at least for France, Spain, Italy, and Chile (3,5,19,36).
Recent studies based on multiple gene genealogies (2,14,16) showed that B. cinerea was in fact a complex of at least two sibling species, called B. cinerea groups I and II, that diverged without any remnant gene flow since at least 107 generations. The species B. cinerea group I exhibits restricted host and geographic ranges, while the species B. cinerea group II remains the most widespread and damaging species on grapevine and other hosts at harvest (14,31). Within B. cinerea group II, isolates have been distinguished according to the presence or absence of trans-posable elements (TE) in their genome, transposa isolates carry-ing the two TE Boty and Flipper, and vacuma isolates carrycarry-ing none (19). However, no reduction of gene flow was observed between vacuma and transposa isolates (13). The species B.
cinerea group I includes only vacuma isolates (14).
Is the species B. cinerea group II panmictic or are there impor-tant barriers to gene flow, structuring its genetic variability and its reproductive mode, hence its adaptive potential? Besides the geographic origin of isolates, the host plant on which isolates are developing is an important factor that may shape fungal pathogen genetic structure. Indeed, parasites and their hosts are continually evolving in response to each other (24), and different host species exert strong disruptive selection. Giraud et al. (20) used a theo-retical approach to show that, because of their life cycle,
speciali-Corresponding author: E. Fournier
E-mail address: Elisabeth.Fournier@supagro.inra.fr
doi:10.1094 / PHYTO-98-12-1271
zation of a fungal pathogen on different plants would be sufficient alone to allow both adaptation to the host plant and reproductive isolation, thus facilitating sympatric speciation.Several studies of
B. cinerea (sensu lato) on various host plants showed very weak
geographic differentiation, if any, agreeing with large scale dispersal of asexual spores (5,19,36). Muñoz et al. (36) reported a significant genetic differentiation between grapevine and tomato isolates in Chile, and similar results were obtained in the Cham-pagne region of France for B. cinerea on numerous plants (18). However, these studies did not distinguish between B. cinerea groups I and II, which may have biased the results. More recently, a significant genetic structure was found within B. cinerea group II according to two natural host plants, grapevine and bramble, using microsatellite markers (13). This raises the question of the generality of such a host plant effect, according to other plants and other parts of the world.
Another factor that may have an important effect on pathogen population structure is the cropping system for the considered host plant, especially open field versus greenhouses growing systems. Indeed, greenhouses may exhibit very particular popula-tion resulting from bottleneck effects due to restricted migrapopula-tions from outer areas. Several works have studied the epidemiology and disease installation and progression within and between different greenhouses (3,10,22,39), but to our knowledge no study
has ever compared closed systems to open field conditions. Moreover, due to the preference of B. cinerea for wet conditions, the questions of the respective roles of geography, host plant, and cultural modes in the differentiation of B. cinerea group II populations have not been addressed to date in dry Mediterranean areas, where B. cinerea is yet also an important problem on many cultivated plants.
The aim of the present work was, therefore, to study the genetic variability, mode of reproduction, and differentiation according to host, geography, and growing system, in several populations of B.
cinerea group II from Tunisia, using nine polymorphic
micro-satellite markers (15). We specifically addressed the following questions. (i) Does the growing system influence the genetic structure of B. cinerea group II populations? (ii) In open field systems, are the B. cinerea group II populations genetically differentiated as a function of geography and host plants?
MATERIALS AND METHODS
Fungal sampling and isolation. A total of 169 B. cinerea
isolates were collected from April to September 2004, in four different Tunisian areas (Cap Bon, Nord, Grand Tunis, and Centre; Fig. 1) from four different host plants: faba bean (Vicia
fabae), grapevine (Vitis vinifera), tomato (Lycopersicum esculen-tum), and strawberry (Fragaria × ananassa varieties). Isolates
from faba bean were sampled exclusively in open field systems, isolates from tomato were sampled exclusively under green-houses, whereas both growing systems were sampled for isolates from grapevine and strawberry (Table 1). Within a particular region, sample places were not more distant than 40 km, except the town of Bou Salem that was 130 km away from Mateur in the Nord region. Isolations were performed from decaying fruits on strawberry, from chocolate spots on faba bean leaves, and from sporulated lesions on stems and peduncles on tomato and grape-vine. Small tissue pieces taken from lesions were incubated at 20°C during 5 to 10 days in petri dishes on potato dextrose agar (PDA) amended after autoclaving with 0.5 g/liter of streptomycin (Sigma-Aldrich) resuspended in 0.5% ethanol. Growing my-celium was transferred and isolates were genetically purified by monospore isolation and conserved on NY medium plates (20 g of malt, 2 g of yeast extract, and 20 g per liter of agar) at 4°C as well as spore suspensions in 20% glycerol at –80°C for long-term preservation.
DNA extraction and microsatellite genotyping. DNA
tions were performed using the QIAGEN Biorobot 3000 extrac-tion kit from 5-day-old mycelial cultures grown on NY medium at 22°C. Biological material was first grinded in 25 µl of QIAGEN lysis buffer with tungsten microballs. DNA quality was checked by electrophoresis on 0.8% agarose gel. For each isolate, we amplified separately nine microsatellite markers previously devel-oped by Fournier et al. (15), with forward fluorescence-labeled primers, and following author’s polymerase chain reaction (PCR)
Fig. 1. Location of Botrytis cinerea sampling sites in Tunisia. St: strawberry;
Gr: grapevine; To: tomato; and Be: bean. Populations from Nord are designated by circles, Grand Tunis by squares, Cap Bon by hexagons, and Centre by crosses.
TABLE 1. Number of Botrytis cinerea isolates entirely genotyped from the different regions of Tunisia, the different host plants, and the different growing systems
Nord Grand Tunis Cap Bon Centre
Host GRa OP GR OP GR OP GR OP Tomato 3 35b Grapevine 9b,c 22b,c Strawberry 2 33b 24b,c 6b,c Bean 1 2 13b,c Others 1 2
aGR: greenhouse, and OP: open field.
bPopulations further used for the analysis of the effect of growing system. cPopulations further used for the analysis of the effects of plant and
conditions. PCR products were analyzed using a CEQ8000 DNA sequencer (Beckman Coulter, Fullerton, CA), with allele sizing and grouping manually performed by visual inspection of chro-matograms. After isolation, purification, removal of group I isolates, DNA extraction, and genotyping process, a total of 153 out of the 169 isolates were finally available (complete geno-types) for subsequent analyses (Table 1).
Distinction between B. cinerea groups I and II isolates.
According to Fournier et al. (15), isolates from B. cinerea group I exhibit at least one private allele at four of the nine microsatellite markers. Further population studies (13, A.-S. Walker, personal
communication) showed that the allele sizing 86-bp at locus Bc6
was diagnostic for B. cinerea group I. In the present study, none of the isolates genotyped carried this private allele, demonstrating that the whole sample belonged to the species B. cinerea group II. This result was further confirmed by a test of resistance to the fenhexamid fungicide (Teldor WG50, Bayer, Monheim, Ger-many), following the protocol of Albertini et al. (2). None of the isolates of the present study was phenotyped as HydR1, which corresponds to the high natural level of resistance exhibited only by B. cinerea group I representatives (2).
Population genetics analyses. The software Genetix 4.05 (K.
Belkhir, P. Borsa, L. Chikhi, N. Raufaste, and F. Bonhomme, 1996) was used to compute unbiased genic diversity, Hnb (37), which is based on allele frequencies, and allelic richness over all loci in the total sample and in each population (i.e., for each region, host plant, and growing system combination) (Table 1). Genetix was also used to perform 2D-factorial correspondence analyses, allowing examining visually the distribution of the different multilocus genotypes in a two-dimensional space whose principal axes are linear combinations of different alleles at different loci. Lastly, we used Genetix to calculate pairwise Weir and Cockerham’s (47) FST values between all pairs of populations, and to evaluate their significance by random permutations and progressive Bonferroni correction as described by Rice (41).
We used the program Multilocus 1.3b (1) to plot the genotypic diversity calculated from multilocus genotype frequencies (37) versus the number of loci, in order to see whether the nine microsatellites used in this study were sufficient to recover the maximal genotypic diversity, or whether it would be necessary to score more loci. The program randomly samples 100 times from 1 to m-1 loci (m being the total number of loci) from the data set and calculate the number of different genotypes and the genotypic diversity for each randomly shuffled data set. The m micro-satellites are considered to be discriminating and powerful enough if the genotypic diversity recovered for 1 to m – 1 loci reaches a plateau, that is, if increasing the number of scored loci does not increase the recovered genotypic diversity. The number of different multilocus genotypes (MLG) and the standardized version of the index of association rD (1,21) were also calculated using Multilocus 1.3b. The index of association is a measure of the multilocus linkage disequilibrium (7,21,33), which gives information on whether two different individuals sharing the same allele at one locus are more likely to share the same allele at another locus. For any pair of individuals, the number of loci with respect to which they differ is calculated and the variance of this number is compared to that expected if there is no linkage dis-equilibrium. rD, the standardized version of the index of associ-ation, is independent of the number of loci considered, and varies between 0 (complete panmixia) and 1 (no recombination). The null hypothesis of complete panmixia (rD = 0) was tested with the procedure implemented in the software, by comparing the observed data set to 100 randomized data sets in which infinite recombination has been imposed by randomly shuffling the alleles amongst individuals, independently for each locus.
To analyze further the effect of host plant on the genetic struc-ture of fungal populations, the relative contributions of the factors “plant species” and “sampling location” to the genetic variance
were estimated with a hierarchical analysis of molecular variance (AMOVA) using ARLEQUIN version 2.000 (S. Schneider, D. Roessli, and L. Excoffier, 2000), with plant used as a grouping factor. This analysis was performed on a subset of four popu-lations sampled from grapevine in Nord and Grand Tunis, and from strawberry in Cap Bon and Centre, encompassing a total of 61 individuals. Finally, we used the software Structure version 2.1 (J. K. Pritchard, P. Stephens, and P. Donnelly, 2000) to analyze the respective roles of host plant of origin and geographic origin without using any a priori knowledge on population subdivision. The algorithm implemented in this software assumes that individuals in the sample are assigned probabilistically to K clusters, or jointly to two or more clusters if their genotypes indicate that they are admixed, without consideration of their region or host of origin. Each cluster is characterized by a set of allele frequencies at each locus, and loci are assumed at Hardy-Weinberg equilibrium and linkage equilibrium within the K clusters. However, this approach proved to be robust to deviations from these assumptions (11). Following Falush (11), we used the model with admixture, since we knew little about the existence of such a process in our data, and assumed uniform priors for the vector of proportion qi of the individual i’s genome in each
cluster. The scores of individuals in the clusters (i.e., the posterior estimates of the qi) correspond to the probability of ancestry in
any one of them. We varied K from 1 to 10, with three replicates for each K, and with each simulation consisting in 500,000 Monte-Carlo Markov Chain (MCMC) iterations preceded by a burn-in period of 100,000 iterations (the burn-in period is the first set of iterations of the MCMC that is dependent on the configu-ration at the start—the iteconfigu-rations are not incorporated in the final calculation of the posterior probability). The most probable structure was determined by computing the posterior probability for each K using the distribution of maximum likelihoods. When the probability of ancestry of an individual in a cluster was greater than the arbitrary threshold of 0.7, this individual was considered to be unambiguously assigned to this cluster.
RESULTS
Global genetic diversity and discrimination power of the microsatellites. Out of the 169 isolates collected, 153 (Table 1)
were completely genotyped with the nine microsatellites. Con-sistent with previous studies (13,19), the overall level of genetic diversity was high with an unbiased genic diversity (Hnb) of 0.79 (±0.12 standard deviation [SD]), and a mean number of alleles per locus reaching 12.80 (±3.89 SD) (Table 2). The number of alleles per locus varied from four (locus Bc4) to 21 (locus Bc2), the latest contributing the most to the overall genic diversity (Hnb= 0.90) (Fig. 2).
Among these 153 genotyped isolates, 120 MLG were recov-ered. We used the program Multilocus to check for the discrimi-nation power of the microsatellites. The genotypic diversity reached 0.77 with a single locus randomly chosen, and varied from 0.992 and 0.995 with five to nine loci; the proportion of different MLG detected in the total sample varied from 0.077 to 0.78, respectively, with one to nine randomly chosen loci (Fig. 3). These results indicate that the set of microsatellite markers used here was sufficient to correctly estimate the existing diversity.
As a preliminary inspection of the data, we performed two-dimensional analyses of factorial correspondences (AFC) in order to visually inspect the genetic structure of the total data set, according to growing system, host plant, and geographic origin (Fig. 4). No clear pattern appeared according to any of the three factors. However, these analyses showed that tomato and/or greenhouses populations were less genetically diverse.
Open field versus greenhouse populations for the different host plants. Since several studies previously showed that closed
level of clonality of B. cinerea populations (3,10), we first ana-lyzed the influence of growing systems on the population diversity and structure in grapevine and strawberry populations. Population from these two host plants were analyzed separately since the host plant is also known to affect B. cinerea group II population structure (13).
Of a greenhouse population of 22 isolates collected from grape-vine (Table 2), at Grand Tunis, 20 distinct MLG were recovered,
displaying a genotypic diversity of 0.991. The Nord populations from open field exhibited very similar levels of diversity: 7 MLG were distinguished out of 9 individuals, for a genotypic diversity of 0.944. The pairwise FST (Table 3) between these two popu-lations were not significant (FST = 0.039, P = 0.084 when all individuals were taken into account; FST = –0.005, P = 0.5 when repeated MLG were removed). Hence, neither the growing system nor the geographic distance affected the genetic differentiation
Fig. 2. Relative contribution of the different loci to the genetic diversity of Botrytis cinerea in the total sample and in the populations separated by host plants. Left
panel: nonbiased genic diversity Hnb (37); right panel: number of alleles per locus.
Fig. 3. Discrimination power of the nine microsatellite loci used in the present study. The proportion of different genotypes recovered from the total data set
(GML/N) and the genotypic diversity were calculated from the data sets obtained after 100 random samples of one to eight loci.
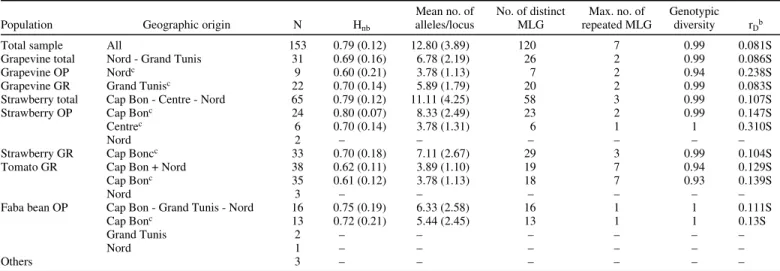
TABLE 2. Genetic diversity indexes within the pooled sample and in each population of Botrytis cinerea separated by host plant and by growing systemsa
Population Geographic origin N Hnb
Mean no. of alleles/locus No. of distinct MLG Max. no. of repeated MLG Genotypic diversity rDb
Total sample All 153 0.79 (0.12) 12.80 (3.89) 120 7 0.99 0.081S
Grapevine total Nord - Grand Tunis 31 0.69 (0.16) 6.78 (2.19) 26 2 0.99 0.086S
Grapevine OP Nordc 9 0.60 (0.21) 3.78 (1.13) 7 2 0.94 0.238S
Grapevine GR Grand Tunisc 22 0.70 (0.14) 5.89 (1.79) 20 2 0.99 0.083S
Strawberry total Cap Bon - Centre - Nord 65 0.79 (0.12) 11.11 (4.25) 58 3 0.99 0.107S
Strawberry OP Cap Bonc 24 0.80 (0.07) 8.33 (2.49) 23 2 0.99 0.147S
Centrec 6 0.70 (0.14) 3.78 (1.31) 6 1 1 0.310S
Nord 2 – – – – – –
Strawberry GR Cap Boncc 33 0.70 (0.18) 7.11 (2.67) 29 3 0.99 0.104S
Tomato GR Cap Bon + Nord 38 0.62 (0.11) 3.89 (1.10) 19 7 0.94 0.129S
Cap Bonc 35 0.61 (0.12) 3.78 (1.13) 18 7 0.93 0.139S
Nord 3 – – – – – –
Faba bean OP Cap Bon - Grand Tunis - Nord 16 0.75 (0.19) 6.33 (2.58) 16 1 1 0.111S
Cap Bonc 13 0.72 (0.21) 5.44 (2.45) 13 1 1 0.13S
Grand Tunis 2 – – – – – –
Nord 1 – – – – – –
Others 3 – – – – – –
a OP: open field, GR: greenhouse. N: sample size. H
nb: nonbiased genic diversity (37), calculated with repeated genotypes (standard deviations between brackets).
MLG: multilocus genotypes. All estimates were calculated only for populations counting more than six individuals.
b r
D: standardized index of association (1,21). S indicates significant values, i.e., P values below 1% after 100 random resampling. c Same as in Table 1.
and diversity of B. cinerea populations from this plant. This also means that grapevine greenhouses cannot be considered as closed systems. Hereafter, all isolates from grapevine will therefore be analyzed as open field isolates. The estimates of multilocus linkage disequilibrium (Table 2) were low but significant in both populations (Grand Tunis greenhouse: rD = 0.083, P < 0.01; Nord open field: rD = 0.238, P < 0.01). This suggests a sexual repro-ductive mode mainly with a low but significant level of clonality.
Populations collected from strawberries in the Cap Bon and Centre regions presented a contrasting differentiation pattern (the only two isolates coming from other areas were not considered here) (Table 2). The open field population from the Centre region encompassed six isolates, all being distinct MLG, representing a genotypic diversity of one. This population was not significantly differentiated from the open field (FST = 0.03, P = 0.20) and greenhouse (FST = 0.02, P = 0.17) populations from the Cap Bon region, indicating an absence of geographic structure. However, gene flow was significantly reduced between the greenhouse and open field populations from the Cap Bon region (FST = 0.095, P < 0.001 with all individuals, FST = 0.081, P < 0.001 with non-repeated MLG only) (Table 3). Yet, both populations from the Cap Bon region exhibited similar levels of diversity (Table 2) (open field population showing 23 distinct MLG among 24 isolates with genotypic diversity = 0.996; and greenhouse popula-tion showing 29 MLG among 33 isolates with genotypic diversity = 0.99). Again, low but significant multilocus linkage disequilibria were recovered from both populations, indicating a significant departure from panmixia but not complete clonality (open field population from Cap Bon: rD = 0.147, P < 0.01; greenhouse population from Cap Bon: rD = 0.104, P < 0.01) (Table 2). Hence, the growing system apparently did not affect the population dynamics and reproductive mode, but clearly reduced the amount of gene flow between populations from strawberry in the same region. In the subsequent analyses regarding the respective effects of host plants and geography, only the open field populations from Cap Bon and Centre regions will hence be considered for isolates sampled on strawberries.
B. cinerea group II populations from faba beans were only
sampled in open field conditions. The analysis of the Cap Bon population collected from this host showed that the diversity reached similar levels as open field populations from other plants (13 MLG among 13 isolates, leading to a genotypic diversity of 1). The multilocus linkage disequilibrium again showed the same trend of departure from panmixia (rD = 0.13, P < 001).
We could not compare the effect of growing systems on B.
cinerea group II populations sampled from tomato either because
isolates from this host were sampled only under greenhouses. However, the AFC performed on the total sample already showed a particular genetic composition of this population (Fig. 4B). Indeed, the detailed analysis of the 35 isolates sampled on tomato in the Cap Bon region showed that only 18 distinct MLG were recovered (Table 2). In this population the lowest genotypic and genic diversities (0.936 and 0.62, respectively) were observed. However, the multilocus linkage disequilibrium was of the same range of magnitude as in other populations (rD = 0.139, P < 0.001). This may indicate the existence of a bottleneck reducing the population diversity at the entrance of tomato greenhouses, without modifying the reproductive mode.
Respective effects of geography and host plant on open field populations from grapevine, strawberry, and bean. The above
analyses led us to restrict the analysis of the effects of geography and host to populations from different plants grown in open field systems (including grapevine from the Grand Tunis region). Samples with less than six individuals were removed from this analysis, which thus included five populations: isolates sampled from grapevine in Nord (N = 9) and Grand Tunis (N = 22), strawberry in Cap Bon (N = 24) and Centre (N = 6), and faba bean in Cap Bon (N = 13), i.e., a total of 74 isolates (Table 1).
Pairwise FST, calculated between pairs of populations, showed that populations from different regions and from the same host were not significantly differentiated (Table 3), indicating that regardless of the host considered, the geographic distance did not ever reduce gene flow between populations. Only two FST were significant: grapevine populations from North versus strawberry population from Cap Bon on the one hand, grape- vine population from Grand Tunis versus strawberry popu- lation from Cap Bon on the other hand. This pattern may be due either to the host plant or to the geographic origin or both. Indeed, the Grand Tunis and Nord regions are separated from the other sampling areas by the Tunisian Dorsale, a
South-Fig. 4. Two-dimensional analyses of factorial correspondences performed on
the total data set of Botrytis cinerea isolates. A, Populations distinguished by growing systems (G isolates from greenhouses, ♦ isolates from open field
cultures). B, Populations distinguished by host plants (G: tomato, ♦: bean, U:
strawberry, ": grapevine, +: others). C, Populations distinguished by geo-graphic origin (: Nord, ": Cap Bon, U: Grand Tunis, : Centre). Percentage values over each axis indicate the percentage of diversity explained by the corresponding axis.
East/North-East mountain range peaking at more than 1,500 m that could represent a geographic barrier to B. cinerea dispersion (Fig. 1).
To investigate the respective roles of host and geography, we performed a hierarchical AMOVA. We excluded isolates from faba bean since they were sampled in a single region; the AMOVA therefore concerned four of the five populations listed above (populations from grapevine sampled in Nord and Grand Tunis, and from strawberry in Cap Bon and Centre) (Table 4). The greatest part of the observed genetic variance came from the variation within each population. The host plant of origin had no significant effect on the partitioning of the total genetic diversity (P = 0.17), whereas the geographic origin has a marginally significant effect (P = 0.05), indicating that the observed pattern may be due mainly to a geographic barrier to gene flow.
Finally, we used a Bayesian approach to analyze the subset of five populations (74 individuals) with the Structure software, varying K from 1 to 10. The posterior probability of the data, lnPr(X|K), reached a maximum for K = 6, and the posterior probability of K was also the highest (P = 0.999) for this value (Fig. 5A). The computation of the increase of likelihood (delta[LnPr(X|K)]; Fig. 5B), showed that the gain of explanatory power of the model when adding a new cluster to the analysis was the highest at K changing from 6 to 7, and then became null or negative.The frequencies of isolates in the six clusters (Fig. 5C) were significantly different according to their region and plant of origin (χ2 = 46.5, P = 0.0002, df = 18; Table 5). The major trend seemed to be a geographical structure opposing isolates from the Cap Bon and the North region. Indeed, clusters 2 and 3 encompassed exclusively isolates sampled in the Cab Bon area (7/7 from strawberries in cluster 2, 7 from strawberries, and 4 from faba beans in cluster 3), whereas clusters 5 and 6 comprised respectively 8/8 and 5/7 isolates sampled on grapevine from the Grand Tunis region (Table 5). The two other clusters represented a mixing of isolates from the different regions and plants. However, since all isolates from grapevine were sampled in the Nord and Grand Tunis regions, and all isolates from strawberry and faba beans in the Centre and Cap Bon regions, it was impossible again to truly separate geographic from host plant effects. We performed the same analysis to the restricted sample of 63 isolates from strawberries and faba beans from Cap Bon and Centre regions. The posterior probability of the data and associate indicators all peaked for K = 4 (Fig. 6A and B), but the probability of ancestry of isolates in each cluster (Fig. 6C) was not significantly associated with host plant or geographic origin
(χ2 = 13, P = 0.11, df = 8; Table 5), showing that in this area, the host plant effect is probably very attenuated, if existing.
DISCUSSION
Although the sample of B. cinerea isolates analyzed in this study is not very big and could be optimized by adding new isolates in order to equilibrate the effectives per plant, geographic areas and growing systems, the results obtained here should be quite robust since we used unbiased estimates of genetic diver-sities and FST. Moreover, the analysis of genotypic diversity as a function of the number of microsatellite loci showed that the markers used here were powerful enough to detect and charac-terize the major part of the existing diversity. Several studies (19,31) showed that the frequencies of vacuma and transposa isolates (two categories characterized by the presence or absence of transposable elements in their genomes) in B. cinerea group II populations may vary during the growing season. However, no significant barrier to gene flow has been evidenced between
vacuma and transposa French populations sampled on two
differ-ent plant species at fall (13), and neither is there any convincing evidence of a correlation between seasonal variations in vacuma and transposa frequencies and changes in the genetic structure at neutral markers (A. S. Walker, personal communication). Hence, samples performed in one particular season may give a reasonable picture of how the genetic diversity is organized in this species.
In accordance with recent population studies conducted on B.
cinerea sensu lato in several geographic areas (5,13,18,19,36),
our results showed that the overall genetic diversity recovered from the 153 fully genotyped isolates from Tunisia was high in all populations. In all populations, the indirect evaluation of the reproductive mode, that is, the standardized index of multilocus linkage disequilibrium was always in accordance with a signifi-cant departure from total panmixia, but not reaching complete clonality. The best explanation for this pattern is that B. cinerea group II populations undergo regular recombination, separated by several cycles of clonal reproduction. This result agrees with former studies conducted in France (13,19). Hence, B. cinerea group II population dynamics and reproductive mode in Mediter-ranean areas do not seem to differ drastically from more septen-trional and humid zones. Other studies conducted in California (29) did not evidence the existence of regular recombination in field populations, but the markers used (microsatellite-primed polymerase chain reaction) were likely to detect little amount of polymorphism, thus to overestimate the amount of clonality. On
TABLE 4. Hierarchical analysis of molecular variance performed using Arlequin 2.000 on the four following populations of Botrytis cinerea: isolates sampled from grapevine from Nord and Grand Tunis and strawberry from Cap Bon and Centre regions of Tunisiaa
Source of variation df Sum of squares Variance component Variation (%) P
Plant species 1 14.570 0.289 7.64 0.17
Region within plant species 2 9.487 0.122 3.22 0.05
Within region 57 192.337 3.374 89.14 <0.001
Total 60 216.993 3.785 100
a The host plant of origin was used as a grouping factor.
TABLE 3. Pairwise FST among the five Botrytis cinerea populations (74 isolates) collected from strawberry, grapevine, and faba bean in different regions in open
field systems
Population Sta Cap Bon St Centre Bea Cap Bon Gra Grand Tunis Gr Nord
St Cap Bon – 0.031 (0.026) 0.048 (0.047) 0.110Sb (0.099 Sb) 0.140 Sb (0.102 Sb)
St Centre – 0 (0) 0.043 (0.033) 0.085 (0.047)
Be Cap Bon – 0.024 (0.021) 0.083 (0.047)
Gr Grand Tunis – 0.039 (0)
Gr Nord –
a St: strawberry, Gr: grapevine, and Be: bean. b Pairwise F
ST are calculated following Weir and Cockerham (47), with and without (values between brackets) repeated MLG. S indicates significant FST (P <
the contrary, the nine microsatellite markers used here are sufficiently polymorphic and discriminatory to correctly estimate the existing diversity (Fig. 3).
Among the 169 isolates sampled during the present study, none appeared to belong to the species B. cinerea group I. This cryptic species, confounded in the past with B. cinerea group II, was characterized in several recent studies (2,14,16,31, and A. S. Walker, personal communication) in which isolates from B.
cinerea group I were found in sympatry with B. cinerea group II
populations at rather low frequencies varying between 2.5 and 15% according to the location and the season. Whereas B. cinerea
group I is totally absent from Tunisia or present only at very low frequencies and at particular periods remains to be further investigated.
The comparison between open field and greenhouse growing systems could be performed for two different host plants, leading to contrasting results. As regards isolates sampled from grapevine, the greenhouse population from Grand Tunis was not genetically differentiated from the open field population from Nord (Table 3).
TABLE 5. Frequencies of isolates of Botrytis cinerea from the different regions and host plants in the different clusters inferred with the Bayesian analyses using the Structure software
Sample analyzed Plant and geographic region Cluster 1 Cluster 2 Cluster 3 Cluster 4 Cluster 5 Cluster 6 Not assigned
74 isolates (Fig. 5) StaCap Bon 4 7 7 2 0 0 4
St Centre 1 0 0 2 0 0 3
BebCap Bon 1 0 4 2 0 2 4
GrcGrand Tunis 5 0 0 4 8 5 9
63 isolates (Fig. 6) St Cap Bon 7 5 5 7 0
St Centre 0 2 3 0 1
Be Cap Bon 3 3 4 0 2
a St: strawberry. b Be: Faba bean. c Gr: grapevine.
Fig. 6. Estimated number of populations from the 63 isolates of Botrytis cinerea from faba bean and strawberries sampled in the Cap Bon and Centre regions in Tunisia analyzed with Structure. The legends are the same as in Figure 5, except for Figure 6C where the probability of ancestry of each individual was calculated for K = 4.
Fig. 5. Estimated number of populations from the 74 isolates of Botrytis cinerea from open field growing systems, analyzed with Structure. A, Mean (± standard deviation) probabilities of the data (left y axis, full line), and posterior probability of K (right y axis, dotted line) for each value of K. B, Mean variations of probabilities of the data (delta[Ln(Pr[X|K])]) between successive K considered in the Structure analysis. For K > 1, delta(Ln[Pr(X|K)]) = Ln(Pr[X|K])k+1–Ln(Pr[X|K])k. C, Probability of ancestry
Greenhouses used for grapevine cultivation probably serve above all as insect-proof nets without preventing plant contamination by external inoculum of airborne spores, thus cannot be assimilated to closed systems for B. cinerea populations. We assimilated them to open field systems in the rest of our analyses.
On the contrary, populations sampled on strawberries in open field conditions in the Cap Bon region were significantly differ-entiated from greenhouse populations from the same plant and region, whereas open field populations from this plant from Cap Bon and Centre were connected by an important amount of gene flow (Table 3). Hence, for B. cinerea coming from strawberries, the growing system has a major effect on population structure, stronger than geographic distance between populations. The genetic diversity, mean number of allele per locus, and number of different MLG, were not different in greenhouse populations from strawberry as compared to open field systems, and the rD index showed equivalent levels of multilocus linkage disequilibria (Table 2).
The single population from tomato, encompassing 35 isolates sampled in a greenhouse from the Cap Bon region, exhibited the lowest genic diversity (0.61) and the highest proportion of repeated MLG (51%). These reduced levels of diversity may be due to periodic bottlenecks at the entrance of external inocula, and/or to genetic drift acting within greenhouse populations if they are strongly disconnected from the outside (with no or very few external inoculum, entrance except at the time of greenhouse installation). These results also indicated that tomato greenhouses might be more pathogen-proof than strawberry greenhouses, imposing more severe bottlenecks to external inocula from the outside. However, the multilocus linkage disequilibrium was not more elevated in this population (Table 2), showing that the reproductive mode is not modified within tomato greenhouses.
As regards open field systems only, we analyzed 74 isolates coming from five populations of different plants and different regions (Table 3), in order to disentangle the respective roles of geography and host plants on B. cinerea group II populations. Indeed, pathogen populations and their host plants are continually co-evolving, conditioning the way parasites are adapting to their hosts, which remains a key problem in evolution. These long-term evolutionary processes may lead to sympatric ecological specia-tion of parasites by host shifts (4,17,20,28). In fact, many phyto-pathogenic fungi that had long been considered as broad general-ists have recently been recognized as complexes of sibling species or isolated populations, specialized on different hosts (24–26, 32,42). In our study, classical population genetics analyses as well as Bayesian assignment approaches showed that B. cinerea group II open field populations were genetically structured. One impor-tant factor explaining the observed gene flow reduction between populations may be the Grande Dorsale Mountain, serving as a geographic barrier. Indeed, the highest pairwise FST values (0.83 to 0.14, Table 3) were obtained between populations from Cap Bon or Centre regions compared with populations from Nord or Grand Tunis, whereas pairwise FST between the different popu-lations within the regions of Cap Bon and Centre, as well as between the different populations within the regions of Nord and Grand Tunis, did not exceed 0.4. Similar conclusions could be drawn from the Bayesian analysis with the Structure software, since four of the six clusters inferred from this approach were mainly explained by the geographic origin of isolates (Fig. 5). However, since all isolates from the Nord and Grand Tunis regions were sampled from grapevine, whereas isolates from Cap Bon and Centre regions came from strawberries and faba beans, it was impossible to disentangle geographic from host plant effect. The further analysis of the faba bean and strawberry isolates from the Cap Bon and Centre regions evidenced four clusters, without any clear pattern linking the probability of ancestry in one particular cluster to the geographic or host plant origin of the isolate (Fig. 6). This indicates that both factors (sampling location
and host plant) act together to shape the population genetic structure at this spatial scale. Hence, the host plant seems to remain an important feature driving population differentiation of
B. cinerea group II, probably through adaptation, but this effect
could not be separated clearly, in this study, from geographic effects. Further assignment analysis using individual spatial co-ordinates of isolates sampled in sympatry on different host plants, and in different regions, may be useful to depict more precisely these joint effects.
ACKNOWLEDGMENTS
We thank A.-S. Walker and T. Giraud and two anonymous reviewers for stimulating discussions and comments on previous versions of the manuscript; J. M. Pradier and S. Foucher for technical assistance; and M. Viaud and Y. Brygoo for helpful support.
LITERATURE CITED
1. Agapow, P.-M., and Burt, A. 2001. Indices of multilocus linkage disequilibrium. Mol. Ecol. Notes 1:101-102.
2. Albertini, C., Thébaud, G., Fournier, E., and Leroux, P. 2002. Eburicol 14α-demethylase gene (cyp51) polymorphism and speciation in Botrytis cinerea. Mycol. Res. 106:1171-1178.
3. Alfonso, C., Raposo, R., and Melgarejo, P. 2000. Genetic diversity in Botrytis cinerea populations on vegetable crops in greenhouses in south-eastern Spain. Plant Pathol. 49:243-251.
4. Antonovics, J., Hood, M. E., and Partain, J. 2002. The ecology and genetics of a host-shift: Microbotryum as a model system. Am. Nat. 160(suppl.):S40-53.
5. Baraldi, E., Bertolini, P., Chierici, E., Trufelli, B., and Luiselli, D. 2002. Genetic diversity between Botrytis cinerea isolates from unstored and cold stored kiwi fruit. J. Phytopathol. 150:629-635.
6. Beever, R. E., and Parkes, S. L. 2003. Use of nitrate non-utilising (Nit) mutants to determine vegetative incompatibility in Botryotinia fuckeliana (Botrytis cinerea). Eur. J. Plant Pathol. 109:607-613.
7. Brown, A. H. D., Feldman, M. W., and Nevo, E. 1980. Multilocus struc-ture of natural populations of Hordeum spontaneum. Genetics 96:523-536.
8. Chardonnet, C. O., Sams, C. E., Trigiano, R. N., and Conway, W. S. 2000. Variability of three isolates of Botrytis cinerea affects the inhibitory effects of calcium on this fungus. Phytopathology 90:769-774.
9. Choquer, M., Fournier, E., Kunz, C., Levis, C., Pradier, J. M., Simon, A., and Viaud, M. 2007. Botrytis cinerea virulence factors: New insights into a necrotrophic and polyphageous pathogen. FEMS Microbiol. Lett. 277:1-10.
10. Dik, A. J., and Wubben, J. P. 2004. Epidemiology of Botrytis cinerea diseases in greenhouses. Pages 319-333 in: Botrytis: Biology, Pathology
and Control. Y. Elad, B. Williamson, P. Tudzynski, and N. Delen, eds. Springer-Verlag, Berlin.
11. Falush, D., Stephens, M., and Pritchard, J. 2003. Inference of population structure using multilocus genotype data: Linked loci and correlated allele frequencies. Genetics 164:1567-1587.
12. Forster, B., and Staub, T. 1996. Basis for use strategies of anilinopyrimi-dine and phenylpyrrole fungicides against Botrytis cinerea. Crop Prot. 15:529-537.
13. Fournier, E., and Giraud, T. 2008. Sympatric genetic differentiation of a generalist pathogenic fungus, Botrytis cinerea, on two different host plants, grapevine and bramble. J. Evol. Biol. 21:122-132.
14. Fournier, E., Giraud, T., and Brygoo, Y. 2005. Partition of the Botrytis cinerea complex in France using multiple gene genealogies. Mycologia 97:1251-1267.
15. Fournier, E., Giraud, T., Loiseau, A., Vautrin, D., Estoup, A., Solignac, M., Cornuet, J. M., and Brygoo, Y. 2002. Characterization of nine poly-morphic microsatellite loci in the phytopathogenic fungus Botrytis cinerea (Ascomycota). Mol. Ecol. Notes 2:253-255.
16. Fournier, E., Levis, C., Fortini, D., Giraud, T., Leroux, P., and Brygoo, Y. 2003. Characterization of Bc-hch, the Botrytis cinerea homolog of the Neurospora crassa het-c vegetative incompatibility locus, and its use as a population marker. Mycologia 95:951-961.
17. Giraud, T. 2006. Speciation: Selection against migrant pathogens: The immigrant inviability barrier in pathogens. Heredity 97:316-318. 18. Giraud, T., Fortini, D., Levis, C., Lamarque, C., Leroux, P., LoBuglio, K.,
and Brygoo, Y. 1999. Two sibling species of the Botrytis cinerea complex, transposa and vacuma, are found in sympatry on numerous host plants. Phytopathology 89:967-973.
markers show genetic recombination in Botryotinita fuckeliana (Botrytis cinerea) and transposable elements reveal two sympatric species. Mol. Biol. Evol. 14:1177-1185.
20. Giraud, T., Villaréal, L. M. M. A., Austerlitz, F., Le Gac, M., and Lavigne, C. 2006. Importance of the life cycle in sympatric host race formation and speciation of pathogens. Phytopathology 96:280-287.
21. Haubold, B., Travisiano, P. B., and Hudson, R. R. 1998. Detecting linkage disequilibrium in bacterial populations. Genetics 150:1341-1348. 22. Korolev, N., Katan, T., and Elad, Y. 2006. Use of selenate-resistant strains
as markers for the spread and survival of Botrytis cinerea under greenhouse conditions. Phytopathology 96:1195-1203.
23. Latorre, B. A., Spadaro, I., and Rioja, M. E., 2002. Occurrence of resistant strains of Botrytis cinerea to anilinopyrimidine fungicides in table grapes in Chile. Crop Prot. 21:957-961.
24. Le Cam, B., Parisi, L., and Arene, L. 2002. Evidence of two formae speciales in Venturia inaequalis, responsible for apple and pyracantha scab. Phytopathology 92:314-320.
25. Le Gac, M., Hood, M. E., Fournier, E., and Giraud, T. 2007. Phylogenetic evidence of host-specific cryptic species in the anther smut fungus. Evolution 16:15-26.
26. Le Gac, M., and Giraud, T. 2008. Existence of a pattern of reproductive character displacement in Basidiomycota but not in Ascomycota. J. Evol. Biol. 21:761-772.
27. Leroux, P., and Clerjeau, M. 1985. Resistance of Botrytis cinerea Pers. and Plasmopara viticola (Berk. & Curt.) Berl. and de Toni to fungicides in French vineyards. Crop Prot. 4:137-160.
28. Lopez-Villavicencio, M., Enjalbert, J., Hood, M. E., Shykoff, J. A., Raquin, C., and Giraud, T. 2005. The anther smut disease on Gypsophila repens: A case of parasite sub-optimal performance following a recent host shift? J. Evol. Biol. 18:1293-1303.
29. Ma, Z., and Michailides, T. J. 2005. Genetic structure of Botrytis cinerea populations from different host plants in California. Plant Dis. 89:1083-1089.
30. Martinez, F., Blancard, D., Lecomte, P., Levis, C., Dubos, B., and Fermaud, M. 2003. Phenotypic differences between vacuma and trans-posa subpopulations of Botrytis cinerea. Eur. J. Plant Pathol. 109:479-488. 31. Martinez, F., Dubos, B., and Fermaud, M. 2005. The role of saprotrophy
and virulence in the population dynamics of Botrytis cinerea in vineyards. Phytopathology 95:692-700.
32. Matsuda, S., and Takamatsu, S. 2003. Evolution of host-parasite relationships of Golovinomyces (Ascomycete: Erysiphaceae) inferred from nuclear rDNA sequences. Mol. Phylogenet. Evol. 27:314-327. 33. Maynard-Smith, J., Smith, N. H., O’Rourke, M., and Spratt, B. G. 1993.
How clonal are bacteria? P. Natl. Acad. Sci. USA 90:4384-4388. 34. McDonald, B., and Linde, C. 2002. The population genetics of plant
pathogens and breeding strategies for durable resistance. Euphytica 124:162-180.
35. Moyano, C., Alfonso, C., Gallego, J., Raposo, R., and Melgarejo, P. 2003. Comparison of RAPD and AFLP marker analysis as a means to study the genetic structure of Botrytis cinerea populations. Eur. J. Plant Pathol. 109:515-522.
36. Muñoz, G., Hinrichsen, P., Brygoo, Y., and Giraud, T. 2002. Genetic characterisation of Botrytis cinerea populations in Chile. Mycol. Res. 106:594-601.
37. Nei, M. 1987. Molecular Evolutionary Genetics. Columbia University Press, New York.
38. Paplomatas, E. J., Pappas, A. C., and Antoniadis, D. 2004. A relationship among fungicide-resistant phenotypes of Botrytis cinerea based on RAPD analysis. J. Phytopathol. 152:503-508.
39. Paulitz, T. C., and Bélanger, R. R. 2001. Biological control in greenhouse systems. Annu. Rev. Phytopathol. 39:103-A33.
40. Petsikos-Panayotarou, N., Markellou, E., Kalamarakis, A. E., Kyriakopoulou, D., and Malathrakis, N. E. 2003. In vitro and In vivo activity of Cyprodinil and Pyrimethanil on Botrytis cinerea isolates resistant to other Botryticides and selection for resistance to Pyrimethanil in a greenhouse population in Greece. Eur. J. Plant Pathol. 109:173-182. 41. Rice, W. R. 1989. Analyzing tables of statistical tests. Evolution
43:223-225.
42. Schardl, C. L., Leuchtmann, A., Chung, K. R., Penny, D., and Siegel, M. R. 1997. Coevolution by common descent of fungal symbiont (Epichloë spp.) and grass hosts. Mol. Biol. Evol. 14:133-143.
43. Staats, M., van Baarlen, P., and van Kan, J. A. 2005. Molecular phylogeny of the plant pathogenic genus Botrytis and the evolution of host specificity. Mol. Biol. Evol. 22:333-346.
44. Thompson, J. R., and Latorre, B. A. 1999. Characterization of Botrytis cinerea from table grapes in Chile using RAPD-PCR. Plant Dis. 83:1090-1094.
45. Van Kan, J. 2006. Licensed to kill: The lifestyle of a necrotrophic plant pathogen. Trends Plant Sci. 11:247-53.
46. Weeds, P. L., Beever, R. E., and Long, P. G. 1998. New genetic markers for Botryotinia fuckeliana (Botrytis cinerea). Mycol. Res. 102:791-800. 47. Weir, B. S., and Cockerham, C. C. 1984. Estimating F-statistics for the
analysis of population structure. Evolution 38:1358-1370.
48. Yourman, L. F., Jeffers, S. N., and Dean, R. A. 2001. Phenotype insta-bility in Botrytis cinerea in the absence of benzimidazole and dicar-boximide fungicides. Phytopathology 91:307-315.