HAL Id: hal-02393161
https://hal.archives-ouvertes.fr/hal-02393161
Submitted on 4 Dec 2019
HAL is a multi-disciplinary open access
archive for the deposit and dissemination of
sci-entific research documents, whether they are
pub-lished or not. The documents may come from
teaching and research institutions in France or
abroad, or from public or private research centers.
L’archive ouverte pluridisciplinaire HAL, est
destinée au dépôt et à la diffusion de documents
scientifiques de niveau recherche, publiés ou non,
émanant des établissements d’enseignement et de
recherche français ou étrangers, des laboratoires
publics ou privés.
Quentin Libois, Félix Lévesque-Desrosiers, Simon Lambert-Girard, Simon
Thibault, Florent Dominé
To cite this version:
Quentin Libois, Félix Lévesque-Desrosiers, Simon Lambert-Girard, Simon Thibault, Florent Dominé.
Optical porosimetry of weakly absorbing porous materials. Optics Express, Optical Society of America
- OSA Publishing, 2019, 27 (16), pp.22983. �10.1364/OE.27.022983�. �hal-02393161�
Optical porosimetry of weakly absorbing porous
materials
Q
UENTINL
IBOIS,
1,6,8F
ÉLIXL
ÉVESQUE-D
ESROSIERS,
2,3,4,6,7S
IMONL
AMBERT-G
IRARD,
2,3S
IMONT
HIBAULT,
4 ANDF
LORENTD
OMINE2,3,51CNRM, Université de Toulouse, Météo-France, CNRS, Toulouse, France
2Takuvik Joint International Laboratory (UMI 3376), Université Laval, Québec, Canada 3Takuvik Joint International Laboratory (UMI 3376), CNRS, France
4Centre d’Optique, Photonique et Laser (COPL) and Département de Physique, de Génie Physique et
d’Optique, Université Laval, Québec, Canada
5Department of Chemistry and Centre d’Optique Nordiques, Université Laval, Québec, Canada 6These authors contributed equally.
7felix.levesque-desrosiers@takuvik.ulaval.ca 8quentin.libois@meteo.fr
Abstract: The physical porosity Φ of a porous material determines most of its properties. Although the optical porosity Φopt can be measured, relating this quantity to Φ remains a
challenge. Here we derive relationships between the optical porosity, the effective refractive index
neffand the physical porosity of weakly absorbing porous media. It introduces the absorption
enhancement parameter B, which quantifies the asymmetry of photon path lengths between the solid material and the pores and can be derived from the absorption coefficient µaof the material.
Hence Φ can be derived from combined measurements of neffand µa. The theory is validated
against laboratory measurements and numerical experiments, thus solving a long-standing issue in optical porosimetry. This suggests that optical measurements can be used to estimate physical porosity with an accuracy better than 10%.
© 2019 Optical Society of America under the terms of theOSA Open Access Publishing Agreement
1. Introduction
Porosity controls the mechanical [1], radiative [2], thermal [3], chemical [4] and acoustic [5] properties of porous materials. Fast, accurate and non-invasive methods to determine porosity are thus useful for a wide range of applications: calibration of pharmaceutical solids [6], monitoring of food transformation [7], characterization of sedimentary rocks [8], estimation of snow density [9] and ice cores air content [10], etc. Optical methods are very attractive due to their practical implementation, relatively low cost and limited impact. However, previous attempts to retrieve porosity from optical measurements of highly scattering porous media have faced the challenge that from an optical point of view, the porosity is generally undistinguishable from the scattering phase function of the material. Indeed, although the extinction coefficient µeof a medium only
depends on its density and specific surface area which are purely geometrical quantities [11], most optical measurements can only provide the absorption coefficient µaand reduced scattering
coefficient µ0s= (1 − g)µs, with µe= µa+ µs, µsbeing the scattering coefficient. This highlights
the contribution of the generally unknown phase function of the medium through the asymmetry parameter g [12,13].
An attractive solution to this inherent limitation is to determine the effective light velocity in the medium, from which the effective refractive index neff, or equivalently the optical porosity,
can be deduced [14,15]. Indeed, it is expected that the light velocity in a porous medium is a weighted average of the velocities in both phases, but the relationship is non trivial, because light preferentially travels in the most refringent phase [6]. In such case, the relative distances traveled
#362761 https://doi.org/10.1364/OE.27.022983
by a photon in each phase do not scale with the volume fractions of each phase, preventing the easy derivation of physical porosity from measurements of neff. As a consequence, simple effective
medium models such as volume averaging [16,17], Bruggeman approximation, Maxwell-Garnett mixing rule or Looyenga formula have proved inefficient to explain the observed relationship between neffand Φ [15–19]. Empirical models have been proposed to overcome the limitations
of standard mixing models [14,15], but a general relationship between effective refractive index and physical porosity is still lacking. In this study, we show that the lengthening of photon paths in the phase with greater refractive index, which results from internal multiple scattering in this phase, is actually directly related to the bulk absorption coefficient µaof the medium
(the intrinsic radiative property that quantifies its linear rate of light absorption), as long as absorption only occurs in this phase and remains weak, which is often the case. In such conditions, the predominant interaction of light with the absorbing phase is quantified by the absorption enhancement parameter B of the material, which relates µato φ and the absorption coefficient γ
of the absorbing phase [see Eq. (16)]. B is well defined in the snow optics community [20] and has been recently determined using an optical method [21].
The aim of the paper is to propose a relationship between the effective refractive index and the physical porosity, or equivalently between optical and physical porosities. Section2presents the theoretical framework used to derive an expression of porosity in terms of neffand µa, both
parameters being measurable with optical methods. This theory is then validated in Section3
against recent measurements from the literature, and against numerical simulations performed in this study with a ray tracing model. Section4investigates the accuracy of the retrieval and the application of the theory to pore size estimation.
2. Theory
We consider a two-phase scattering medium, namely a porous material. We assume, for the sake of simplicity, that one phase is vacuum, and the other any solid material (glass, ice, mineral, metal, cellulose, etc.). The following can be extended to any two-phase structure but notations would be cumbersome. The porosity Φ of this porous medium is defined as
Φ= 1 − ρ ρs
, (1)
where ρ is the bulk density of the porous material, and ρsthat of the pure solid phase. We consider
random straight lines going through the porous medium, made of a succession of vacuum and solid chord lengths. The mean vacuum chord length is called lv, and the mean solid chord length
is called ls. From stereological considerations [11],
Φ= lv ls+ lv = 1 1+ ls/lv , (2) or alternatively: ls lv = 1 − Φ Φ . (3)
Under the condition that geometrical optics applies to the medium (that is when the photon free-path length is larger than the wavelength [20]), due to internal reflections within the solid phase, whose real refractive index n is assumed larger than 1, the actual mean solid chord length l0s of a photon traveling through the porous medium is larger than ls. From now on, the lengthening
parameter β is defined as:
l0s= βls. (4)
β thus quantifies the lengthening of photon paths inside the solid phase with respect to straight lines. Note that surface external Fresnel reflections which result in no internal path are accounted for in β, which is an average of all possible photon internal paths.
Following a photon on its tortuous path through the medium, it travels successively a distance
lvin vacuum and βlsin the solid. Its average velocity along this elementary path is thus:
v= lv+ βls lv c + nβls c = c lv+ βls lv+ nβls , (5)
where c is the speed of light in vacuum. Combining Eqs. (3) and (5) finally provides the expression of the effective refractive index neffof the medium in terms of its porosity:
neff= c v=
Φ+ nβ (1 − Φ)
Φ+ β (1 − Φ). (6) The optical porosity is defined as in [14]:
Φopt= lv
lv+ ls0
. (7)
Given Eq. (3), optical and physical porosities are related through:
Φopt= 1 1+ βls/lv
, (8)
= Φ
Φ+ β (1 − Φ). (9) We now aim at relating β to the absorption coefficient µaof the material, which can be optically
measured. To this end we first consider a convex solid particle in vacuum, uniformally illuminated by a beam of light at wavelength λ. Under weakly absorbing conditions (single scattering albedo ω 1), the absorption cross section Cabsof the particle is proportional to its volume V [20]:
Cabs= BγV, (10)
where the absorption enhancement parameter B depends on the ratio between the refractive indices of the solid and environment and on the particle shape, γ is the spectrally-dependent absorption coefficient of the solid phase, related to its imaginary refractive index m through γ = 4πm/λ. Like β, B accounts for the surface external Fresnel reflections. The absorption efficiency Qabsof one particle is the ratio of Cabsto the average projected area of the particle
Σ= V/ls[11]. Therefore,
Qabs= Bγls. (11)
Alternatively, Qabscan be defined as the proportion of photons impacting the particle which are
absorbed along the mean internal solid chord ls0. Light extinction in the absorbing phase follows
Beer-Lambert law, such that Qabs= 1 − e−γl
0
s, which at weakly absorbing wavelengths (γl0 s 1)
can be approximated by γl0
s[22], so that,
l0s' Bls, (12)
which formally shows that for a single particle
β ' B. (13)
In the case of a collection of such non-sticky identical particles, the particles number concentration
Nreads:
N=1 − Φ
Using Eqs. (10) and (14), B is related to the bulk absorption coefficient µaof the medium [23]:
µa = NCabs, (15)
= Bγ (1 − Φ) . (16)
This relation assumes that mutual interferences can be neglected, which proved to remain valid even at porosities larger than 50% [24]. In the following, we further assume that Eq. (13) holds for any porous medium, as long as B is defined according to Eq. (16). This will be verified in Section3. As B does not depend on the particle sizes, but solely on their shape, Eq. (9) comforts the conclusions of [14] and [15] that Φoptis independent of the granules sizes.
The combination of Eqs. (6), (13) and (16) finally shows that the porosity of a medium can be derived from the measurement of neffand µa:
neff ' Φ+ nµa γ Φ+ µa γ , (17) Φ ' µa γ n − neff neff− 1 . (18)
Notably, for the particular case of a statistically random mixture – a random mixture is such that along a straight line, the positions of the successive interfaces follows a Markov process, which means that any next intersection is independent of the positions of the previous ones, resulting in exponential distributions of vacuum and solid chord lengths – it was shown that B= n2[Eqs. (9) and (25) of [11]]. In this case, Φ can be derived directly from neffusing Eq. (6), even if µaor γ
are poorly known:
Φ ' n 2(n − n eff) n2(n − n eff)+ (neff− 1) . (19)
Equations (18) and (19) were derived for the case where the host medium has refractive index 1. However they can be generalized to the case of two phases with refractive indices n1and n2,
where absorption only occurs in phase 2 such that n2>n1. In this case,
neff= n1Φ+ n2β (1 − Φ) Φ+ β (1 − Φ) , (20) Φ ' µa γ n2− neff neff− n1 . (21)
In addition, as β only depends on Snell and Fresnel equations which are invariant to the ratio
n2/n1, it equals (n2/n1)2for the random mixture. In this case, Eq. (19) becomes:
Φ ' n 2 2(n2− neff) n22(n2− neff)+ n21(neff− n1) . (22) 3. Applications
The formulae derived in the previous section are meaningful because both neffand µacan be
measured with optical methods. These formula are first validated with experimental data from the literature, then with dedicated numerical simulations performed with a ray tracing model. Once validated, the proposed theoretical framework can be applied to the retrieval of Φ [Eq. (18)].
3.1. Experimental data from the literature
The theory derived in Section2is applied to the experimental studies of [14] and [15] that lie in the framework of the proposed model. In [14], gas in scattering media absorption spectroscopy (GASMAS, e.g. [25]) and photon time of flight spectroscopy (PTOFS) are used to determine lv
and ls0, respectively, of a ceramic material (n= 1.75) and of 12 granulated pharmaceutical tablets
(n= 1.5) with various porosities. Two sets of tablets were manufactured from the compression of two sieve fractions (150 µm granules sizes for group A and 150-400 µm for group B). The physical porosity of these porous materials was measured using mercury intrusion and the optical porosity was computed after Eq. (7). For the ceramic material, the measured physical porosity was 0.34 and the measured optical porosity was 0.149. Application of Eq. (9) (assuming a random mixture because µawas negligible) gives an optical porosity of 0.144, very close to the
measured value. The results for the pharmaceutical tablets are shown in Fig.1. It shows that the theory explains very successfully the observed relationship between optical and physical porosities (mean absolute relative error of 6.3%), whatever the granules size. It also suggests that Eq. (9) remains valid at low porosities.
Fig. 1. Optical porosity of pharmaceutical tablets as a function of physical porosity reported
by [14] for two groups of tablets with different granule sizes. The model corresponds to Eq. (9) with β= n2. The 1:1 line is dashed.
In a way similar to [14], in [15] frequency domain photon migration (FDPM) and GASMAS techniques were combined to derive nefffor commercial porous alumina ceramics (n= 1.76) of
various porosities and pore size around 200 µm. The authors tried to explain the experimental relationship between neffand Φ by using a modified Looyenga model. This required the fitting of
a parameter, so that their relationship cannot be extended to other materials. Figure2shows their experimental results, along with Eq. (6), again assuming a random mixture (because µa= 0 m−1
in this experiment). It shows that the match between model and observations is excellent (mean absolute relative error of 0.5%), which again strongly supports the theory developed in Section2
for a wide range of porosities. 3.2. Numerical simulations
The samples investigated in the previous section were assumed to be random mixtures from a statistical point of view, because of the absence (to the best of our knowledge) of combined accurate measurements of neffand µa(µa , 0) in the literature. Although this approximation proved very efficient for the two cases mentioned, the validity of Eq. (6) is now investigated for non-random mixtures. To this end, the theory is tested against optical simulations performed with the ray tracing software Zemax OpticStudio (www.zemax.com) used in non-sequential
Fig. 2. Effective index of porous ceramics as a function of porosity reported by [15]. The model corresponds to Eq. (6) with β= n2.
mode in order to make Monte-Carlo simulations on virtual porous materials made of unsticky spheres and randomly oriented cubes, as well as sticky spheres (Fig.3). The particles are weakly absorbing, their refractive index is n2and that of the medium is n1. The sample volume has an
optical depth of 700 and is 7 times as wide as it is deep. Photons are launched at the center top of the sample. A given trajectory is terminated when the photon escapes the sample volume, and the effective refractive index neffof the medium is computed from the average speed of photons
along their trajectories. For this, only photon paths larger than the mean path are used to ensure that a sufficiently large hence representative part of the sample is probed. The experiment is repeated for various refractive indices n1and n2, and various physical porosities, the latter being
determined from stereology [Eq. (1)]. To validate Eq. (6), the absorption enhancement parameter
Bof each samples also needs to be computed. The procedure is detailed hereafter.
Fig. 3. Virtual porous media created with Zemax. (left) 3D sample for unsticky spheres of
radius 0.1 mm (Φ= 0.6). (right) Cross-section of a sticky spheres medium with elementary spheres radii distributed uniformly in the 0.15 - 0.45 mm range (Φ= 0.66).
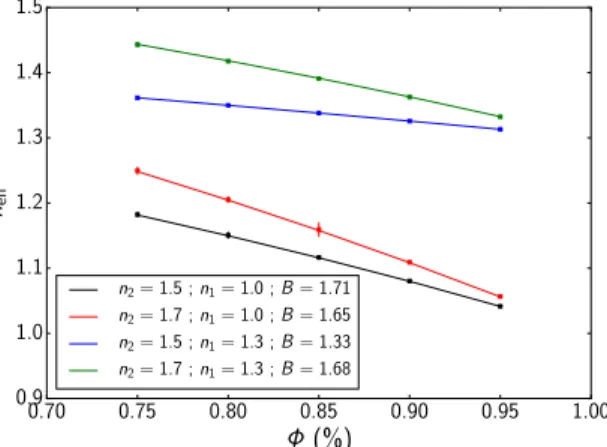
Simulations are first performed for various collections of randomly organized unsticky and identical (same size) cubes and spheres. The absorption enhancement parameter B of each sample equals that of a single particle. The latter is estimated following [23], by launching rays from all directions on a single particle. Figures4and5show the computed neffas a function of
simulations, for all investigated configurations, highlighting the validity of Eq. (6) in the case of independent particles.
Fig. 4. Effective refractive index of a collection of randomly arranged unsticky identical
spheres as a function of porosity, determined from numerical ray tracing simulations (dots) and from Eq. (6) (line). For the simulations (10 000 photons launched), γ= 20 m−1, the radius of spheres varies between 0.1 and 1 mm, and the refractive index of the medium (n2) and environment (n1) are varied. The error bars show the variance obtained from Monte
Carlo statistics. The values of B were estimated on the single particles as detailed in the text.
Fig. 5. Same as Fig.4, for randomly arranged unsticky cubes with 0.2 mm edge.
When the medium is not made of a collection of identical particles, B is not directly related to the B of individual particles but it can nevertheless be determined from µaaccording to Eq. (16),
as long as Φ is known. Practically, µacan be determined using combined measurements of
reflectance and flux exponential decay as a function of depth [23], or from PTOFS [12]. Here the method of [23] is used to estimate B for this medium. Briefly, the semi-infinite diffuse albedo α and asymptotic flux extinction coefficient keof the medium are estimated with Zemax. Analytical
expressions of α and kegiven by [24] allow to compute B as [Eq. (12) of [23]]:
B= − keln α
or equivalently:
µa= − keln α
4 . (24)
To estimate α, the sample is illuminated by a diffuse point source at the center, and the photons escaping through the top contribute to the albedo. keis derived from the linear regression of
ln (F (z)), where the downward flux F (z) at any depth is estimated by counting all the photons crossing downward the corresponding surface (Fig.6).
Fig. 6. Estimation of the asymptotic flux extinction coefficient keof a virtual sample with
Zemax. Error bars indicate the Monte Carlo noise associated to the flux estimation. Here the linear regression is performed between 1.5 and 4.5 cm (shaded area) where the regime is linear. In this example (Φ= 0.174) this reads ke= 164.2 ± 0.8 m−1.
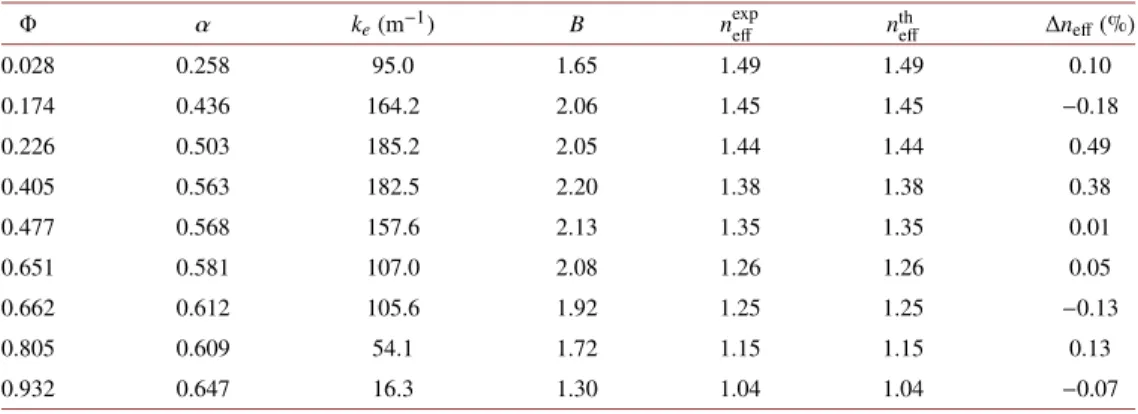
The sticky spheres samples are such that n1 = 1, n2 = 1.5, and γ = 20 m−1. As media with
different porosities practically have different microstructures, B varies with porosity. Table1
summarizes the B values obtained from Eq. (23), and compares nexpeff, the experimental value corresponding to the average speed of photons in the Zemax simulations, to the theoretical value
ntheffderived from Eq. (6). The relative difference between both is denoted ∆neff. It shows that
theoretical and experimental neffagree within less than 0.5 %. This very good agreement extends
the validity of Eq. (16), hence of the theory, to any porous medium satisfying the conditions enumerated in Section2: geometrical optics applies, absorption is weak and localized in the
Table 1. Semi-Infinite Albedo α, Asymptotic Flux Extinction Coefficient ke, Absorption Enhancement Parameter B and Effective Refractive Index nefffor Sticky Spheres Samples of Various
Porosities. Φ α ke(m−1) B nexp eff n th eff ∆neff(%) 0.028 0.258 95.0 1.65 1.49 1.49 0.10 0.174 0.436 164.2 2.06 1.45 1.45 −0.18 0.226 0.503 185.2 2.05 1.44 1.44 0.49 0.405 0.563 182.5 2.20 1.38 1.38 0.38 0.477 0.568 157.6 2.13 1.35 1.35 0.01 0.651 0.581 107.0 2.08 1.26 1.26 0.05 0.662 0.612 105.6 1.92 1.25 1.25 −0.13 0.805 0.609 54.1 1.72 1.15 1.15 0.13 0.932 0.647 16.3 1.30 1.04 1.04 −0.07
most refringent phase. Most notably, it formally proves that physical porosity can be obtained from combined optical estimations of neffand µa, whatever the microstructure of the medium.
4. Discussion
4.1. Application to Φ retrieval
In the previous section it was shown that the theory developed holds for any geometry of the porous medium, enabling deriving the physical porosity of a material from measurements of
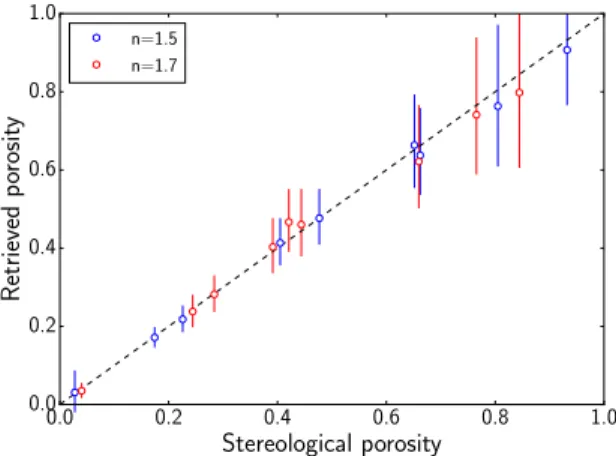
neffand µa[Eq. (18)]. As an illustration, Fig.7shows the successful porosity retrieval for all
the sticky spheres samples of Section3.2. Based on these numerical simulations, the retrieval accuracy is 3.7% for n= 1.5 and 5.3% for n = 1.7.
Fig. 7. Retrieval of the physical porosity for the sticky spheres samples, based on the
determinations of µaand neffreported in Section3.2. Error bars correspond to the combined
statistical errors of µaand neffbased on the 10 000 photons used in the simulations. These
errors would be lower for a larger number of photons.
4.2. Precision of Φ retrieval
Although it has been demonstrated that Φ can be retrieved using only optical measurements, the precision of the retrieval must be assessed to test the actual potential of this technique. First, a basic error analysis of Eq. (18) shows that
∆Φ= ∆µa+ ∆neff neff(n − 1) (neff− 1) (n − neff)
, (25)
∆Φ= ∆µa+ ∆nefff (n, neff) , (26)
where ∆ indicates a relative error. The error on the porosity is linearly affected by errors in
neff and µa. f (n, neff) (hence the error) decreases when n increases, as expected because the
determination of Φ is based on the contrast between light speed in the solid and the air. It is minimum for neff=
√
n, that is when Φ= B √
n
1+ B√n, which corresponds to a porosity larger than
50 %. In such case, lv=
√
nl0s, which means that photon paths are roughly balanced between both phases. Practically, the error on µais generally larger than that on neff[15,26], so that at first
order, ∆Φ ' ∆µa. It means that the precision of the µaestimation will drive that of the porosity.
As an example, in [26] µais retrieved with an uncertainty of 5.7%. Such a value is similar to
4.3. The random mixture success
The presented framework can only be used when absorption is sufficient to be measured, and the absorption coefficient of the solid phase γ is known, ensuring that neffand Φ are related. The
absence of observation data meeting these requirements has limited the experimental validation of the theory so far, pointing out the need for further dedicated measurements on appropriate porous media. Despite this lack of appropriate data, the random mixture assumption proved very efficient to explain the results of [14] and [15], for which µa could not be properly estimated.
This is of uttermost importance and could have strong implications for the optical analysis of porous media. This observation is also consistent with the result of [21] for natural snow, where an average B value of 1.6 was found, close to the corresponding random mixture value, n2= 1.69.
More generally this suggests that some porous media could be considered as randomly organized from an optical perspective. As a consequence, and similarly to B, the asymmetry parameter g of such media could also be strictly dependent on the refractive index n, as described by Eq. (60) of [11].
Such a strong assumption may enable to split the reduced scattering coefficient µs’ into its
physically relevant components µsand (1 − g). Accessing the scattering coefficient µsof a highly
scattering medium is otherwise challenging. As for a weakly absorbing medium µs 'µe, the
mean pore size of a medium could finally be estimated from the reduced scattering coefficient using Eq. (9) of [11]: µs'µe= 1 lv+ ls ⇒ lv' Φ (1 − g) µ0 s . (27)
Here Eq. (27) is tested against the data of [14]. For alumina ceramics (g ∼ 0.65), the authors measured µs0∼ 1300 cm−1, and φ= 0.34, which gives a mean pore size of 0.9 µm. For the
pharmaceutical tablets (g ∼ 0.73), taking the average value µ0s∼ 500 cm−1implies a mean pore
size ranging from 0.7 to 1.4 µm, depending on porosity. These values are consistent with the reported pore sizes obtained from mercury intrusion, respectively 1-5 µm and 1-6 µm. Equation 27 is also tested against the data of [15], who provide µs0for all investigated porosities. This gives
a mean pore size ranging from 5 to 55 µm, which is less than the reported 200 µm. A uniform pore size value across samples with very distinct porosities and powder sizes is questioning, though, so that this unique claimed value should be taken cautiously. Additional dedicated measurements remain necessary to further support the application of the random mixture to pore size determination.
5. Conclusion
We presented a method to determine the porosity of a weakly absorbing porous material using optical measurements. This was made possible by making the analogy between the absorption enhancement, well defined in the snow optics community, and the lengthening of photon paths in the solid phase responsible for the difference between physical and optical porosities. The theory was satisfactorily validated against recently published data, and comforted by complementary ray tracing simulations designed for this study. This suggests that combined optical measurements (e.g. GASMAS and PTOFS) could allow the non-invasive retrieval of porosity with uncertainty lower than 10 %. In addition the results show that some porous materials might be treated as random mixtures from an optical point of view. If confirmed for a wider variety of materials, this could dramatically facilitate the optical characterization of such media, by allowing the determination of the porosity and mean pore size through optical methods. In the future, the method shall be applied to glass beads, optical phantoms and snow samples. More generally, the reported findings pave the way for new optical methods to characterize porous materials.
Funding
Sentinelle Nord, Université Laval; LEFE/INSU (CASPER); Natural Sciences and Engineering Research Council of Canada (NSERC); Canada First Research Excellence Fund (CFREF). References
1. J. Rouquerol, D. Avnir, C. Fairbridge, D. Everett, J. Haynes, N. Pernicone, J. Ramsay, K. Sing, and K. Unger, “Recommendations for the characterization of porous solids (technical report),”Pure Appl. Chem.66(8), 1739–1758
(1994).
2. B. Hapke, “A model of radiative and conductive energy transfer in planetary regoliths,”J. Geophys. Res.: Planets
101(E7), 16817–16831 (1996).
3. N. Calonne, F. Flin, S. Morin, B. Lesaffre, S. R. du Roscoat, and C. Geindreau, “Numerical and experimental investigations of the effective thermal conductivity of snow,”Geophys. Res. Lett.38(23), L23501 (2011).
4. A. Julbe, D. Farrusseng, and C. Guizard, “Porous ceramic membranes for catalytic reactors - overview and new ideas,”J. Membr. Sci.181(1), 3–20 (2001).
5. M. A. Biot, “Generalized theory of acoustic propagation in porous dissipative media,”J. Acoust. Soc. Am.34(9A),
1254–1264 (1962).
6. T. Svensson, M. Andersson, L. Rippe, S. Svanberg, S. Andersson-Engels, J. Johansson, and S. Folestad, “VCSEL-based oxygen spectroscopy for structural analysis of pharmaceutical solids,”Appl. Phys. B: Lasers Opt.90(2),
345–354 (2008).
7. Z. Yan, M. J. Sousa-Gallagher, and F. A. Oliveira, “Shrinkage and porosity of banana, pineapple and mango slices during air-drying,”J. Food Eng.84(3), 430–440 (2008).
8. M. Van Geet, D. Lagrou, and R. Swennen, “Porosity measurements of sedimentary rocks by means of microfocus X-ray computed tomography (µCT),”Geol. Soc. Spec. Publ.215(1), 51–60 (2003).
9. M. Gergely, M. Schneebeli, and K. Roth, “First experiments to determine snow density from diffuse near-infrared transmittance,”Cold Reg. Sci. Technol.64(2), 81–86 (2010).
10. E. M. Morris and J. David Cooper, “Density measurements in ice boreholes using neutron scattering,”J. Glaciol.
49(167), 599–604 (2003).
11. A. V. Malinka, “Light scattering in porous materials: geometrical optics and stereological approach,”J. Quant. Spectrosc. Radiat. Transfer141, 14–23 (2014).
12. M. S. Patterson, B. Chance, and B. C. Wilson, “Time resolved reflectance and transmittance for the noninvasive measurement of tissue optical properties,”Appl. Opt.28(12), 2331 (1989).
13. L. Mei, G. Somesfalean, and S. Svanberg, “Pathlength determination for gas in scattering media absorption spectroscopy,”Sensors14(3), 3871–3890 (2014).
14. T. Svensson, E. Alerstam, J. Johansson, and S. Andersson-Engels, “Optical porosimetry and investigations of the porosity experienced by light interacting with porous media,”Opt. Lett.35(11), 1740–1742 (2010).
15. L. Mei, G. Somesfalean, and S. Svanberg, “Light propagation in porous ceramics: porosity and optical property studies using tunable diode laser spectroscopy,”Appl. Phys. A114(2), 393–400 (2014).
16. T. Svensson, E. Adolfsson, M. Lewander, C. T. Xu, and S. Svanberg, “Disordered, strongly scattering porous materials as miniature multipass gas cells,”Phys. Rev. Lett.107(14), 143901 (2011).
17. T. Svensson, E. Adolfsson, M. Burresi, R. Savo, C. T. Xu, D. S. Wiersma, and S. Svanberg, “Pore size assessment based on wall collision broadening of spectral lines of confined gas: experiments on strongly scattering nanoporous ceramics with fine-tuned pore sizes,”Appl. Phys. B: Lasers Opt.110(2), 147–154 (2013).
18. F. J. P. Schuurmans, “Strongly photonic macroporous gallium phosphide networks,”Science284(5411), 141–143
(1999).
19. J. Gómez Rivas, D. Dau, A. Imhof, R. Sprik, B. Bret, P. Johnson, T. Hijmans, and A. Lagendijk, “Experimental determination of the effective refractive index in strongly scattering media,”Opt. Commun.220(1-3), 17–21 (2003).
20. A. A. Kokhanovsky and E. P. Zege, “Scattering optics of snow,”Appl. Opt.43(7), 1589 (2004).
21. Q. Libois, G. Picard, M. Dumont, L. Arnaud, C. Sergent, E. Pougatch, M. Sudul, and D. Vial, “Experimental determination of the absorption enhancement parameter of snow,”J. Glaciol.60(222), 714–724 (2014).
22. C. F. Bohren and B. R. Barkstrom, “Theory of the optical properties of snow,”J. Geophys. Res.79(30), 4527–4535
(1974).
23. Q. Libois, G. Picard, J. L. France, L. Arnaud, M. Dumont, C. M. Carmagnola, and M. D. King, “Influence of grain shape on light penetration in snow,”The Cryosphere7(6), 1803–1818 (2013).
24. A. A. Kokhanovsky, Light scattering media optics (Springer Science & Business Media, 2004).
25. H. Zhang and S. Svanberg, “Laser spectroscopic studies of gas diffusion in alumina ceramics,”Opt. Express24(3),
1986–1998 (2016).
26. J.-P. Bouchard, I. Veilleux, R. Jedidi, I. Noiseux, M. Fortin, and O. Mermut, “Reference optical phantoms for diffuse optical spectroscopy. part 1–error analysis of a time resolved transmittance characterization method,”Opt. Express
18(11), 11495–11507 (2010).
27. S. M. Conger and D. M. McClung, “Comparison of density cutters for snow profile observations,”J. Glaciol.55(189),
![Fig. 1. Optical porosity of pharmaceutical tablets as a function of physical porosity reported by [14] for two groups of tablets with different granule sizes](https://thumb-eu.123doks.com/thumbv2/123doknet/13776875.439368/6.918.308.614.432.660/optical-porosity-pharmaceutical-function-physical-porosity-reported-different.webp)
![Fig. 2. Effective index of porous ceramics as a function of porosity reported by [15]](https://thumb-eu.123doks.com/thumbv2/123doknet/13776875.439368/7.918.308.609.139.366/fig-effective-index-porous-ceramics-function-porosity-reported.webp)