HAL Id: hal-01939689
https://hal.archives-ouvertes.fr/hal-01939689v2
Submitted on 5 Apr 2019HAL is a multi-disciplinary open access
archive for the deposit and dissemination of sci-entific research documents, whether they are pub-lished or not. The documents may come from teaching and research institutions in France or abroad, or from public or private research centers.
L’archive ouverte pluridisciplinaire HAL, est destinée au dépôt et à la diffusion de documents scientifiques de niveau recherche, publiés ou non, émanant des établissements d’enseignement et de recherche français ou étrangers, des laboratoires publics ou privés.
species from the Pyrenean mountain range
Agnès Burgers, Cédric Montero, Jordi Gené Sera, Marcel Vilches Casals,
Eduard Correal Modol, Patrick Langbour, Bernard Thibaut
To cite this version:
Agnès Burgers, Cédric Montero, Jordi Gené Sera, Marcel Vilches Casals, Eduard Correal Modol, et al.. Timber grading of pinus uncinata, a lesser known pine species from the Pyrenean mountain range. MADERAS: Ciencia y Tecnología, Universidad del Bío-Bío, 2018, 21 (2), pp.261-276. �10.4067/S0718-221X2019005000213�. �hal-01939689v2�
ISSN online 0718-221X DOI: 10.4067/S0718-221X2019005000213
TIMBER GRADING OF Pinus uncinata, A LESSER KNOWN PINE
SPECIES FROM THE PYRENEAN MOUNTAIN RANGE
Agnès Burgers1, Cédric Montero2,♠, Jordi Gené Sera2, Marcel Vilches Casals2, Eduard Correal Modol2,
Patrick Langbour3, Bernard Thibaut1
ABSTRACT
Timber grading is an essential step into the value process to determine wood usability for structural uses. It requires well-described characteristics obtained easily by taking non-destructive measurements to quantify reliable indicators of mechanical properties. In this paper we present an approach based on both timber scale and clear-wood scale measurements using the case of Mountain pine (Pinus uncinata).
An important experimental plan have been performed from collected trees of French and Spain Pyrenean regions allowing significantly the use of inter-correlations between measurements. The physical properties of clear wood present an important adaptation of tree growth condition with a lower modulus of elasticity as a consequence of microstructure at cell-wall level but a conventional modulus or rupture in bending for pines. However, the results on timber presents an important the difference between visual and machine grading for this species in view of mechanical properties considered. The results obtained also show possible improvement and limitations of current regulation in the grading mountain pine timber for structural use.
Keywords: Clear-wood properties, modulus of elasticity, modulus of rupture, mountain pine, variability.
INTRODUCTION
Pine species are very numerous in the forests of all continents and many of them are widely planted all over the world for structural uses (e.g. poles, carpentry, joinery, furniture) or for pulp and paper industry. Species like Pinus caribea, P.oocarpa, P.elliottii or P.patula are widespread in the tropics where those species account for 25% of all plantations. This proportion is even higher than 50% in boreal and temperate regions with species as Pinus radiata, P. sylvestris, P. pinaster, P. nigra, P. contorta (Brown 2000).
Mountain pine is a species belonging to the Pinus mugho complex that grows in the subalpine vegetation belt up to the upper forest limit (1000 - 2300m) in Western Europe (Heuertz et al. 2010). It is an important forest resource in terms of growing stock in the Pyrenean mountain range, in both southern France (FR-IFN-66-3 1994, Riou-Nivert 2015) and northern Spain. The trees are rather small in diameter (below 50 cm) which can be an asset in modern sawmills. However, this timber resource is both poorly valued by the forest industry and poorly described.
Literature concerning clear-wood pine properties and their links to growth parameters (ring width, juvenile wood, compression wood) is very abundant (Carson et al. 2014, Dumail et al. 1998, Harris and Meylan 1965, Ivković et al. 2008, Kang et al. 2005, Mazet and Nepveu 1991, Moore et al. 2015, Riesco-Muñoz et al. 2008, Roth et al. 2007, Watt et al. 2005), notably in the expansive volume (1660 pages) “Utilization of the southern
1Laboratoire de Mécanique et Génie Civil (LMGC), Univ. Montpellier, CNRS, Montpellier, France. 2Institut Català de la Fusta (INCAFUST), Solsona, Spain.
3CIRAD, BioWooEB, Montpellier, France.
262
pines” (Koch 1972) dealing with all aspects of pines from botany to timber processing.
In order to be used in structural applications, pine timber must be mechanically graded and conform to regulations such as the European standard for structural timber NF EN-338 (2016) and NF EN-384 (2016). Many studies, often unpublished, were conducted to promote this standard, but only a few were focused on pine species (Hanhijärvi et al. 2005, Moya et al. 2015, Nocetti et al. 2010).
The objective of this paper is to study the physical and mechanical properties of Pinus uncinata clear-wood as well as grading timber products according to the European standards for predicting clear-wood properties from easily obtainable non-destructive parameters.
MATERIAL AND METHODS Wood material
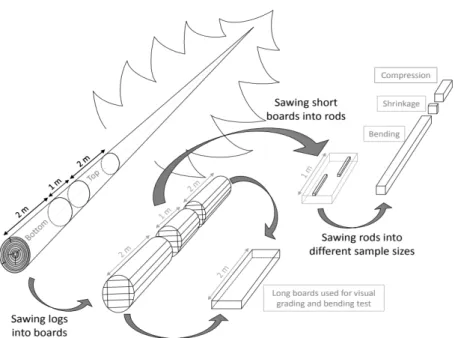
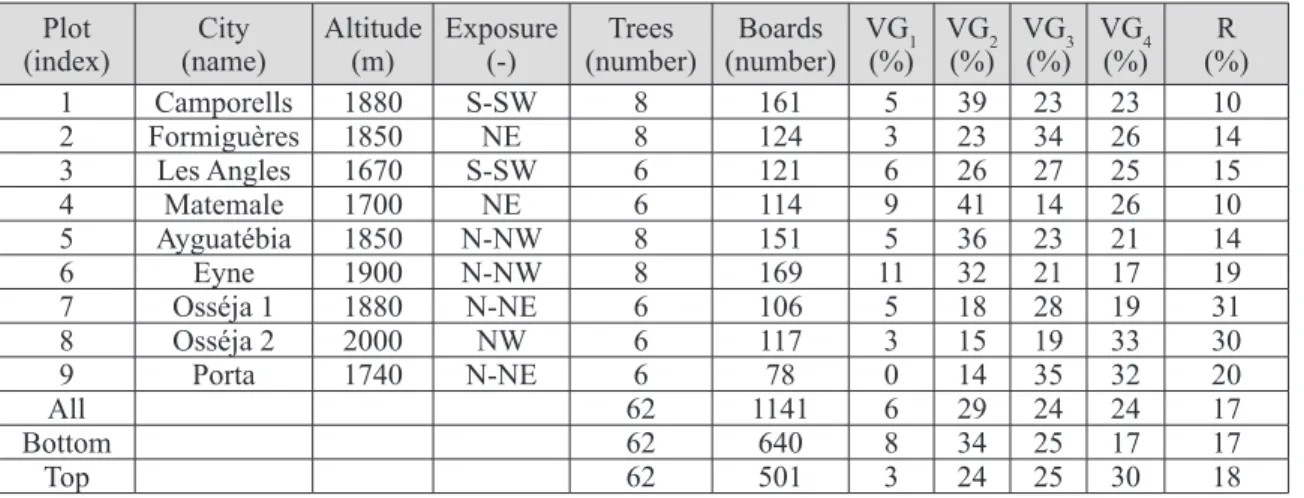
Sixty-two trees of Mountain pine (Pinus uncinata Ramond ex DC.) were harvested in nine representative forest plots (Table 1). For each tree a bottom log (2 m long), a middle log (1 m long) and a top log (2 m long) were crosscut (Figure 1). The logs were through-and-through sawn into 50 x 100 mm planks dried further in a conventional kiln to a mean moisture content of approx. 11%.
Figure 1: Sample preparation from tree to logs sawn to boards, rods and dedicated specimens for standard
Table 1: Provenance of trees and visual grading of boards.
Plot
(index) (name)City Altitude (m) Exposure (-) (number)Trees (number)Boards VG(%)1 VG(%)2 VG(%)3 VG(%)4 (%)R
1 Camporells 1880 S-SW 8 161 5 39 23 23 10 2 Formiguères 1850 NE 8 124 3 23 34 26 14 3 Les Angles 1670 S-SW 6 121 6 26 27 25 15 4 Matemale 1700 NE 6 114 9 41 14 26 10 5 Ayguatébia 1850 N-NW 8 151 5 36 23 21 14 6 Eyne 1900 N-NW 8 169 11 32 21 17 19 7 Osséja 1 1880 N-NE 6 106 5 18 28 19 31 8 Osséja 2 2000 NW 6 117 3 15 19 33 30 9 Porta 1740 N-NE 6 78 0 14 35 32 20 All 62 1141 6 29 24 24 17 Bottom 62 640 8 34 25 17 17 Top 62 501 3 24 25 30 18
Altitude (m), trees, boards, rods (number), VG 1 to 4 and R (% of total boards) with VG1 to VG4: visual grades of boards from best
(almost no defects) to worst (large knots) and R: rejected (mostly severe warping).
All 2 m long samples were graded using the French standard NF B 52-001-1 2011 employing four classes for visual grading (VG1 to VG4) based on combined criteria like ring width, knot diameter, position, splits, warp, rot etc. Boards that do not fulfil these criteria for any reason are rejected (R). Table 1 describes the differences in visual grading both for each plot and between bottom and top logs. Only the graded boards (945 in total) were used for the measurement of density and mechanical properties.
Ninety-eight short boards were selected to cover the whole range of densities and provenances (around 10 boards per forest plot). These boards were cut to clear wood specimens for mechanical and physical tests. From each board, one to three rods, a mean of two per board, were cut to obtain 183 clear wood rods, free of compression wood (450 mm x 20 mm x 20 mm in the L, R, T directions). Each rod was then cut into 3 sub-samples (Figure 1) for physical and mechanical measurements. These rods were placed in a climatic chamber with regulated standard conditions (20°C +/- 2°C, 65% +/- 5% RH).
Measurements on boards
Mass (M), length (L), width (W) and thickness (T) were measured on all boards and density was calculated using the ratio: D = M / (L*W*T), in kg/m3.
In order to measure both longitudinal MOE and MOR in the central third of the beam an edgewise bending test in accordance to the European standard NF EN-408 (2010) was performed on each board. Specific modulus (SM) for the board was calculated using the ratio: SM = MOE / D.
Shrinkage measurements on rods
Small wood cobbles measuring 10 mm x 20 mm x 20 mm (L, R, T) extracted from rods ends were measured to quantify ring width, mass, R and T dimensions on all these specimens at equilibrium moisture content in the standard climate. All samples were then fully saturated using a vacuum/pressure process. At that stage, mass (Msat), R, T dimensions (Rsat, Tsat) were measured. The samples were successively placed in hygroscopic equilibrium under three different climates leading to usual wood equilibrium moisture contents, 18%, 14%, 8%. They were finally dried completely in an oven at 103°C. At each moisture content i, mass (Mi), R and T dimensions (Ri, Ti) were measured and the RT area calculated as Ai = Ri*Ti.
At the end, the following parameters were calculated:
•
Basic density: BD = M0 / Vsat•
Moisture content at each state: Hi = (Mi - M0) / M0•
Total shrinkage: tangential shrinkage TS = (Tsat-T0) / Tsat, radial shrinkage RS = (Rsat-R0) / Rsat, area shrinkage AS = (Asat - A0) / Asat, volumetric shrinkage VS = AS + 0,002; 0,2% is taken as a unique value for longitudinal shrinkage (Glass and Zelinka 2010).•
Shrinkage anisotropy: SA = TS/RS264
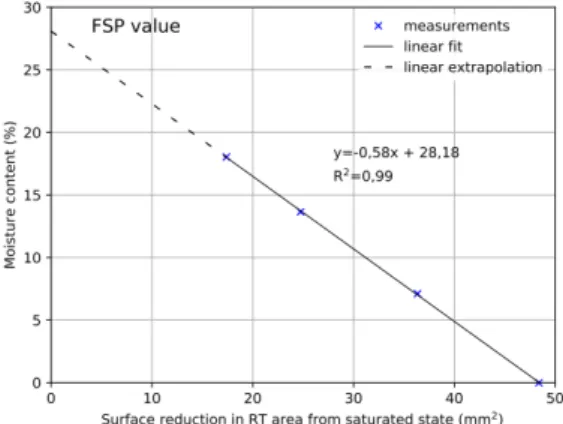
The fibre saturation point (FSP) is calculated as the intercept of the linear relationship Hi / ΔAi and the moisture content axis (Choong 1969) (Figure 2).
Figure 2: Fibre Saturation Point (FSP) calculation using surface variation. FSP is the intercept with the Y
axis, i.e. the constant value in linear regression.
Compressive strength
The sample dimensions were 60 mm x 20 mm x 20 mm (L, R, T). The mass and dimensions of the small rod were measured first and the specimen compressed between plates in a universal testing machine (Adhamel Lhomargy DY 36 of 100 kN capacity) until rupture in accordance with the French standard NF B51-007 (1985). The maximum force was recorded and the crushing strength (CS) was measured from that force and the transverse dimensions of the sample. The density of the sample (Dco) was also calculated for the sample under standard equilibrium moisture conditions.
Specific modulus
This measurement was carried out on long samples (360 mm x 20 mm x 20 mm, L, R, T directions) under standard equilibrium moisture conditions. The dimensions in the three directions and the mass of the specimen were measured. Each rod was placed in free vibration on elastic supports at the level of the first vibration mode in bending condition, induced by knocking one end of the rod. The values of the three highest resonance frequencies were recorded using a Fast Fourier Transform analysis. The specific modulus SM (m2/s2) was
calculated using the Timoshenko solution (Brancheriau and Baillères 2002).
1. The density of the sample (Dflex) was calculated using the values of the mass and dimensions of the rod. The longitudinal modulus of elasticity (MOE) was calculated as the product of density and specific modulus: MOE = Dflex*SM.
2. When the crushing strength and MOE are known, their ratio, SL = CS/MOE (SL: strain limit), is an interesting parameter which has the dimension of a strain. It is a lower limit for the real strain at rupture and can be considered as a proxy for the strain limit in compression for clear wood.
RESULTS General results and visual grading
Table 1 gives the results for visual grading and shows that 10% to 30% of the boards, according to plot, were rejected (17% at a mean, with low differences between top and bottom logs). The percentage of top class logs (VG1) is always low (6% at a mean, varying from 0% to 11% between plots) and the difference is remarkable between top (3,2%) and bottom (7,6%) logs. Among the classed boards, bottom logs generally give
higher grades (VG1 and VG2) than top logs.
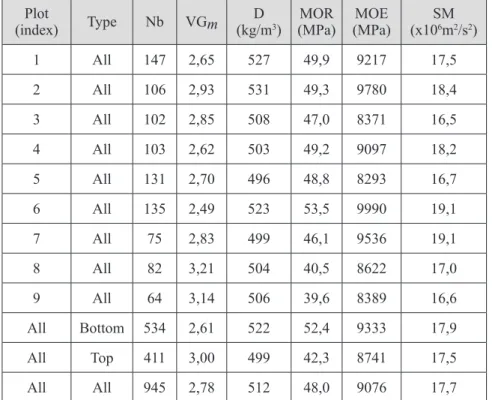
Table 2 and Table 3 give the results for the mean properties of the 945 boards that were not rejected. At plot level (Table 2), VGm is the mean value of visual notation (from 1 to 4), low values signifying better classification for the plot. There is consistent concordance between this mean visual classification and the mean strength (MOR) for the different plots, but this is not the case for mean density or mean stiffness of the boards (Table 3). The same concordance occurs between bottom and top logs: a 15% reduction in mean visual class (VGm) leads to a 20% reduction for mean MOR but only 6% for MOE, 4% for D and 2% for SM. From grade 4 to grade 1 there is a 33% increase in mean MOE or SM and 64% increase in mean MOR.
Table 2: Mean properties of graded boards per forest plot.
Plot
(index) Type Nb VGm (kg/mD 3) (MPa)MOR (MPa)MOE (x10SM6m2/s2)
1 All 147 2,65 527 49,9 9217 17,5 2 All 106 2,93 531 49,3 9780 18,4 3 All 102 2,85 508 47,0 8371 16,5 4 All 103 2,62 503 49,2 9097 18,2 5 All 131 2,70 496 48,8 8293 16,7 6 All 135 2,49 523 53,5 9990 19,1 7 All 75 2,83 499 46,1 9536 19,1 8 All 82 3,21 504 40,5 8622 17,0 9 All 64 3,14 506 39,6 8389 16,6 All Bottom 534 2,61 522 52,4 9333 17,9 All Top 411 3,00 499 42,3 8741 17,5 All All 945 2,78 512 48,0 9076 17,7
Nb: number of boards in the plot, VGm: mean of visual grade (1 to 4) for the boards in the plot, D: density in kg/m3, MOR: flexure
strength in MPa, MOE: modulus of elasticity in MPa, SM: specific modulus in 106m2/s2. Table 3:Mean properties of boards per visual grade.
VG Nb (kg/mD 3) (MPa)MOR (MPa)MOE (x10SM 6m2/s2)
1 65 515 62,8 10692 20,8 2 339 510 55,6 9876 19,3 3 280 516 44,4 8731 16,9 4 261 510 38,4 8004 15,7 1&2 404 511 56,8 10007 19,6 3&4 541 513 41,5 8381 16,3 All 945 512 48,0 9076 17,7
266
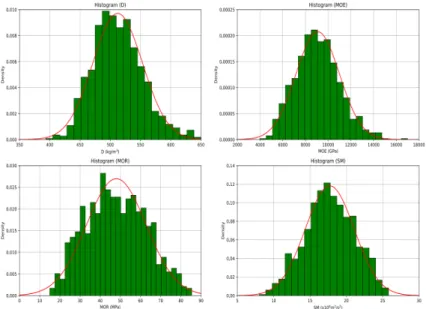
Histograms of D, MOR, MOE and SM (Figure 3) show that these values have a distribution close to a normal one.
Figure 3: Histograms of graded boards properties. Continuous line: normal distribution associated to the
population of boards.
Table 4 gives the correlation coefficient between properties of the all listed boards. There is a significant negative correlation between the visual grade and the mechanical properties of the boards. Density was not correlated to visual grade; however, there are also significant positive correlations between density, strength and stiffness. Variations in MOE help to predict 55% of MOR, which is rather usual in mechanical grading (Hanhijärvi et al. 2005, Srpčič et al. 2009).
Table 4: Correlation between board properties.
VG (kg/mD 3) (MPa)MOR (GPa)MOE (MPa/kg/mMOE/D 3)
VG 1 0,833 0,000 0,000 0,000 D (kg/m3) -0,007 1 < 0,0001 < 0,0001 0,389 MOR (MPa) -0,542 0,303 1 < 0,0001 < 0,0001 MOE (GPa) -0,452 0,407 0,739 1 < 0,0001 MOE/D (MPa/kg/m3) -0,497 0,028 0,685 0,921 1
Bold characters: significant correlation (here always better than 0,001).
Using a linear regression model between MOR and MOE a predictive formula for the 5-percentile (5% MOR) is found at 5% MOR=5,6858*MOE-23,15 (MOR in MPa, MOE in GPa). This formula ensures that less than 5% of experimental MOR remains below the predicted value.
Mechanical grading
European rules for structural timber, NF EN-338 (2016), NF EN-384 (2016) are based on characteristic values (5-percentile) for MOR, MOE and density that must be determined by experimental tests on at least 900 timber pieces. Classes named C14-C50, based on the 5-percentile MOR (14 MPa-50 MPa) give references
for both characteristic (5-percentile) and mean values for MOE and density (Table 5). The values for specific modulus (SM = MOE/D) and a tentative estimation of prices for each grade are added in Table 5.
Table 5: Reference values for 5-percentile and mean value (D and MOE) for softwood grades in NF EN-338
(2016).
MG 5% MOR 5% MOE 5% D MOEm Dm SM Unit price
(MPa) (GPa) (kg/m³) (GPa) (kg/m3) (x106m2/s2) €/m3
C14 14 4,7 290 7 350 20,0 150 C16 16 5,4 310 8 370 21,6 175 C18 18 6 320 9 380 23,7 200 C20 20 6,4 330 9,5 390 24,4 225 C22 22 6,7 340 10 410 24,4 250 C24 24 7,4 350 11 420 26,2 275 C27 27 7,7 370 11,5 450 25,6 300 C30 30 8 380 12 460 26,1 325 C35 35 8,7 400 13 480 27,1 350 C40 40 9,4 420 14 500 28,0 375 C45 45 10,1 440 15 520 28,8 400 C50 50 10,7 460 16 550 29,1 425
SM: specific modulus calculated as MOEm/Dm, Price: Estimation of putative prices for the different grades in €/m3.
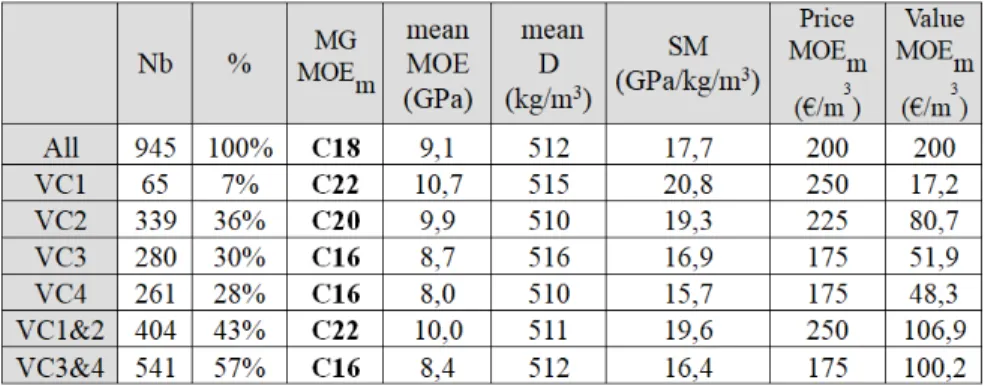
By using the table above, it is possible to propose a grading for all boards non-rejected by visual grading, or grade by grade, or by grouping the two best and the two worst grades (Table 6a and 6b). This was done using all characteristic values (left portion of the table) or using mean MOE instead of 5-percentile MOE.
Table 6a: Mechanical grading correlated to visual grading, using 5-percentile values only.
Nb % MOEMG 5% 5% MOR (MPa) 5% MOE (GPa) 5% D (kg/m3) Unit price (€/m3) Value (€/m3) All 945 100% C18 24,4 6,1 451 200 200 VC1 65 7% C27 44,9 7,8 446 300 20,6 VC2 339 36% C22 35,0 7,1 443 250 89,7 VC3 280 30% C18 24,4 6,1 454 200 59,3 VC4 261 28% C16 22,1 5,5 453 175 48,3 VC1&2 404 43% C22 36,3 7,2 443 250 106,9 VC3&4 541 57% C16 22,9 5,8 454 175 100,2
Legend as in Table 5. Value: product of unit price by percentage of the boards in the grade in €. Mean value is 200 €/m3 for all boards
graded C18, 218 €/m3 if all visual grades are mechanically graded, 207 €/m3 for grouping visual grades.
Table 6b: Mechanical grading correlated to visual grading, using mean MOE instead of its 5-percentile
values.
See legend of Table 6a. Mean value is 200 €/m3 for all boards graded C18, 198 €/m3 if all visual grades are mechanically graded, 207 €/
268
It should be noted that grade is always determined using MOE (5-percentile or mean value) and 5-percentile MOR remains well above the reference for each grade.
Taking all visually graded timber as a population, C18 grade can be applied both using characteristic or mean values for MOE. Hence the value will be 200 €/m3 for all the population.
Class by class (or grouping 2 classes), grading using mean MOE is more severe than grading using characteristic MOE values. Characteristic or mean density is always far above established references. Using grouped visual graded classes gives around 43% C22 (VG1 and VG2) together with 57% C16 (VG3 and VG4), with a mean putative value of 207 €/m3 which means only 3,5% more than without difference among visually
graded populations. The significance of this result remains to be determined.
Machine grading
Measuring both density and MOE of a board can be done either by flexure test (MOEf) or by vibration techniques (MOEv). MOEf gives the MOE for the central third of the board while MOEv gives the MOE for the entire board. The regression coefficient (r2) between the values obtained by both methods on the same
population of boards is usually above 0,8 and vibration method is used most often.
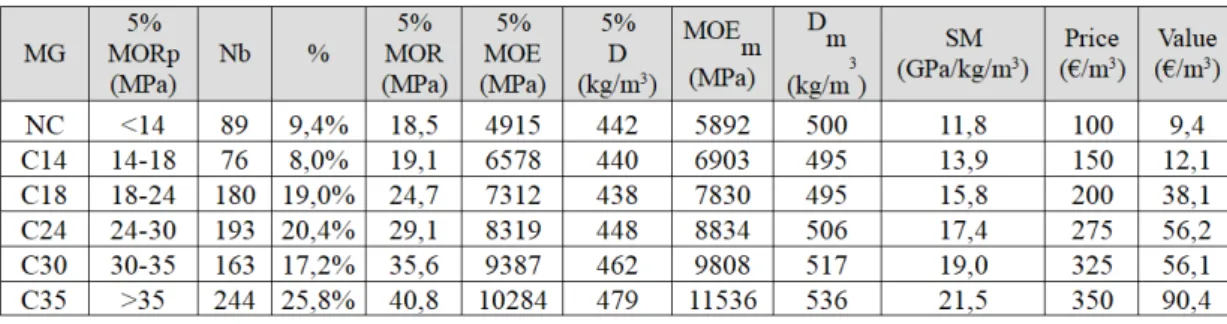
In order to grade the boards in this population, we use the predictive model for 5-percentile MOR based on MOEf measurements. Cxx grade is given for a softwood population having a predicted MOR above xx MPa. For each graded population, characteristic (5-percentile) and mean values are calculated for MOR, MOE and density (Table 7). In each graded population, characteristic values are well above standards but mean values for MOE are well below specified ones. With this machine grading, mean value for the population of boards (945 boards), using 100 €/m3 as the price for non graded boards (MOR <14 MPa), will be 262 €/m3, a value
30% higher than the C18 grade for all boards.
If mean MOE value for the population should necessarily be above specification, regardless of the machine grading, the solution is to grade all the visually graded population (without rejected pieces) in C18 class and machine grading becomes unnecessary. It should be noted that the mean specific modulus for mountain pine boards in the classes are very low when compared to the values in NF EN 338 (2016).
Table 7: Machine grading (NDT measurement of D and MOE) of the 945 boards, using 5-percentile
reference.
Same legend as Table 6a. Mean value is 262 €/m3 for this kind of machine grading. RESULTS FOR CLEAR WOOD RODS
Variability of parameters and properties
Table 8 gives the statistical description of these parameters. The rings are narrow (a mean of 1,6 mm), but ring width variations were rather large (CV = 47%), which is usual (Koch 1972, Zhang 1995). On the other hand, the density or basic density variations were low (CV < 10%), but the values were in the usual range for pine wood (Koch 1972, Kretschmann 2010). Variability for the specific modulus was higher (CV = 14%) than for density, with a twofold range in this sampling. But specific modulus has low values, nearly 20% lower than
the values for southern pines in the US (Kretschmann 2010). This is probably a result of adaptive growth due to windy conditions in these mountains (Telewski 1989).
Volumetric, tangential and radial shrinkage were within the usual range of values for pines (Glass and Zelinka 2010) and variability was much higher for radial shrinkage (CV = 19%) than it was for volumetric or tangential shrinkage. FSP had very low variability (CV = 5%) but its range was nonetheless from 25% to 30%, a range founded by Choong (1969) on sample of ten different pines growing in the southern US.
Variability in compressive strength was the lowest among mechanical properties, while MOE variability was significantly higher (19%). All mechanical properties were in the usual range for pines (Kretschmann 2010).
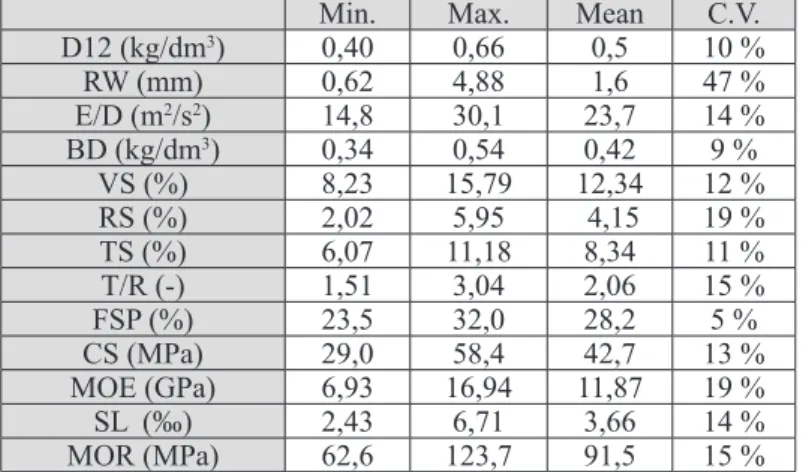
Table 8: Statistical description of parameters and properties for the 183 specimens of clear-wood.
Min. Max. Mean C.V. D12 (kg/dm3) 0,40 0,66 0,5 10 % RW (mm) 0,62 4,88 1,6 47 % E/D (m2/s2) 14,8 30,1 23,7 14 % BD (kg/dm3) 0,34 0,54 0,42 9 % VS (%) 8,23 15,79 12,34 12 % RS (%) 2,02 5,95 4,15 19 % TS (%) 6,07 11,18 8,34 11 % T/R (-) 1,51 3,04 2,06 15 % FSP (%) 23,5 32,0 28,2 5 % CS (MPa) 29,0 58,4 42,7 13 % MOE (GPa) 6,93 16,94 11,87 19 % SL (‰) 2,43 6,71 3,66 14 % MOR (MPa) 62,6 123,7 91,5 15 %
Min.: minimum value, Max.: maximum value, Mean: mean value, C.V.: coefficient of variation. D12: mean density (kg/dm3) in a
standard climate (20°C, 65% RH), RW: ring width (mm), SM: specific modulus (m2/s2), BD: basic density (kg/dm3), VS: volumetric
shrinkage (%), RS: radial shrinkage (%), TS: tangential shrinkage (%), T/R: shrinkage anisotropy, FSP: fibre saturation point (%), CS: compressive strength in longitudinal direction (MPa), MOE: modulus of elasticity in longitudinal direction (GPa), SL: strain limit from
compression test (‰), MOR: bending strength in longitudinal direction (MPa).
Correlation between parameters
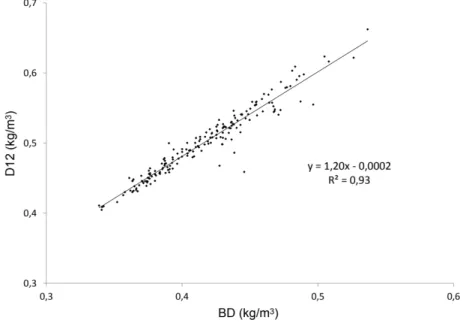
Table 9 gives the results of the correlation analysis. Significant correlation at levels better than 5% probability are very numerous, as expected for a large number of data in this field. The basic density (BD) and density at moisture equilibrium for the standard climate (D12) were very strongly correlated (R2=93%) in a proportional way (Figure 4) and the formula D12=1,2*BD can be used for these mountain pines.
270
Table 9: Correlation coefficients for clear-wood.
183 SP. D12 RW E/D BD VS RS TS R/T FSP CS MOE SL MOR
D12 1 93% 30% 37% 17% 21% 62% 41% 26% RW -0,25 1 6% E/D 0,190 -0,244 1 40% 37% 32% 14% 22% 75% 67% 13% BD 0,967 -0,012 0,119 1 21% 28% 11% 17% 58% 32% 24% VS 0,549 -0,105 0,635 0,461 1 82% 86% 31% 30% 42% 58% 19% 11% RS 0,609 -0,116 0,601 0,528 0,903 1 46% 72% 30% 48% 60% 16% 20% TS 0,415 -0,079 0,566 0,334 0,929 0,680 1 21% 26% 40% 17% T/S -0,463 0,083 -0,380 -0,406 -0,559 -0,846 -0,223 1 21% 27% 29% 19% FSP 0,094 0,168 0,140 -0,018 0,545 0,549 0,454 -0,458 1 CS 0,789 -0,174 0,467 0,759 0,644 0,692 0,506 -0,522 0,070 1 57% 29% MOE 0,642 -0,197 0,868 0,565 0,761 0,774 0,632 -0,537 0,169 0,757 1 48% 30% SL -0,110 0,106 -0,818 -0,021 -0,441 -0,399 -0,408 0,223 -0,166 -0,081 -0,693 1 MOR 0,513 -0,211 0,358 0,490 0,327 0,445 0,174 -0,434 -0,136 0,537 0,543 -0,213 1
See legend as in Table 8; bold numbers: correlation significant at the 5% level or better; bold numbers: R2 value over 50%.
Figure 4: Relationship between density and basic density
D12: mean density value measured under standard climate conditions on compression and bending tests. Among the parameters, although it had the highest C.V., ring width (RW) was not correlated to density. This has also been found for pines in natural stands with a ring width smaller than 3 mm (Koch 1972). Ring width was only significantly negatively correlated to the specific modulus (R2=6%). This kind of negative
correlation between ring width and specific modulus is usual in typical radial patterns of juvenile wood for softwoods (Lachenbruch et al. 2011) however in this case it is rather weak.
Density is only weakly correlated with the specific modulus and this is unusual for softwood. It may be the result of the following: i) a very small ring width in general and ii) a small radial expansion of juvenile wood for these slow growing trees.
Correlation between properties
Among the shrinkage properties there were the usual strong links (R2>80%) between volumetric and transverse shrinkage, but a rather weak link between radial and tangential shrinkage (R2=46%). Moreover, radial shrinkage variations explained most of the shrinkage anisotropy (R2=72%).
Despite its low level of variability, FSP was correlated with all the shrinkage properties and a rather high coefficient of determination (R2=21% to 30%) was observed.
As expected there was very significant positive correlation between MOE and CS. The strain limit was very strongly negatively correlated with SM (and to a lesser extend to MOE as a consequence), which is the case for flexure wood (Telewski 1989).
Correlation between parameters and mechanical properties
Looking at the relationship between parameters (ring width, density, and specific modulus) and mechanical properties, there were highly significant correlations (P<0,1%) for both density and specific modulus as related to the mechanical properties, except for the strain limit (which depends only on specific modulus). On the other hand, ring width only had a slightly significant negative correlation with mechanical properties, CS (P<5%) and MOE (P<1%), which is not usual for pines (Zhang 1995).
Density had the best coefficient of determination for strength properties: 76% (D) compared to 22% (SM) for CS. On the other hand, the specific modulus was the best for stiffness and flexibility: 75% (SM) compared to 41% (D) for MOE, 67% (SM) compared to 1% (D) for the strain limit. The fact that the specific modulus had a better determination coefficient than density for MOE in this experiment was merely a consequence of the greater variations in specific modulus (higher C.V.).
Correlation between parameters and shrinkage
There was no significant correlation between ring width and shrinkage except for a slightly positive significant correlation with FSP (5% level).
There were highly significant correlations (P<0,1%) for density (positive) and specific modulus (negative) with all shrinkage properties except for FSP. The specific modulus had the best coefficient of determination for shrinkage properties (except for shrinkage anisotropy). Models of wood behaviour based on cell wall structure also explain the influence of these two parameters (Cave 1968, Neagu and Gamstedt 2007, Yamamoto et al. 2001).
The primary wall (P) and S1 layer of the secondary wall while very thin have microfibril orientation nearly perpendicular to the tracheid direction and will limit transverse shrinkage (Abe and Funada 2005, Donaldson and Xu 2005). On the other hand, the S2 layer is thick and the microfibrils limit longitudinal shrinkage more than transverse shrinkage. The thicker is the S2, the lower will be the efficiency of the P+S1 layer in limiting transverse shrinkage, thus explaining the positive influence of density on transverse shrinkage.
An increase in MFA in the S2 layer (lower values for the specific modulus) induces a restriction of transverse shrinkage in that layer and thus a lessening of global transverse shrinkage, regardless of the thickness (and density) of S2. The respective influence of the density and specific modulus on shrinkage variation will depend on both the C.V. of each layer (pure mathematical effect) and on the structural organisation of the cell wall.
Prediction of properties by parameters
Ring width, density and specific modulus are parameters that are easy to measure by non-destructive techniques such as X-ray tomography and vibration or ultrasound techniques (Freyburger et al. 2009, Van Den Bulcke et al. 2009). These parameters are also linked to the wood formation inside of the tree during cambial activity and cell wall thickening.
The different properties were predicted by stepwise linear regression. The combined influence of density and specific modulus can be additive or multiplicative (as for MOE) as a result, the product between these two parameters was introduced as an option in the analysis.
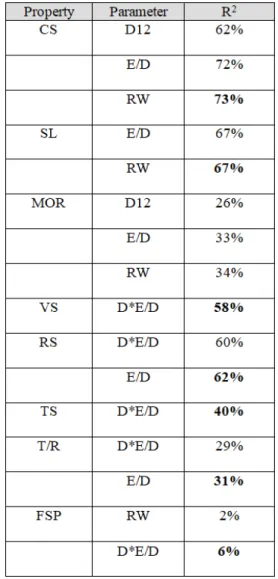
Table 10 gives the global results of these regression calculations providing for each property, the parameter involved with its entry rank and the cumulative determination coefficients (R2) obtained after each addition of a parameter (F to enter 0,05; F to remove 0,1).
272
Table 10: Prediction of properties for clear-wood See legend as in Table 8, bold characters: best prediction.
Compressive strength was well predicted using density and specific modulus alone (R2=73%), with ring
width contributing very little to variability. Strain limit was also well predicted by the specific modulus alone (R2=67%).
The product of density and specific modulus (MOE) was the best predictor of all shrinkage properties, often alone (VS and TS) and sometimes with a small contribution (less than 2%) from the specific modulus per se. Radial and volumetric shrinkage were rather well predicted (R2=62% and 58%) but tangential shrinkage and
shrinkage anisotropy were poorly predicted by the parameters (R2=40% and 31%). In pine wood, variations in
tracheid geometry follows a radial trend so that the successive hard and soft layers of late and early wood act as serial components for radial shrinkage, while they acting as parallel components for tangential shrinkage. In a study to predict anisotropic shrinkage of softwood (Pang 2002) found that radial shrinkage grows linearly with the proportion of late wood in the ring width, like mean density, while tangential shrinkage is mostly dependent on the late wood density value.
FSP could not be predicted (R2=6%). FSP describes the maximum amount of bound water of the cell wall.
MFA. The occurrence of extractives in pine is rather frequent (Choong 1969) and varies substantially between a single tree and within individual trees. It could be a major factor accounting for both FSP and shrinkage variations in addition to hemicellulose content variations between species.
CONCLUSIONS
Mountain pine in the Pyrenean mountain range is slow growing wood species with small ring width (below 4 mm) and a mean density of 500 kg/m3 showing few variations within a large population of timber
representative of the forest resource.
For clear wood specimens, density and specific modulus enable accurate prediction of mechanical properties, but less accurate prediction of shrinkage.
Specific modulus measured on boards or on clear wood specimens is much lower than usual for pine species, probably as an adaption of tree growth to windy conditions. As a result, MOE and shrinkage are low while MOR values are more typical. Such a description can be induced by higher MFA in tracheid cell walls.
After visual grading, grouping of the two best French visual grades allows the use of the C22 mechanical grade and the C16 grade for the grouping of the two worst grades.
Grading mountain pine timber by non-destructive MOE measurement, regarding the 5-percentile for MOR, MOE and density together, allows the separation of populations of rather high grade (C24 to C35) making this machine grading highly profitable.
Surprisingly, for MOE alone, it is not the 5-percentile but the mean MOE for the tested population that is required in the final regulation. In this case, machine grading is not applicable since the mountain pine timber would only be down-graded.
Given the empirical evidence there should be a reassessment about this regulation to account for traditional softwood forests made of Spruce and Scots Pine having a typical range of correlated values for density and specific modulus (or MFA) as these characteristics may not be the displayed in different forest populations. The use of 5-percentile in MOE appears to be as safe as the use of mean MOE and provide a viable alternative to the procedures specified by current regulations.
ACKNOWLEDGEMENTS
The authors would like to acknowledge Daniel Guibal and Jean Gérard from research unit BioWooEb CIRAD for their skillful and extensive help.
This research is a part of the Unci-Plus project made in the Programme Opérationnel de Coopération Territoriale Espagne-France-Andorre (POCTEFA) 2007-2013.
This work has also been supported thanks to the support of the LabEx NUMEV project on Digital and Hardware Solutions and Modeling for the Environement and Life Sciences (N° ANR-10-LABX-20) funded by the «Investissements d’Avenir» French Government program, managed by the French National Research Agency (ANR).
274
REFERENCES
Abe, H.; Funada, R.2005. Review - The orientation of cellulose microfibrils in the cell walls of tracheids
in conifers. IAWA J 26 (2) : 161-174.
Brancheriau, L.; Baillères, H. 2002. Natural vibration analysis of clear wooden beams: a theoretical
review. Wood Sci Technol 36 (4) : 347-365.
Brown, C. 2000. The global outlook for future wood supply from forest plantations. Global Forest Products
Outlook Study, Working Paper n.3, Food and Agriculture Organization of the United Nations (FAO), 1-156.
Carson, S.D.; Cown, D.J.; Mckinley, R.B.; Moore, J.R. 2014. Effects of site, silviculture and seedlot on
wood density and estimated wood stiffness in radiata pine at mid-rotation. New Zealand J For Sci 44 (1) : 26.
Cave, I.D. 1968. The anisotropic elasticity of the plant cell wall. Wood Sci Technol 2 (4) : 268-278. Choong, E.T. 1969. Effect of extractives on shrinkage and other hygroscopic properties of ten southern
pine woods. Wood Fiber Sci 1 (2) : 124-133.
Donaldson, L.; XU, P. 2005. Microfibril orientation across the secondary cell wall of radiata pine
tracheids. Trees 19 (6) : 644-653.
Dumail, J.F.; Castéra, P.; Morlier, P. 1998. Hardness and basic density variation in the juvenile wood of
maritime pine. Ann For Sci 55 (8) : 911-923.
Freyburger, C.; Longuetaud, F. Mothe, F.; Constant, T.; Leban, J.M. 2009. Measuring wood density
by means of X-ray computer tomography. Ann For Sci 66 (8) :804-804.
FR-IFN-66-3. 1994. Inventaire forestier national, Département des Pyrénées Orientales : résultats du
troisième inventaire forestier (1989-1990). Ministère de l’Agriculture et de la Pêche. France.
Glass, S.V.; Zelinka, S.L. 2010. Moisture relations and physical properties of wood (chapter 4), in: Wood
Handbook, Wood as an Engineering Material. Forest Products Laboratory. General Technical Report
FPL-GTR-190. Madison, WI: U.S. Department of Agriculture, Forest Service, Forest Products Laboratory: 508 p. 2010.
Hanhijärvi, A.; Ranta-Maunus, A.; Turk, G. 2005. Potential of strength grading of timber with combined
measurement techniques. VTT Publications 568. Report of the Combigrade-project - Phase 1. VTT.
Harris, J.M.; Meylan, B.A. 1965. The influence of microfibril angle on longitudinal and tangential
shrinkage in Pinus radiata. Holzforschung 19 (5) : 144-153.
Heuertz, M.; Teufel, J.; González-Martínez, S.C.; Soto, A.; Fady, B.; Alía, R.; Vendramin, G.G. 2010. Geography determines genetic relationships between species of mountain pine (Pinus mugo complex) in
western Europe. J Biogeogr 37 (3): 541-556.
Ivković, M.; Gapare, W.J.; Abarquez, A.; Ilic, J.; Powell, M.B.; Wu, H.X. 2008. Prediction of wood
stiffness, strength, and shrinkage in juvenile wood of radiata pine. Wood Sci Technol 43 (3): 237.
Kang, K.Y.; Zhang, S.Y.; Mansfield S.D. 2005. The effects of initial spacing on wood density, fibre and
pulp properties in jack pine (Pinus banksiana Lamb.). Holzforschung 58 (5): 455-463.
Koch, P. 1972. Utilization of the Southern Pines. Volume 1. Agriculture Handbook n.420, Unites State
Department of Agriculture Forest Service, USA, 1-744.
Kretschmann, D.E. 2010. Mechanical properties of wood (chapter 5), in: Wood Handbook, Wood as an
Engineering Material. Forest Products Laboratory. General Technical Report FPL-GTR-190. Madison, WI:
U.S. Department of Agriculture, Forest Service, Forest Products Laboratory: 508 p. 2010.
Woody Plants, and Hypotheses for its Occurrence, in: Meinzer, F.C.; Lachenbruch, B.; Dawson, T.E. (Eds.). ,
Size- and Age-Related Changes in Tree Structure and Function. Springer Netherlands, Dordrecht, pp. 121-164.
Mazet, J.F.; Nepveu, G. 1991. Relations entre caractéristiques de retrait et densité du bois chez le pin
sylvestre, le sapin pectiné et l’épicéa commun. Ann For Sci 48 (1) : 87-100.
Moore, J.R.; Cown, D.J.; Mckinley, R.B.; Sabatia, C.O. 2015. Effects of stand density and seedlot on
three wood properties of young radiata pine grown at a dry-land site in New Zealand. New Zealand J For Sci 45 (4) : 1-15.
Moya, L.; Cardoso, A.; Cagno, M.; O´Neill, H. 2015. Structural characterization of pine lumber from
Uruguay. Maderas-Cienc Tecnol 17 (3) : 597-612.
Neagu, R.C.; Gamstedt, E.K. 2007. Modelling of effects of ultrastructural morphology on the hygroelastic
properties of wood fibres. J Mater Sci 42 (24) : 10254-10274.
NF B 52-001-1. 2011. Règles d’utilisation du bois dans la construction - Classement visuel pour l’emploi
en structures des bois sciés français résineux et feuillus - Partie 1 : bois massif.
NF EN-338. 2016. Bois de structure - Classes de résistance.
NF EN-384. 2016. Bois de structure - Détermination des valeurs caractéristiques des propriétés mécaniques
et de la masse volumique.
NF EN-408. 2010. Structures en bois - Bois de structure et bois lamellé-collé - Détermination de certaines
propriétés physiques et mécaniques.
NF B51-007. 1985. Bois - Essai de compression axiale.
Nocetti, M.; Bacher, M.; Brunetti, M.; Crivellaro, A.; Van De Kuilen, J.W.G. 2010. Machine grading
of Italian structural timber: preliminary results on different wood species, in: Proceedings of the World Conference on Timber Enginnering (WCTE).
Pang, S. 2002. Predicting anisotropic shrinkage of softwood. Part 1: Theories. Wood Sci Technol 36 (1) :
75-91.
Riesco-Muñoz, G.; Soilán-Cañas, M.A.; Roíguez-Soalleiro, R. 2008. Physical properties of wood in
thinned Scots pines (Pinus sylvestris L.) from plantations in northern Spain. Ann For Sci 65 (5) : 507-507.
Riou-Nivert, P. 2015. Les résineux, tome 3 : bois, utilisation, économie. CNPF, Institut pour le
Développement Forestier (IDF), France.
Roth, B.E.; Li, X.; Huber, D.A.; Peter, G.F. 2007. Effects of management intensity, genetics and planting
density on wood stiffness in a plantation of juvenile loblolly pine in the southeastern USA. For Ecol Manag 246 (2) : 155-162.
Srpčič, S.; Srpčič, J.; Saje, M.; Turk, G. 2009. Mechanical analysis of glulam beams exposed to changing
humidity. Wood Sci Technol 43 (1-2) : 9-22.
Telewski, F.W. 1989. Structure and function of flexure wood in Abies fraseri. Tree Physiol 5 (1) : 113-121. Van Den Bulcke, J.; Boone, M.; Van Acker, J.; Stevens, M.; Van Hoorebeke, L. 2009. X-ray tomography
as a tool for detailed anatomical analysis. Ann For Sci 66 (5) : 508.
Watt, M.S.; Downes, G.M.; Whitehead, D.; Mason, E.G.; Richardson, B.; Grace, J.C.; Moore, J.R. 2005. Wood properties of juvenile Pinus radiata growing in the presence and absence of competing understorey
vegetation at a dryland site. Trees 19 (5) : 580-586.
Yamamoto, H.; Sassus, F.; Ninomiya, M.; Gril, J. 2001. A model of anisotropic swelling and shrinking
276
Zhang, S.Y. 1995. Effect of growth rate on wood specific gravity and selected mechanical properties in