HAL Id: hal-02922025
https://hal.archives-ouvertes.fr/hal-02922025v2
Preprint submitted on 26 Aug 2020
HAL is a multi-disciplinary open access
archive for the deposit and dissemination of
sci-entific research documents, whether they are
pub-lished or not. The documents may come from
teaching and research institutions in France or
abroad, or from public or private research centers.
L’archive ouverte pluridisciplinaire HAL, est
destinée au dépôt et à la diffusion de documents
scientifiques de niveau recherche, publiés ou non,
émanant des établissements d’enseignement et de
recherche français ou étrangers, des laboratoires
publics ou privés.
properties of a recycled polymer composite material as a
function of the filler size
Togbé Armel Amadji, Edmond Adjovi, Jean Gérard, Jonathan Barés, Vincent
Huon
To cite this version:
Togbé Armel Amadji, Edmond Adjovi, Jean Gérard, Jonathan Barés, Vincent Huon. Experimental
investigation on physical and mechanical properties of a recycled polymer composite material as a
function of the filler size. 2020. �hal-02922025v2�
Experimental Investigation on Physical and Mechanical Properties
of a Wood Plastic Composite Based on Glue from a Simple
Polystyrene Waste Dissolution Process
T. Armel AMADJI
1, Edmond C. ADJOVI
2, Jean GÉRARD
3, 4, Jonathan BARÉS
5,
Vincent HUON
5
1 Laboratoire d’Energétique et de Mécanique Appliquée, Université d’Abomey-Calavi, 01 BP 2009, Cotonou, Bénin.
2 Ecole des Sciences et Techniques du Bâtiment et de la Route, Université Nationale des Sciences Technologies Ingénierie et
Mathématiques, B.P.2282 Goho, Abomey, Bénin.
3 CIRAD, UPR BioWooEB, 34398 Montpellier, France. 4 BioWooEB, Univ Montpellier, CIRAD, Montpellier, France. 5 LMGC, Université de Montpellier, CNRS, Montpellier, France.
amadjitarmel@gmail.com (T. A. AMADJI), adjed2012@gmail.com (E. C. ADJOVI), jean.gerard@cirad.fr (J. GÉRARD), Jonathan.bares@umontpellier.fr (J. BARÉS), vincent.huon@umontpellier.fr (V. HUON).
To cite this article:
T. A. Amadji, E. C. Adjovi, J. Gérard, J. Barés, V. Huon, 2020. Experimental investigation on physical and mechanical
properties of a wood plastic composite based on glue from a simple polystyrene waste dissolution process.
xxx.xxxxxxxx.xx xxx.xxxxxxxx >
Abstract:
This study examines the properties of a composite manufactured through an efficient process of polystyrene waste dissolution, suitable for use in developing countries where material from waste recycling and inexpensive technology represents an environmental and economic potential. Tensile and compressive elastic and rupture characteristics are evaluated depending on particle size of teak wood sawdust. Additionally, density, thickness swelling and water absorption capacity were also tested. Scanning electronic microscopy revealed non-uniform adhesion between wood particles and polystyrene matrix. Results show that mechanical properties decreased with increase in wood particle size, mainly due to residual presence of solvent that doesn’t promote interfacial adhesion between phases. They could then be improved if consideration is given to removing the solvent from it. Strong correlations of porosity with physical properties and particle size were also evidenced. Water absorption and thickness swelling were low, which makes the composite favorable for use in contact with water.Keywords:
dissolution process, recycled wood-polystyrene composite, porosity, water absorption, tensile, compression properties1. Introduction
For several decades, wood plastic composites (WPCs) have been the subject of numerous scientific studies and applications in various technological fields. The enthusiasm for these polymer materials filled with natural fillers stems from a need for more versatile polymer-based materials and a growing interest in environmental issues [1]. Using WPCs as a solution for environmental problems is achieved by recycling or reusing compasses polyethylene, polypropylene, polystyrene, etc.
Polystyrene (PS) is a plastic with multiple uses, including industrial, packaging and household applications [1-3]. Due
to its mechanical properties, chemical stability and thermal insulation capacity, PS is increasingly being used [4]. PS is produced in various forms (extruded, high impact, expanded, etc.) and is one of the most widespread polymers in the world
[5], such that the considerable volume of waste generated makes recycling essential.
The recycling or reuse of expanded polystyrene (EPS) has been the subject of much scientific work and several methods exist. Of those methods, chemical recycling is practiced [6]. Chemical recycling is a way of recovering PS by dissolving it in an organic solvent, thus solving the problem of low density by achieving a several ten-fold volume reduction [5, 7-9]. This method was used by Agoua et al. [10], to develop a wood polystyrene composite material (WPoC). The method
follows a specific matrix formulation and shaping process. The formulation of the matrix used by these authors[10], made it possible to obtain both, a glue by dissolving the EPS in a solvent (petrol), and a composite by mixing the glue with sawdust. The choice of this technique was motivated by several reasons. First, the technique was accessible and adapted to the realities of the environment (Republic of Benin). Then, the matrix obtained by the dissolution of the EPS in the solvent (petrol), was glue whose proven adhesive capabilities had given rise to its use in the daily practices of the craftsmen in western Africa. Lastly, the volatilization of the solvent conditioning the mechanical performance of the WPoC minimized the risk of toxicity once it was in service.
The shaping process of the WPoC (sawdust + EPS glue) in its expanded state was carried out through cold molding compression. For such a process, the objective is often to reduce the porosity in the material, to pass from an expanded state, non-compact (of no mechanical interest) with high porosity to the compact state with low porosity. This is necessary because the porosity inside the material affects its physical and mechanical properties [11, 12]. However, porosities in plant-reinforced composites are unavoidable due
to intra and inter-particle porosities induced by the intrinsic cellular structure of wood particles whose cellular lumens including voids [13]. They vary depending on the type of plant, agglomeration during mixing, the pressure applied during manufacture and the air bubbles that remain trapped in the matrix [12, 14].
So far, few works were achieved about WPoC. Agoua et al.
[10] studied thermal conductivity of the composite varying
species, particle size and content. Later, by molding process, other authors [15] made a composite based on date palm fibers and chemically recycled polystyrene, and experimentally studied its thermal conductivity and flexural behavior. The work of these authors [15] has evidenced the influence of the proportion of matrix on the flexural and some physical properties of the composite. With the consistency of the material, Agoua et al. [10] suspected that the material could be suitable for various uses as ceiling, board, parts of furniture or layers of a new organic sandwich type material. Then, a better knowledge of these WPoC material properties was paramount for its good use and promotion in developing countries where access to high-tech materials is limited and where recycling of waste is an issue. However, no specific knowledge was available about the mechanical behavior and particularly the tensile and compression properties of the WPoC. Moreover, the effect of porosity on the properties such material, depending on the wood particle size, remains scarcely known.
The present work set out to study some key physical properties (density, porosity, water absorption, thickness swelling) and mechanical properties (elastic and rupture characteristics in tension and compression) of the WPoC made from polystyrene + solvent (petrol) matrix and particles of teak wood, following a uni-variate sampling (granulometry). This study is part of a series of studies devoted to controlling and improving the physical and mechanical properties of WPoC, in order to use it as
construction material in developing countries like Benin.
2. Materials and Methods
2.1. Basic materials
The expanded polystyrene packaging (EPS) used in this study was collected from motorcycle and household appliance stores, in the city of Cotonou and from the waste dumps of the Valdera center of the University of Abomey-Calavi. They were cleaned from all impurities and reduced to pieces smaller than 5 cm. The solvent used is the same as the one used by Agoua et al. [10].
The sawdust used in this work was made from teak wood (Tectona grandis), obtained from the «Office National du Bois (ONAB) », the largest teak processing company in the Republic of Benin. Its grain size curve presented in Fig.1
shows that it constituted mainly (more than 90%) of particles measuring between 0.16mm and 2.5mm. Four granular classes were selected for the current study as presented in Table 1. They are previously dried in an oven at 105 ± 2 ° C up to anhydrous state (constant mass). They are then packaged, in order to preserve their anhydrous state and thus, to prevent the adverse effect of water at the plastic wood interface [12].
Figure 1. Grain size curve of sawdust used.
Table 1. Identification of samples
*This is also considered in the present study as nominal size of particles, when curve construction is needed.
2.2. Composite preparation and sampling
Dissolving pieces of EPS in petrol gives glue, serving as a matrix for the composite [10]. An optimum ratio of solvent
0 20 40 60 80 100 1 10 Pro po rt io n of cum ulat iv e pa ss er s-by (%) Opening of sieve(mm)
Size t of particles (mm) *Opening of sieves (mm) Code of samples 0.160 ≤ t < 0.315 0.160 Cg160 0.315≤ t < 0.630 0.315 Cg315 0.630 ≤ t < 1.250 0.630 Cg630 1.250 ≤ t < 2.500 1.250 Cg1250 01 0. 0.1
mass / polystyrene mass = 1.22 is used. The need for an optimal dosage of petrol as the solvent comes from Osemeahon et al. [16]. This ratio has been experimentally determined and makes it possible to minimize the quantity of petrol, volatile solvent, whose evaporation governs the time taken for the mass to stabilize and the composite to harden.
The composite was made by mixing the matrix (EPS glue) with particles of wood. The mixture was made using a Hobart type mixer in order to guarantee the homogeneity of the composite. Four samples were formulated on the basis of four different granular classes Cg160, Cg315, Cg630 and Cg1250 (Table 1), for a mass proportion of 40% of wood particles in the composite.
The mixtures, in the expanded state, were spread in the open air for 20 minutes to gently solidify and prevent leakage from the mold material during casting and allow demolding without clogging. Casting was carried out using a mechanical press and a mold with internal dimensions of 40 x 140 x 571 mm3. A cold compression is applied under a stress of 5 MPa
in order to preserve the integrity of the wood particles but also to limit the stresses exerted on the mold. This stress was maintained for 5 min to allow good distribution of the composite in the mold. After demolding, the 10 mm thick plates obtained were air-dried under ambient conditions for 30 days (stabilized mass).
2.3. Characterization
2.3.1. Measurement of sample densities and porosity
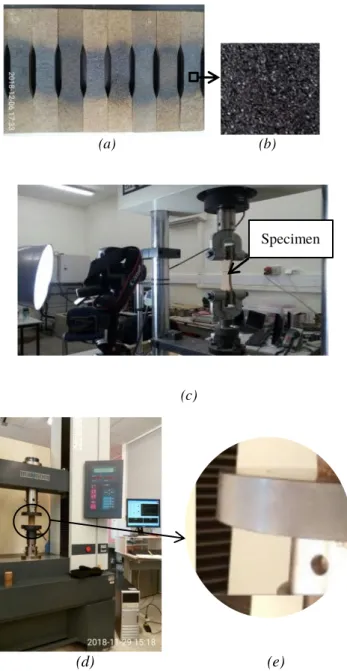
For each sample, the bulk density, particulate density and porosity were determined. Six specimens per sample were used. The mass of the specimens was determined using a Mettler AE 160 digital scale, accurate to 0.0001g (Fig. 2.a).
The particulate density 𝜌𝑝, was determined as the ratio of
the mass of the sample to the volume occupied by the material. This volume, which was the total volume of the sample minus the volume occupied by the pores, was determined using a gas (helium) displacement pycnometer, AccuPyc II 1340 model, with a sample cell of 10 cm3 (Fig.
2.b). These specimens were previously dehumidified in a silica gel desiccator. For each specimen, 20 volume measurement cycles were performed. The arithmetic mean of the densities and the associated standard deviation were calculated, for each sample.
The bulk density 𝜌𝑏 was determined as the ratio of the
mass of the sample by its volume of envelope. The envelope volume or total volume was determined using Archimedes’ principle. The arithmetic mean and the standard deviation of the densities were then determined for each sample.
The porosity of a material expresses the proportion of voids in it, relatively to its total volume and therefore, it is equal to the relative difference between the bulk and particulate densities. For each specimen of different samples, the porosity p (as a percentage) was calculated according to the formula:
𝒑(%) = 𝟏𝟎𝟎 (𝟏 −
𝝆𝒃𝝆𝒑
)
(1)
The arithmetic means of different samples were determined, then the associated standard deviations werecalculated using equation (2):
∆𝒑 = 𝒑 . *(
∆𝝆𝒃 𝝆𝒃)
𝟐+ (
𝝆𝒃.∆𝝆𝒑 𝝆𝒑𝟐)
𝟐+
𝟏/𝟐(2)
(a) (b)Figure 2. (a) Digital balance; (b) Gas displacement
pycnometer with silicagel dessicator.
2.3.2. Measurement of absorption and thickness swelling
Water absorption and thickness swelling were determined according to ASTM D 1037-12. Six specimens per sample, measuring 152 × 152 mm² × original plate thickness, were immersed in water at a temperature of 20 ± 1 °C. The measurements (mass, volumes and dimensions) were taken after 2h and 24h. The water absorption (or thickness swelling) of each specimen was calculated as the percentage of increase in mass (or thickness, respectively) relatively to initial mass (or thickness, respectively).
2.3.3. Characterization of the samples in tension
The tensile test was performed according to ASTM D 1037-12. By machining, six specimens per sample taking the form and dimensions specified by the standard were taken from the manufactured plates. The test is performed on a computer-controlled MTS-type machine that records the values of the loads under applied displacement. The test speed used is 2mm / min.
In order to determine the elastic characteristics of the material (modulus of elasticity and Poisson's ratio), an analysis of the displacement field was carried out using digital image correlation. This method is used because it is simple to implement and relatively inexpensive [17]. To that end, textured paint (marker) was deposited on the surface of the test specimen (Fig. 3.a) to enrich the natural texture when necessary (Fig. 3.b); this operation was done for all the
Sample
samples, except Cg160 whose fine texture was already appropriate. The test set-up used consisted of the specimen mounted on the test machine, illuminated by a lamp and photographed at a time step of one (01) second using a Reflex-type device (CANON 80D), (Fig. 3.c). The field of displacement was determined and the modulus of elasticity and Poisson's ratio, were calculated by means of a computer program written under Python by the Laboratory of Mechanics and Civil Engineering (LMGC) in Montpellier (France) [18].
The maximum stress is calculated according to the following formula:
𝝇
𝒕 𝒎𝒂𝒙=
𝑭𝒕 𝒎𝒂𝒙𝒆.𝒍(3)
where :
𝜎𝑡 𝑚𝑎𝑥: maximum tensile stress, in MPa
𝑒 : thickness of the specimen, in mm 𝑙 : width of the specimen, in mm
𝐹𝑡 𝑚𝑎𝑥 : maximum load, in N.
2.3.4. Characterization of the samples in compression
The specimens (at least 3 specimens per sample) used for the compression test were cylindrical in shape (diameter varying between 43 and 45 mm, height = 90 mm). As for the tensile specimens, they were tested after four (04) weeks of drying (stabilized mass) in the ambient atmosphere. The tests were carried out on an MTS model machine (Fig. 3.d) at a cross-head speed of 1.2mm / min u to breaking. A specimen under stress is shown in Fig. 3.e. It displays a barrel shape. For each specimen, the modulus of elasticity and the maximum stress were determined. The modulus of elasticity E is calculated as the slope of the adjustment line (least squares method) of the points lying between ε1 = 0.002 and ε2
= 0.005 of the linear domain of the stress-strain curve. The maximum stress 𝜎𝑐 𝑚𝑎𝑥 was calculated according to
the formula below:
𝝇
𝒄 𝒎𝒂𝒙=
𝟒 𝑭𝝅𝑫²𝒄 𝒎𝒂𝒙(4)
where 𝐹𝑐 𝑚𝑎𝑥 is the compression force and D the diameter of
the specimen.
2.3.5. Characterization of samples with optics and scanning electron microscopy (SEM)
Tensile fracture cross-section analysis and appreciation of sample homogeneity were carried out by imaging them using camera, optical and scanning electron microscopes.
2.3.6. Statistical analysis
The statistical analysis of the test results was carried out using Student's t test for the comparison of two mean values and an ANOVA for the comparison of more than two mean values, at the 5% threshold.
(a) (b)
(c) (d) (e)
Figure 3. (a) Speckled test specimen (b) Point distribution
on the specimen textured paint face, (c) Tensile test fixture (d) Compression test setup and (e) Deformation mode of the test specimen in compression.
3. Results and discussion
3.1. Physical properties 3.1.1. Densities and porosity
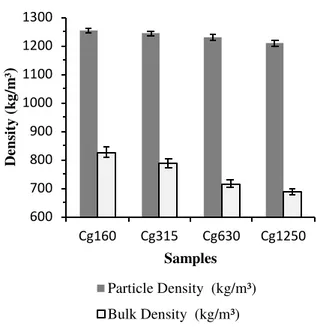
The results for the bulk and particulate densities of the composite are shown in Table 2. It was found that the bulk and particulate densities of the composite changed depending on the granular classes, hence depending on the size of the particles in the composite. For each of these two types of density (bulk and particulate), the mean values (Table 2) differed from one sample to another (ANOVA test).
Fig. 4 shows that the bulk density of the material decreased as the size of the wood particles increased (from 686 kg / m³ for Cg1250 to 826 kg / m³ for Cg160 (Table 2) with a strong
30 35 40 45 50 Cg160 Cg315 Cg630 Cg1250 Po ro sity (%) Samples 600 700 800 900 1000 1100 1200 1300 Cg160 Cg315 Cg630 Cg1250 Densi ty (k g/m ³
)
Samples Particle Density (kg/m³) Bulk Density (kg/m³) linear correlation (r = - 0.93). Consequently, the materialbecame lighter as the particle size became larger. This finding did not change even when taking into account the uncertainties for the density averages. The uncertainties obtained for the measurements were small, ranging from a minimum of 1.50% (sample Cg1250) to a maximum of 2.03% (sample Cg160). This low dispersion in densities was explained by the good homogeneity of the mixtures obtained thanks to the technique and the manufacturing equipment used but also to the care put into the handling operations. Also, bulk density results obtained on the WPoC (made of 40% wt) seem to differ from those of Stark and Rowlands
[19]. These latter observed on injection molded wood polypropylene composites filled with 40% wood flour (by weight) that, particle size did not affect the specific weight of the composite. The nature of the matrix and the composite manufacturing technique might explain that difference.
With regard to the particulate density of the samples, Fig. 4
shows that as the particle size of the wood increased, the particulate density decreased, but that decrease remained small (less than 4%) for all the samples, ranging from 1253.83 kg / m3 (sample Cg160) to 1209.47 (sample Cg160)
(sample Cg1250) (Table 2). Similarly, there was very little dispersion of measurements around the means (less than 1%). These small deviations of the measurements around the averages of the same sample and between the averages of the different samples would appear to be due to the nature of the quantity measured and to the presence of voids inside the wood particles. In fact, in unchanged mass proportions of constituent materials (wood and EPS glue) from one composite sample to another, the particle density should be constant, since that of each constituent material is constant (1.54 g / cm3, for wood). The small, steady decrease (in
particulate density) observed would appear to be a consequence of the presence of intercellular voids in the matrix-coated wood particles (EPS glue), voids whose volume would become relatively larger as the size of the particles increased. The porosity results for the different samples are presented in Fig. 5. According to Fig. 5, the porosity of the samples (mean values different from one sample to another (ANOVA test)) increased with the increase in size of the wood particles in the composite.
Table 2 Physical properties of the composite: density and
porosity.
SD: standard deviation.
Figure 4. Particulate and bulk density of samples.
Figure 5. Porosity of samples.
In addition, there was a good linear correlation (r = 0.91) between porosity and particle size (Table 2). Thus, the larger the size of the wood particles, the more the material was porous. This result was not surprising, since the porosity of the composite depended on the bulk and particulate densities whose variations with respect to the size of the particles, have just been described above.
3.1.2. Water absorption and thickness swelling
In Table 3, the results for water absorption and thickness swelling, after 2 hours, then 24 hours of immersion in water, are presented for the different samples studied. An analysis of these results (Student's t test) showed that there was no significant difference between the water absorption rates after 2 hours of immersion for samples C160 and Cg315 on the one hand and, C630 and Cg1250 on the other hand but the levels for Cg315 and Cg630 remained different. However, a significant difference was found between the absorption rates
Samples Particulate density (kg/m³) Bulk density (kg/m³) Porosity (%) Mean value SD Mean value SD Mean value SD Cg160 1253.83 8.48 826.42 16.75 34.09 0.71 Cg315 1244.09 8.67 787.34 13.93 36.71 0.67 Cg630 1229.93 8.57 715.72 12.86 41.81 0.77 Cg1250 1209.47 10.69 686.24 10.31 43.26 0.69
0 2 4 6 8 10 12 14 16 0 0 32 0 64 0 96 1 28 1 6 Wa ter a bs orpt io n ( %) Size of particles (mm) Absorption after 2h Absorption after 24h 0 1 2 3 4 0 0 32 0 64 0 96 1 28 Thick nes s s w elling (%) Size of particles (mm)
Thicness swelling after 2h Thicness swelling after 24h
after the various samples had been immersed for 24 h (Anova). Fig. 6 shows that the absorption rates after 24h of immersion, which were higher than those after 2 h, increased in line with the increase in particle size.
Figure 6. Water absorption rate of samples.
Figure 7. Thickness swelling of samples. Table 3 Physical properties of the composite: water
absorption and thickness swelling.
For thickness swelling (Table 3), no significant difference was found between the rates after 2 hours of sample immersion, but after 24 hours the rates were seen to increase
in line with the increase in particle size (Fig. 7).
The increase in water absorption and thickness swelling in line with the increase in particle size seems coherent, as thickness swelling is a consequence of absorption on the one hand, and of porosity on the other hand, which explains why absorption increased as the particle size increased. Overall, WPoC was found to have a low absorption rate (less than 15%) and negligible thickness swelling after 24 h (less than 5%).
3.2. Mechanical properties of the composite 3.2.1. Properties of the composite in tension
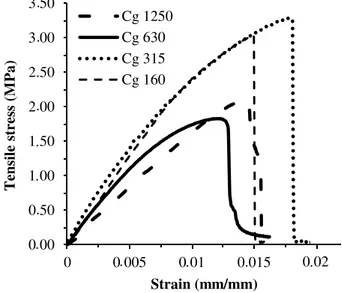
The tensile test enabled an assessment of the cohesion existing between the wood particles and the polymer matrix and showed the stress limits of the material when stretched.
Fig.8 presents the tensile stress-strain curves for the different samples studied. It can be seen that most of the samples had the same behavior in tension characterized by a short plastic domain. The analysis of the field of displacements on the observed face (sprayed textured finish surface) showed uniformity for the low load values in the elastic zone; then the displacements amplified on one side of the rupture cross-section up to the occurrence of rupture. The uniformity of the displacement field for low load values ensured homogeneity of the local elastic properties of the WPoC material.
The values for Young's modulus (strain resistance), maximum stress (load resistance) and Poisson's coefficients for the different samples are reported in Table 4. The comparative analysis (Student's t test) of these values revealed that there was no significant difference between Young’s moduli for samples Cg630 and Cg1250, but that these modulus values were different from those of samples Cg315 and Cg160. The moduli of these latter were different from one another. This finding for the modulus values barely changed when considering maximum stress.
Fig. 9 shows that the tensile Young modulus increased (more than 22%) when the size of the wood particles increased from Cg160 to Cg315, but dropped by almost a half (45%) when the particle size changed from Cg315 to C630 or Cg1250. Almost the same trend was also found (Fig. 9) Almost the same trend was also found with respect to maximum stress which increased by more than 11% when the particle size of the wood rose from Cg160 to Cg315, but it fell by more than 30% when the particle sizes passed from Cg315 to Cg630 or Cg1250.
Thus, the strength and rigidity of the WPoC tended to improve with the increase in particle size up to Cg315, but after Cg315 these characteristics deteriorated. The tendency towards improved tensile characteristics with the observed increase in particle size has already been reported by some authors [19-21] in their work on the behavior of plastic wood composites in tension. Moreover, this improvement would seem to indicate good adhesion between the wood particles and the EPS matrix which is known for its binding power
[16]. The deterioration of the characteristics for sizes beyond Cg315 was explained by weak adhesion between the wood
Samples
Water absorption (%) Thickness swelling (%) After 2h After 24h After 2h After 24h Moy SD Moy C Moy SD Moy SD
Cg160 2.79 0.48 10.18 0.60 1.05 0.33 2.43 0.29 Cg315 2.71 0.53 11.03 0.34 1.38 0.39 2.72 0.50 Cg630 4.81 0.22 12.52 0.81 1.19 0.41 2.55 0.46 Cg1250 5.43 0.70 13.92 0.99 1.37 0.31 3.74 0.51 . . . . . . . . .
0 00 0 50 1 00 1 50 2 00 2 50 3 00 3 50 0 0 005 0 01 0 015 0 02 Tensile st re ss (M Pa ) Strain (mm/mm) Cg 1250 Cg 630 Cg 315 Cg 160 0 00 0 05 0 10 0 15 0 20 0 25 0 30 Cg160 Cg315 Cg630 Cg1250 Po iss on ra tio Samples 0 200 400 600 800 1000 1200 Cg160 Cg315 Cg630 Cg1250 Tens ile cha ra ter ist ics Samples
Tensile Young modulus (MPa)
Tensile ultimate strength (x0.01MPa) particles and the matrix, which was detrimental to the
maximum stress and, as the matrix was not completely solidified, it was also detrimental to the rigidity of the WPoC. The lack of adhesion at the interface of the phases and insufficient solidification of the matrix were due to the partial presence of solvent in the WPoC. Indeed, at the end of the air exposure of the composite in its expanded state (just before molding), it was found that a composite based on finer particles dried faster than another based on larger particles. The glue agglutinated more wood particles when the particles were larger (at equal mass, the volume of wood flour was smaller when the particle size increased), by forming clumps that did not promote the complete elimination of the solvent from inside the composite by volatilization. Completely removing solvent from inside the material by the evaporation technique is relatively time-consuming [22]. The samples having been tested after four weeks, so the solvent would remain partially inside them, which would not allow the EPS matrix to play its mechanical role in the transmission of forces between the wood particles in the WPoC.
Poisson's ratio is an elastic parameter that expresses the ratio of the strain in a transverse direction to that in the longitudinal direction (direction of tensile force). For all samples, Poisson's ratio was between 0.14 and 0.24 (Table 4).
Fig. 10 shows that it grew almost linearly with particle size (high correlation, r = 0.96) and accordingly, it was strongly correlated (r = 0.99) with WPoC porosity.
However, the existence of the solvent effect in the WPoC prevented an objective assessment of the effect of porosity on Young's modulus and the maximum stress of the material. This is so, although on the one hand, a strong negative correlation (r = -0.84) is found between the porosity and the maximum stress and, on the other hand, the negative effect of porosity on mechanical properties of the present composite is known in the literature [11, 12, 23, 24],and therefore possible in the case of the present composite.
Figure 8. Tensile stress-strain curve of samples.
.
Figure 9. Tensile modulus of elasticity and
maximum stress of samples.
Figure 10. Poisson’s ratio of samples.
3.2.2. Properties of the composite in compression
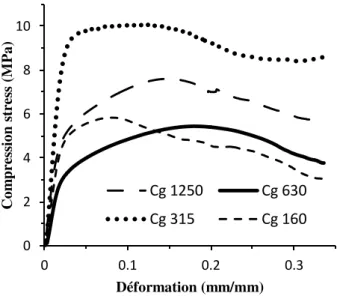
The compression test enabled an assessment of material behavior and extraction of the modulus of elasticity and maximum stress in compression. Fig. 11 shows the behavior of the composite in compression. From Fig. 11, it is found that the WPoC had a ductile-type behavior characterized by three (03) domains: a first elastic domain of almost linear behavior (deformation < 0.025), where stresses and deformations could be related by Hooke's law; a second domain of homogeneous plastic behavior (deformation between 0.025 and 0.15) characterized by irreversible deformations and where the first cracks appeared, and finally a third domain where the behavior of the material was heterogeneously plastic (deformation > 0.15). It was also found that the increase in particle size (from 0.160 to 1.25 mm) did not influence the rupture mechanism of the composite, which remained of the ductile type regardless of the sample.
The means values for the maximum stress and modulus of
. . . . . . . . . . . . . . . . . . .
0 100 200 300 400 500 Cg160 Cg315 Cg630 Cg1250 Co m press io n cha ra ter ist ics Samples Young modulus in compression (MPa) Ultimate strength in compression (0.1xMPa) elasticity in compression for the samples are presented in
Table 4. The comparative analysis (Student's t test) of these mean values showed that there was no significant difference between on the one hand, the maximum stresses and the modulus of elasticity of the samples Cg160 and Cg315, and on the other hand, between the samples Cg630 and Cg1250.
On the contrary, for samples Cg315 and Cg630, a significant difference was found. Overall, it is noted that the maximum stress and modulus of elasticity in compression of the composite decreased as the size of the wood particles increased (Fig. 12).
As in the case of tension, these results were explained by the decrease in inter-facial adhesion between the wood particles and the EPS matrix, which was due to the partial presence of solvent in the composite. However, more so than in tension, the significantly marked presence of residual solvent in the compression specimens, would seem to explain the degradation of the mechanical characteristics (modulus of elasticity and maximum stress) already with sample Cg160, so that no tendency towards improved characteristics (with increasing particle size) was found. This more important presence of solvent in the compression specimens was explained by the difference in geometry between the section of the latter (larger and more enveloping section) and that of the tensile specimens (smaller and thinner section), so the solvent would volatilize less easily from the compression specimens than from the tension specimens.
Figure 11. Compression stress-strain curve of samples. 3.3. Characterization by optical and Scanning Electron Microscopy (SEM)
3.3.1. Characterization with optics
Figs. 13 presents the photographic images of the different samples studied. These figures provide some useful information on certain physical properties of the composite, on a millimeter scale. Regular distribution of the wood particles in the matrix was found, indicating good
Table 4. Mechanical properties of the composite.
Samples Tensile Compression Poisson’s ratio Young modulus (MPa) Maximum stress (MPa) Young modulus (MPa) Maximum stress (MPa) Cg160 0.14±0.01 866.2±95.6 2.61±0.4 460.4±54.1 8.93±1.3 Cg315 0.16±0.03 1057.1±133.7 2.90±0.5 464.0±63.0 9.17±1.4 Cg630 0.21±0.05 582.7±47.3 2.22±0.3 306.3±68.4 6.20±0.7 Cg1250 0.24±0.03 638.0±78.7 2.10±0.3 271.1±30.2 5.94±0.8
Figure 12. Compression modulus of elasticity and maximum stress of samples.
homogeneity of the WPoC. This homogeneity explained the low dispersion of the bulk density results of the composite, discussed above. These figures also show variability in the texture of the WPoC, which enriched the aesthetic aspect of the material. Moreover, the image (obtained with an optical microscope) in Fig. 14 shows that the wood particles were well coated with the plastic matrix, which ensured maximum contact between the two phases.
3.3.2. SEM characterization
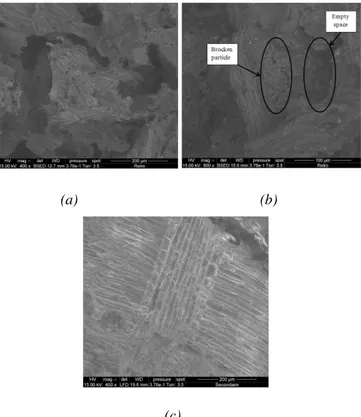
The SEM observation of the tensile fracture cross-section of sample Cg1250 (Fig.15.a) revealed voids from where the wood particles had withdrawn. This finding resulted from weak adhesion at the glue / wood interface and confirmed the results discussed above, on the mechanical characteristics of sample Cg1250.
Fig. 15.b, presenting the fracture cross-section of sample Cg315, shows voids (circled on the right) resulting from low inter-facial adhesion on the one hand, and coated and broken 0 2 4 6 8 10 0 0.1 0.2 0.3 Co m press io n st re ss (M Pa ) Déformation (mm/mm)
Cg 1250
Cg 630
Cg 315
Cg 160
(a) (b) (c) (d)
Figure 13. Millimeter-scale facial view of samples of
granular class (a) Cg160, (b) Cg315, (c) Cg630 and (d) Cg1250.
Figure 14. Particle embedded in a tensile fracture
cross-section (sample Cg1250).
particles (identifiable by the vessels and circled on the left), indicating good adhesion at the glue/wood interface, on the other hand. Similarly, Fig. 15.c shows a fragment of wood particle (resulting from the rupture of the particle) glued to the matrix, in a fracture cross-section of sample Cg315, revealing inter-facial adhesion. These two findings revealed that the adhesion between the wood particles and the glue was not uniform throughout the composite and explained the decrease in mechanical characteristics (maximum stress and modulus of elasticity) in tension, with a noticeable decrease being recorded from sample Cg315 to sample Cg1250.
(a) (b)
(c)
Figure 15. Rupture cross-section (a) for sample Cg1250,
showing empty spaces or removal zones of wood particles; (b) for sample Cg315, showing a broken particle (surrounded on the left) and a tear-off zone (surrounded on the right); (c) for sample Cg315, showing a fragment of wood particle still
stuck to the matrix after rupture.
4. Conclusion
With the help of the material means used, this work provided a better understanding of a certain number of physical and mechanical properties of the WPoC. The composite had a low water absorption rate (less than 15%) and a negligible rate of thickness swelling, which is suitable for its use in contact with water. The porosity of the WPoC depended on the size of the wood particles it contained and was related to the physical characteristics. In terms of mechanical properties, the WPoC showed a fragile behavior in tension and a ductile-type behavior in compression. Overall, the maximum stress and modulus of elasticity for both types of solicitation decreased as the size of the wood particles in the WPoC increased. However, an improvement in tensile properties as the particle size increased was partially observed. The effect of porosity on the mechanical characteristics was not clearly evidenced due to the presence of solvent within the composite. The mechanical properties of the WPoC could be further improved if some thought is given to a way of eliminating the solvent from the composite. Using plant fibers, such as hemp fibers and possibly a coupling agent, could also contribute to this.
Acknowledgments
We gratefully acknowledge the financial support of the Center for International Cooperation in Agronomic Research for Development (Cirad) in Montpellier, France.
Conflict of Interest
The authors have no conflicts of interest to disclose.
References
[1] N. Chaukura, W. Gwenzi, T. Bunhu, D. T. Ruziwa, I. Pumure, Potential uses and value-added products derived from waste polystyrene in developing countries: A review, Resources, Conservation and Recycling, 107 (2016) 157‑165J. Clerk Maxwell, A Treatise on Electricity and Magnetism, 3rd ed., vol. 2. Oxford: Clarendon, 1892, pp.68–73.
[2] A. M. Issam, B. T. Poh, H. P. S. Abdul, W. C. Lee, Adhesion properties of adhesive prepared from waste polystyrene, J.Polym.Environ., 17 (2009)165 ‑ 169.K. Elissa, “Title of paper if known,” unpublished.
[3] E. M. Mbadike, N. N. Osadebe, Effect of incorporating expanded polystyrene aggregate granules in concrete matrix, J. Technol., 31 (2012) 401‑404.
[4] C. Gutiérrez, M. T. García, I. Gracia, A. de Lucas, J. F. Rodríguez, The Selective Dissolution Technique as Initial Step for Polystyrene Recycling, Waste and Biomass Valorization, 4 (1) (2013) 29‑36.
[5] N. D. Gil-Jasso, M. A. Segura-González, G. Soriano-Giles, J. Neri-Hipolito, N. López, E. Mas-Hernández, Dissolution and recovery of waste expanded polystyrene using alternative essential oils, Fuel, 239 (2019) 611‑616.
[6] K. Hamad, M. Kaseem, et F. Deri, Recycling of waste from polymer materials: An overview of the recent works, Polymer Degradation and Stability, 98 (12) (2013) 2801‑ 2812.
[7] M. T. García, I. Gracia, G. Duque, A. de Lucas, et J. F. Rodríguez, Study of the solubility and stability of polystyrene wastes in a dissolution recycling process, Waste Management, 29 (6) (2009) 1814‑1818.
[8] S. C. H. Mangalara et S. Varughese, A green recycling approach to obtain nano and microparticles from expanded polystyrene waste, ACS Sustainable Chem. Eng. (2016) 32 p.
[9] R. F. Cella et al., Polystyrene recycling processes by dissolution in ethyl acetate, Journal of Applied Polymer Science, 135 (18) (2018) p. 46208.
[10] E. Agoua, E. Allognon-Houessou, E. Adjovi, et B. Togbedji, Thermal conductivity of composites made of wastes of wood and expanded polystyrene, Construction and Building Materials, 41 (2013) 557‑562..
[11] B. Madsen, H. Lilholt, L. Damkilde, P. Hoffmeyer, et A. B. Thomsen, Properties of plant fiber yarn polymer composites: an experimental study, Ph. D. Thesis,
Technical University of Denmark, Kgs. Lyngby, (2004) 197p.
[12] A. M. Almusawi, Mise en œuvre et optimisation des propriétés d’une structure sandwich en matériaux biosourcés (fibres et bois de chanvre) avec une matrice en polystyrène expansé pour le bâtiment. Matériaux, Thèse de Doctorat, Université Bourgogne Franche-Comté. Français, (2017) <NNT : 2017UBFCA009>.<tel-01870446>.
[13] S. Soulama, Caractérisation mécanique et thermique de biocomposites à matrice polystyrène recyclé renforcée par des coques de cotonnier (Gossypium Hitsutum L.) ou des particules de bois de Kénaf (Hibiscus Cannabinus L.), Thèse de Doctorat, Matériaux. Université de Technologie de Belfort-Montbeliard. Français, (2014) <NNT : 2014BELF0243>. <tel-01502466>.
[14] R. Ou, Y. Xie, M. P. Wolcott, S. Sui, et Q. Wang, Morphology, mechanical properties, and dimensional stability of wood particle/high density polyethylene composites: Effect of removal of wood cell wall composition, Materials & Design, 58 (2014) 339‑345. [15] T. Masri, H. Ounis, L. Sedira, A. Kaci, et A. Benchabane,
Characterization of new composite material based on date palm leaflets and expanded polystyrene wastes, Construction and Building Materials, 164 (2018) 410‑ 418.
[16] S. A. Osemeahon, J. T. Barminas, et A. L. Jang, Development of Waste Polystyrene as a binder for emulsion paint formulation I: Effect of polystyrene Concentration, 2 (8) (2013) 30‑35.
[17] B. Wattrisse, A. Chrysochoos, J.-M. Muracciole, et M. Némoz-Gaillard, Kinematic manifestations of localisation phenomena in steels by digital image correlation, Eur. J. Mech. A, 20 (2001) 189‑211. [18] J. C. Dupré, M. Bornert, L. Robert, et B. Wattrisse,
Digital image correlation: displacement accuracy estimation, In EPJ web of conferences, 6 (2010) 31006. [19] N. M. Stark et R. E. Rowlands, Effects of wood fi ber
characteristics on mechanical properties of wood/polypropylene composites, Wood Fiber Sci, 35 (2003) 167‑174.
[20] J. Bessa, C. Mota, F. Cunha, et R. Fangueiro, Influence of different thermoplastic polymer/wood ratios on the mechanical and thermal properties of composite materials, Procidia Engineering, 200 (2017) 480–486. [21] J. Guidigo, Caractérisation physico-mécanique du
composite bois polymère, thèse de Doctorat, Université de Lorraine (France) (2017) 144p.
[22] G.-C. Hwang, B. Ki. kim, S.-Y. Bae, S. C. Yi, Degradation of Polystyrene in Supercritical Acetone, Journal of Industrial and Engineering Chemistry, 5 (2) (1999) 150‑154.
[23] M. Pihlatie, A. Kaiser, et M. Mogensen, Mechanical properties of NiO/NiYSZ composites depending on temperature, porosity and redox cycling , Journal of the European Ceramic Society, 29 (2008) 1657‑1664. [24] A. Le Duigou, M. Castro, R. Bevan, N. Martn, 3D
printing of wood fiber bio-composites From mechanical to actuation functionality, Materials & Design, 96 (2016) 106‑114.