A 3D stereo camera system for precisely
positioning animals in space and time
The MIT Faculty has made this article openly available.
Please share
how this access benefits you. Your story matters.
Citation
Macfarlane, Nicholas B. W. et al. “A 3D Stereo Camera System
for Precisely Positioning Animals in Space and Time.” Behavioral
Ecology and Sociobiology 69.4 (2015): 685–693.
As Published
http://dx.doi.org/10.1007/s00265-015-1890-4
Publisher
Springer Berlin Heidelberg
Version
Author's final manuscript
Citable link
http://hdl.handle.net/1721.1/104438
Terms of Use
Article is made available in accordance with the publisher's
policy and may be subject to US copyright law. Please refer to the
publisher's site for terms of use.
METHODS
A 3D stereo camera system for precisely positioning animals
in space and time
Nicholas B. W. Macfarlane&Jonathan C. Howland&
Frants H. Jensen&Peter L. Tyack
Received: 7 January 2015 / Revised: 12 February 2015 / Accepted: 13 February 2015 / Published online: 28 February 2015 # Springer-Verlag Berlin Heidelberg 2015
Abstract Here, we describe a portable stereo camera system that integrates a GPS receiver, an attitude sensor and 3D stereo photogrammetry to rapidly estimate the position of multiple animals in space and time. We demonstrate the performance of the system during a field test by simultaneously tracking the individual positions of six long-finned pilot whales, Globicephala melas. In shore-based accuracy trials, a system with a 50-cm stereo baseline had an average range estimation error of 0.09 m at a 5-m distance increasing up to 3.2 at 50 m. The system is especially useful in field situations where it is necessary to follow groups of animals travelling over relative-ly long distances and time periods whilst obtaining individual positions with high spatial and temporal resolution (up to 8 Hz). These positions provide quantitative estimates of a
variety of key parameters and indicators for behavioural stud-ies such as inter-animal distances, group dispersion, speed and heading. This system can additionally be integrated with other techniques such as archival tags, photo-identification methods or acoustic playback experiments to facilitate fieldwork inves-tigating topics ranging from natural social behaviour to how animals respond to anthropogenic disturbance. By grounding observations in quantitative metrics, the system can character-ize fine-scale behaviour or detect changes as a result of distur-bance that might otherwise be difficult to observe.
Keywords Photogrammetry . Group cohesion . Collective behaviour . Geo-location . Range-finding
Introduction
Many animals live in groups that provide important benefits to the individual, such as decreased predation risk and lower cost of movement (Hamilton 1971; Krause and Ruxton 2002). These benefits often depend on the relative position of an individual within a group (Sumpter et al. 2008) and the be-haviour of other group members (Conradt and Roper2003; Bode et al. 2011). Realizing the benefits of a group often requires mechanisms for maintaining spatial cohesion (Krause and Ruxton2002) and for reuniting with the group after temporary separations (Da Cunha and Byrne2009).
Many theoretical studies have modelled how simple behav-iours by individual group members with differing motivations (Conradt and Roper2000) can give rise to remarkably com-plex collective movements (Gueron and Levin1993; Parrish and Hamner1997). These studies indicate the importance of an individual’s relative spatial position for many aspects of collective motion ranging from the impact of social networks Communicated by L. Z. Garamszegi
Electronic supplementary material The online version of this article (doi:10.1007/s00265-015-1890-4) contains supplementary material, which is available to authorized users.
N. B. W. Macfarlane (*)
:
F. H. Jensen:
P. L. TyackDepartment of Biology, Woods Hole Oceanographic Institution, 266 Woods Hole Rd, MS 50, Woods Hole, MA 02543, USA
e-mail: [email protected] N. B. W. Macfarlane
Department of Biology, Massachusetts Institute of Technology, Cambridge, MA 02139, USA
J. C. Howland
Department of Applied Ocean Physics and Engineering, Woods Hole Oceanographic Institution, Woods Hole, MA 02543, USA F. H. Jensen
Department of Ecology and Evolutionary Biology, Princeton University, Princeton, NJ 08540, USA
P. L. Tyack
Scottish Oceans Institute, University of St. Andrews, St. Andrews, Fife KY16 8LB, UK
(Bode et al.2011) and decision-making structures (Conradt and Roper 2003; Conradt and Roper 2010) to transferring information throughout the group (Couzin et al. 2005; Sumpter et al.2008). Until recently, empirical studies have lagged behind theory because they lacked the precision and accuracy to collect spatial data in fast-moving groups of ani-mals (Nagy et al.2010). However, methods have improved dramatically in recent years to the point where it is now pos-sible to simultaneously track all members of entire groups of fish (Stienessen and Parrish2013) or starlings (Ballerini et al.
2008; Cavagna et al.2013) in three dimensions using fixed installations of cameras in a particular location. Whilst these methods are extremely useful for studying animal movement and decision processes, the fixed instrumentation limits their ability to be applied in the field to follow a group of freely moving animals over longer intervals of space and time.
Over the years, researchers have taken various approaches to estimating positions of individual animals in the field. For example, Fischhoff et al. (2007) used periodic video censuses to record the relative position of zebras during single-file travel, and King et al. (2011) observed groups of baboons from a cliff top to visually estimate individual positions and timing during movement initiation. The marine environment provides particular challenges for tracking quickly moving individuals in a group. Animals often dive out of view, and they may surface asynchronously, unpredictably and often only for brief moments. Efforts to locate marine animals have often relied on estimating positions by eye from a distance with practicality requiring estimates to be grouped into broad spatial categories that are sampled at several minute intervals (Mattson et al.2005). Calibrating visual observer estimates by periodically comparing them with a laser range finder or com-paring estimates to a GPS buoy such as Visser et al. (2014) did when following groups of pilot whales from 100 to 400 m can improve accuracy and precision. However, in general, humans are often ineffective at estimating distance at sea by eye, sub-ject to biases and large errors and with a tendency to lump measurements together (Buckland et al.2001).
At sea, positions have been estimated by using the vertical angle between an object and the horizon (Gordon2001), from overhead video cameras mounted on tethered airships (Nowacek et al.2001), and by combining laser range finders with compass bearings measured with a GPS (Curé et al.
2012). Some approaches to monitoring marine animals from land can use theodolites, which measure the horizontal and vertical angles to a target (Bejder et al.2006; Williams and Ashe2007), but these instruments require a stable platform, and they generally only sample one individual at a time. Thus, new equipment would be helpful for studying fast-moving groups of animals in the field over longer time periods and distances.
An ideal situation would be to have the ability to obtain a quickly updating 3D position of each animal in a group. This
could be accomplished by instrumenting all the animals with biologging systems as has been done in pigeons (Nagy et al.
2010; Flack et al.2013; Nagy et al.2013). However, at pres-ent, few tags have the spatial and temporal resolution required for most behavioural analyses, and tagging all group members may not always be possible.
Here, we report on a portable stereo camera system that takes advantage of miniaturized digital technology to imple-ment stereo photogrammetry for rapid and easy positioning of multiple animals. We demonstrate the performance of this system by simultaneously tracking the individual positions of six long-finned pilot whales, Globicephala melas, allowing us to estimate inter-animal distances and group dispersion as a function of time with high spatial and temporal resolution.
System description Overview of the system
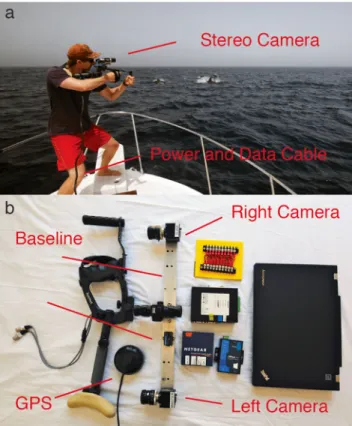
Our portable, battery-powered system (Fig. 1) uses online stereo photogrammetry to position animals in space and time. The system integrates a GPS receiver (GPS16x, Garmin, USA) to provide camera location, an attitude sensor
(3DM-Fig. 1 Stereo camera geocoding system. a System in action collecting data on a group of long-finned pilot whales, Globicephala melas. b System in parts shown without wiring and battery
GX3, Microstrain, USA) to identify the 3D direction in which the camera is aiming and a pair of computer-controlled calibrated and synchronized stereo digital cam-eras (Prosilica GC 1380, Allied Vision Technologies, Canada) to measure the range to any point in the stereo overlap area. The stereo camera is attached to an adjust-able rigid baseline and sits on a modified wildlife photog-raphy shoulder mount (Bushhawk, USA). The centre of the stereo baseline has a sight for aiming. A 10-m power and data cable connects to a 40-L support cooler where a laptop running the Ubuntu 12.04 operating system and custom software written in C controls the data collection and processing. The entire system runs off a 12-V battery. The system’s trigger is integrated into the photography mount, and three LEDs on the mount allow the operator to monitor whether data are being collected correctly. Often the operator can observe contextual details during data collection that are unavailable during analysis; thefore, a small headset microphone can be triggered to re-cord time-stamped voice notes, such as animal IDs, that are saved as small audio files and synchronized with im-ages from the camera. Although animals can often be identified from the captured images, these notes are a particularly useful complement with similar looking ani-mals that may be difficult to distinguish, for example if they are facing away from the camera.
To operate the system, the operator sights on an animal or a group of animals and pulls the trigger in the camera mount. The LEDs signal that the system is recording, and stereo im-age pairs are captured at a predetermined rate of up to eight image pairs per second. The data from the GPS and attitude sensor are recorded into the metadata of each stereo pair. The voice recorder turns on whilst the trigger is pressed, and the system continues capturing data until the trigger is released. Battery life depends on the type of battery used as well as operating procedures: the current configuration of a small 32-Amp-hour car battery allows 6–8 h of data collection fol-lowing a group of pilot whales and recording all individual surfacings.
Technical approach to photogrammetric ranging
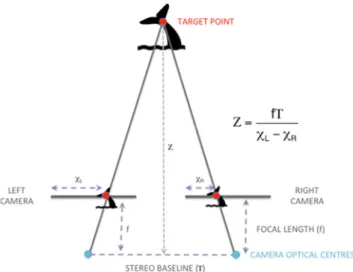
Figure 2 illustrates the basic principal concept of photo-grammetric ranging (for a review, see Bradski and Kaehler (2008)). A pair of calibrated cameras capture a stereo image of the target, in this case a whale fluke. Lines are traced from the optical centre of each camera through the two points in the image plane corresponding to the same location on the target, and their intersection in the local camera reference frame is computed using triangulation. The system computes geodetic coordinates for the target using camera position and orientation data provided by the GPS receiver and the attitude sensor.
System calibration
In order to estimate range accurately, the system must take into account any distortion in the lenses and the relative geometry of the two cameras to each other in all six degrees of freedom (x, y, z, pitch, yaw and roll). Both of these factors were ad-dressed using standard stereo calibration approaches found in the OpenCV computer vision software (Bradski and Kaehler
2008). OpenCV version 2.4 was used for all of the analyses described in this paper. The approach uses multiple stereo pairs of a checkerboard of known size and geometry to pro-duce a set of calibration matrices that map the real-world sys-tem onto the idealized model illustrated in Fig.2.
Analytical method
Data collection produces a directory of stereo image pairs similar to the example shown in Fig. 3a. Each pair is time-stamped and includes the metadata necessary for extracting positions using our custom software. When an image pair is loaded, the software uses the calibration parameters deter-mined previously, performs an epipolar rectification on the pair and loads them into windows on the computer screen. Zooming in and out if necessary, the operator moves a cursor over a target in the left image (see theBanalysis point^ shown in Fig.3a). The software then automatically cross-correlates the corresponding pixel in the right image using the Open CV matchTemplate function, a 32 × 32 window and the CV_TM_CCOR_NORMED match method. Should the soft-ware fail to automatically find the correct point in the right hand image, the operator can manually choose the point. Fig. 2 Technical approach to photogrammetric ranging. A conceptual illustration of photogrammetric ranging using a frontal parallel 2D view. Disparity between the corresponding images of the target in the two calibrated cameras, shown here by the difference betweenχL−χR,
allows triangulation of the range in space (Z) according to the following equation:Z ¼ χLf T−χR, where f is the focal length of the two cameras and T is the system baseline
Using the coordinates of the target point in the epipolar lines, the software computes the coordinates of the point in the camera pair coordinate system. In essence, this is a vector from the camera pair to the target. The attitude measurements extracted from the metadata are used to compute a direction cosine matrix, which is used to multiply the target vector, producing a vector in a real-world (north-east-down or NED) coordinate system whose origin is at the camera pair.
Since the GPS-based camera location has been measured and preserved in the image metadata, it can be used to convert the NED target coordinates to geodetic coordinates. We use a scaled equirectangular projection, but given the very small geographic area over which we make measurements in NED frame, the details of the NED projection type do not contribute to accuracy considerations in any meaningful way (For pseudocode of the location reconstruction algorithm, please see Online Resource 1. The source code is available on request and can be obtained by emailing the authors).
Coordinates of target points from the stereo images and the integrated metadata are exported to an output file that can be easily opened in analysis programs such as MATLAB (Mathworks, Natick, USA). When a target point is recorded, the operator has the opportunity to apply a written label—for example, of the animal’s ID stemming from the corresponding voice tag—that is stored with the output. Figure3bshows the left hand frame of the pair shown in 3a with the whales’
geodetic latitude and longitude coordinates. Figure 3cmaps those positions into a plan view coordinate system looking down at the water’s surface, demonstrating example inter-animal distances at that point in time.
Accuracy considerations
Limitations in the accuracy of this system stem primarily from errors in the GPS position, pointing vector from the attitude sensor and range estimated from stereo pair images. GPS er-rors are well documented, and there are established methods of filtering data for reducing them as much as possible de-pending on the particular receiver used (e.g., Hide et al.
2003; Han and Wang2012). Pointing errors in direction from the attitude sensor contribute to position error as a function of distance with greater range to target leading to larger errors. The specifications of the attitude sensor used are a root-mean-square (RMS) pointing error of ±1°. A series of 107 measure-ments of a fixed sensor yielded RMS errors of 0.062°, 0.035° and 0.185° for pitch, roll and heading. Camera pitch and roll mostly affect altitude errors, which are not a significant con-cern in most marine mammal research where the targets are on the ocean’s surface; however, they could be more important if the system was used with terrestrial or airborne animals. Heading, on the other hand, is key for estimating the location of individual points. Heading error can be attributed to Fig. 3 a Example stereo pair
produced by the system from the left and right cameras. The corresponding positions of a chosen analysis point in both cameras are shown for which the system can produce geodetic coordinates. b Left camera view of the stereo pair in a with the whales’ geodetic coordinates. c Whales from b mapped onto a plan view. The system was located at (1.9,−35.5). Several examples of inter-animal distance are also shown. Notice how difficult it would be to reproduce an accurate representation of position or distance by eye alone
systematic deviation due to local magnetic fields and to inac-curacy in the heading estimate of the attitude sensor. We corrected for local geomagnetic offsets using the World Geomagnetic Model 2010; Iron errors caused by magnetic fields near the system require calibration in situ, but system-atic deviation should not affect the relative location of sequen-tial points. The attitude sensor was chosen for its high accura-cy and update rate—the measured error of the heading esti-mate (0.2° RMS) propagates into a static location error of 0.16 m RMS at 50 m, so this is negligible compared to the observed errors. Attitude measurements and image exposures occur asynchronously; the metadata for each image contains the most recent attitude measurements. This could cause time offsets between image exposures and attitude measurements, but the high-update rate of the attitude sensor (typically 20 Hz) minimizes this error contribution under typical working dynamics.
Errors in stereo camera ranging stem from image errors caused by lens distortion and stereo pair-based errors. Image errors are addressed by calibration, but this will always have limits to its precision. Stereo pair-based errors result from choosing slightly different points in the left and right images leading to an incorrect disparity measurement. Because esti-mated range is proportional to baseline divided by disparity, the system’s stereo baseline directly affects how this error is propagated through to the final measurement (Howland et al.
2012). A larger baseline reduces positioning error but also increases the minimum operating distance before a target is within the stereo overlap area. Thus, the choice of an appro-priate stereo camera baseline will have to be based on consid-erations of typical range to target animals coupled with logis-tical and praclogis-tical limitations on the size of equipment. We designed our system using an appropriate baseline for a target distance of up to approximately 50 m that we commonly use in focal follows. A larger baseline could easily extend the working distance.
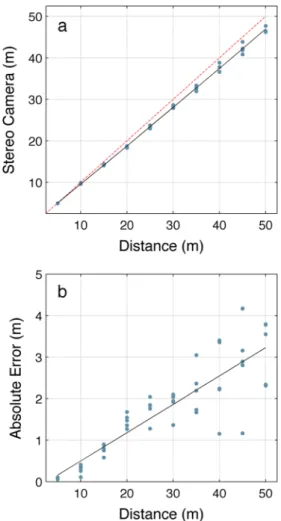
To illustrate the range estimation accuracy of our system, we captured stereo pairs for targets located at 5-m intervals in a shore-based test using a 50-cm baseline and lenses with 25-mm focal lengths. All measurements in this paper use this baseline and focal length. Figure 4 shows errors gradually increasing with distance from the system, ranging from an average of 0.1 m at a 5-m range to 3.2-m error at a 50-m range. As with all stereo photogrammetric systems that rely on the disparity between two images in order to estimate distance, both accuracy and precision decrease with range.
When collecting data at sea in varying conditions, platform instability can be a concern. We designed our system with this in mind, using fast shutter speeds and an attitude sensor with a high-update rate to mitigate any potential effects of movement resulting from sea state. With respect to the attitude sensor, it is not possible to completely separate gravitational acceleration from body acceleration, such as that caused by vessel motion
without using a GPS-based attitude system that would be too bulky for our application; however, the sensor’s frequency-based filtering and combination of accelerometer and magnet-ic measurements will help minimize this error. Given this lim-ited effect of platform instability, we used shore-based tests where it is possible to carefully measure and control all aspects of a trial to provide the most appropriate estimate of the sys-tem’s accuracy. However, to give a sense of how accuracy might change in an unstable platform, we also conducted mea-surement trials from a floating vessel that show similar results (Fig.5). It is important to remember that aside from the sys-tem’s inherent accuracy, there are certainly other difficulties arising from operating in heavy seas, such as effects on the ability of those conducting the focal follow to easily see the animals; however, these would be a limitation when using almost any kind of observation technique.
Fig. 4 System accuracy at increasing range using a 50-cm baseline and lenses with 25-mm focal lengths. Five shore-based estimates were taken at 5-m intervals. a System’s estimated range compared to actual range. The dotted red line represents a hypothetical perfect estimate. b Absolute error for each estimate at the intervals shown in a. The solid line is a linear best fit through the error scores. Average deviation ranged from 0.1 m at 5-m to 3.2 m at a 50-m range. As with all stereo photogrammetric systems that rely on the disparity between two images in order to estimate dis-tance, both accuracy and precision decrease with range
Field test and example data
We field-tested the system on a 15-min focal follow of a group of long-finned pilot whales (G. melas) travelling in
the Strait of Gibraltar. Sea state conditions were Beaufort 3–4. The group consisted of six individually identified pilot whales, a large adult male, a female, her calf and three young adult animals of indeterminate sex. Using the stereo camera system, the position of each animal was recorded every time it surfaced, 336 measurements in total. We used the tip of the dorsal fin to define animal position because this was the most consistently visible point. Animals were diving intermittently and did not necessarily surface at the same time, so a 2D linear interpolation was used to estimate the 2D surface position of each animal between surfacings (i.e., if the animal’s position at depth was (x,y,z), the projection on the surface was (x,y,0). Inter-animal distances were then estimated from the interpo-lated surface positions of each individual. Finally, a measure of overall group dispersion was estimated as the RMS Euclidian distance between the interpolated surface position of each animal and the group centroid position. The system provides animal positions at the time of each surfacing, and there are many potential ways of creating tracks beyond the linear interpolation we have used to illustrate this example.
Figure6ashows estimated animal tracks from these posi-tions over a 15-min period. Tracks are shown in Northing and Easting with the initial position of the first animal as the ori-gin. Although the animals stayed within a 150×200-m area, they were actually swimming steadily the entire time against a strong current. The circle, square, diamond and triangle markers super-imposed on the tracks represent individual an-imal positions at 3-min intervals.
We were then able to use these interpolated positions to estimate inter-animal distance over time; for example, Fig.6bshows the distance between the mother and her calf. We described group dispersion as the RMS distance of each group member’s position to the group’s centroid at that instant in time. Note that this particular metric is linked to the number of individuals being tracked. Figure6balso shows estimated group dispersion over time. A higher value of dispersion dicates an increase in spread. It was calculated using the in-terpolated tracks from Fig.6a. Most animals were surfacing several times a minute, but those that were in the midst of a dive lasting 5 min or longer were excluded from the analysis in order to reduce error from linear interpolations. The same time markers used in Fig.6aappear on Fig.6b. A 15× speed video of overhead geodetic position with a running calculation of RMS dispersion is shown in Online Resource2.
Discussion
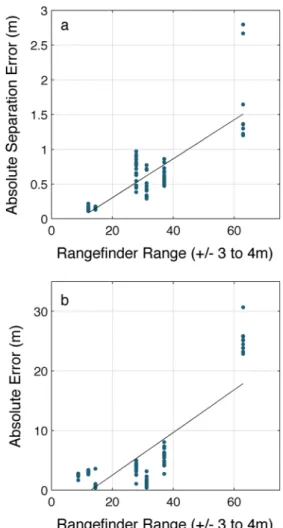
We have developed a 3D stereo geocoding system that facil-itates tracking multiple animals in space and time. The system is especially useful in field situations where it is necessary to track multiple animals within a group over relatively long distances and time periods whilst positioning individuals with Fig. 5 System accuracy at increasing range measured on the water in a
calm sea state (Beaufort 2). a Absolute error of a distance measurement between two traffic cones placed 3 m apart (a relevant inter-animal distance) on shore at increasing ranges with the system deployed from a small unstable vessel. Assessing range for comparison with the system at sea is challenging, for even a small anchored vessel will move about, and the measurement tool used will have its own error curves. Comparison range was measured with a range finder but should be understood to include a range of values of ±3 to 4 m to account for boat movement. Distances were taken at opportunistic intervals where it was possible to stabilize the vessel as much as possible against moorings. The solid line is a linear best fit through the error scores. The average absolute value of the error ranged from 0.15 m at ~12 m up to 1.69 m at ~63 m. To get a conservative estimate of geodetic location reconstruction accuracy, b shows absolute error of a geodetic coordinate calculated using the system compared with ones measured by placing the GPS receiver on top of the target. Like a, the positions were calculated at increasing distances from a target on shore. In addition to incorporating all measurement and location reconstruction error, this plot includes both error in the system GPS and again in the GPS measurement of the target’s position without the system, leading to a conservative estimate. The solid line is a linear best fit through the error scores. Average absolute error ranged from 2.5 m at ~9 m up to 25 m at ~63 m, which is beyond the design range of a system with this baseline and focal length
high spatial and temporal resolution. The data collected can be used to calculate a variety of metrics beyond animal position; in particular, they can be used to estimate group dispersion. The system can also be easily combined with other methods such as biologging tags.
The system provides a combination of features useful for studying animals in the field, particularly in situations that require simultaneous high spatial and temporal resolution tracking of multiple individuals during a follow. First, it is portable and can be deployed from a small vehicle or research vessel. Second, it is easily aimed in any direction and does not require vessel manoeuvring to position animals in a fixed field of view. Third, it provides high spatial and temporal resolution
positioning of multiple group members. As the apparent dif-ferences between Fig. 3b and c illustrate, estimating static positions and inter-animal distances by eye or from a fixed image is hard to do with high accuracy. Even trained visual observers are likely to judge distance in the foreshortened axis differently from the perpendicular left-right axis. Our system removes that uncertainty by providing quantitative, repeatable measurements regardless of the operator. Furthermore, whilst practicality often restricts behavioural observation protocols relying on human observers to a several minute sampling in-terval, the 8-Hz temporal resolution of this system permits the study of finer-scale behavioural changes than may be possible to measure with observers alone. Both the spatial and tempo-ral resolution depend on the particular configuration used, and the system is completely adjustable with baseline, cameras, lenses, sample rate, shutter speed and aperture, all changeable based on the particular needs of a study. Finally, it allows multiple animals to be sampled simultaneously if captured in the same frame or in quick succession if not.
The positions captured by the system can generate other behavioural metrics beyond the inter-animal distance illustrat-ed in Fig.6b. For example, different positions in time could be used to calculate a measure of speed over ground. Likewise, the geo-referenced images would allow course of travel to be calculated to measure any deviations that might result from environmental factors such as a disturbance (Curé et al.2012). Even the decision about whether marine animals are associat-ed in the same group is usually basassociat-ed on a definition that uses inter-animal distance as a discrimination parameter (Whitehead and Dufault1999; Whitehead et al. 2000), so the temporal and spatial resolution of the system could aid assessment of group size and social structure.
In particular, the ability to estimate changes in surface group dispersion over time will be useful for monitoring social behaviour, responses to predators and the effects of distur-bance. Many animals adopt social defence strategies to pred-ators, relying on their group members to protect them (Hamilton1971; Krause and Ruxton2002). In the face of a threat, animals using a social defence strategy may increase social group cohesion as measured by reduced inter-animal distance (Bode et al.2010). Thus, dispersion is an important proxy for disturbance or stress in many species, both in con-nection with natural predators (Altmann 1956; Macdonald
1983; Pitman et al.2006) as well as anthropogenic stressors such as ships and noise (Nowacek et al. 2001; Bejder et al.
2006). The continuous fine-scale estimates of dispersion that the system permits (see Fig.6band Online Resource2) will aid characterization of spatio-temporal behavioural changes, be they the result of a controlled disturbance or other recorded cues.
The system can be used in tandem with a variety of other methods and behavioural data. For example, in situations where animals cannot be viewed continuously, researchers Fig. 6 a Interpolated tracks of animal positions of a group of six known
long-finned pilot whales over 15 min. Tracks are calculated from 336 measured positions across the six animals. Tracks are shown in Northing and Easting with respect to the initial position of the first animal sampled. Although the animals do not appear to have travelled far, they were swimming the entire time against a strong current. Each type of marker shape represents an identical point in time. b Dashed black line shows estimated inter-animal distance (in metres) between the mother and calf in Fig. a calculated from 72 positions for the mother and 69 for the calf. Blue solid line shows surface cohesion of the entire group over time. Group dispersion was described as instantaneous group dispersion, defined as the RMS distance of individual positions relative to the group centroid at that instant in time. Note that this metric is linked to the number of individuals being tracked. Dispersion and distance were calculated using the 2D linear interpolated tracks from a
often rely on markings to determine individual identity. These determinations are easily recorded with the integrated vocal labelling to provide continuous tracking. Moreover, although a feature of the system is that it does not require instrumenting animals, it can be combined with biologging methods such as archival acoustic and kinematic tags (e.g., Johnson and Tyack,
2003). In marine mammals, instrumenting animals with tags would allow the integration of surface data (e.g., the 2D illus-tration shown in Fig.5a, b) with underwater tracks to estimate 3D positions above and below the surface, in turn extending cohesion calculations and other metrics to three dimensions. Furthermore, when acoustic tags are able to identify calls from individuals or groups, the combination with the system would enable investigation of acoustic cues that might mediate any number of the fine-scale behavioural metrics the system can observe. The continuous tracking of animal location from the system could also help provide animal position with respect to other geo-referenced environmental parameters such as topo-graphical features, a tagged predator, an acoustic array for localizing signals or anthropogenic disturbances.
There are many good techniques for positioning animals in space and time, and some field biologists will prefer pen and paper to a system like this whose resolution comes at the cost of purchasing and maintaining equipment and extra analysis time. We have developed our system for the field situation where multiple animals must be sampled at high spatial and temporal resolution whilst moving too far during the follow period to be tracked with fixed equipment installations. The system samples up to eight times a second and allows simul-taneous localization of multiple animals to distances of 50– 100 m or more depending on the configuration and resolution required. These positions provide quantitative estimates of a variety of other metrics such as inter-animal distances, group dispersion, speed and heading. This system is particularly useful in combination with other techniques such as archival tags, photo-identification strategies or sound playback exper-iments to facilitate fieldwork investigating topics ranging from natural animal behaviour to how animals respond to anthropogenic disturbances.
Acknowledgments This work could not have been completed without valuable contributions from many different people. We are grateful to Baxter Hutchinson and Alessandro Bocconcelli for help with the fabrica-tion and logistics. Philippe Verborgh, Pauline Gauffier, Renaud de Stephanis and the Center for Investigation and Research on Cetaceans (CIRCE) were essential for the fieldwork evaluating the system. This paper also benefitted from useful suggestions by two anonymous re-viewers. Research was funded in part by the Office of Naval Research (grants N000140910528 and N000141210417) and the Woods Hole Oceanographic Institution Marine Mammal Center. FHJ was supported by the Danish Council for Independent Research | Natural Sciences and is currently funded by the Carlsberg Foundation. PLT was supported by the Scottish Funding Council (grant HR09011) through the Marine Alliance for Science and Technology for Scotland.
Conflict of interest The authors have no financial relationship with the sponsors.
Ethical Standards The experiments comply with Spanish and United States laws and were approved by the WHOI Institutional Animal Care and Use Committee. Fieldwork was conducted under United States National Marine Fisheries Service permit #14241 to PLT.
References
Altmann SA (1956) Avian mobbing behavior and predator recognition. Condor 58:241–253
Ballerini M, Cabibbo N, Candelier R, Cavagna A, Cisbani E, Giardina I, Orlandi A, Parisi G, Procaccini A, Viale M (2008) Empirical inves-tigation of starling flocks: a benchmark study in collective animal behaviour. Anim Behav 76:201–215
Bejder L, Samuels A, Whitehead H, Gales N (2006) Interpreting short-term behavioural responses to disturbance within a longitudinal per-spective. Anim Behav 72:1149–1158
Bode NW, Faria JJ, Franks DW, Krause J, Wood AJ (2010) How per-ceived threat increases synchronization in collectively moving ani-mal groups. Proc R Soc Lond B 277:3065–3070
Bode NW, Wood AJ, Franks DW (2011) The impact of social networks on animal collective motion. Anim Behav 82:29–38
Bradski G, Kaehler A (2008) Learning OpenCV: computer vision with the OpenCV library. O'Reilly Media, Sebastopol
Buckland ST, Anderson DR, Burnham KP, Laake JL, Borchers DL, Thomas L (2001) Introduction to distance sampling: estimating abundance of biological populations. Oxford University Press, Oxford
Cavagna A, Queirós SD, Giardina I, Stefanini F, Viale M (2013) Diffusion of individual birds in starling flocks. Proc R Soc Lond B 280:20122484
Conradt L, Roper T (2000) Activity synchrony and social cohesion: a fission-fusion model. Proc R Soc Lond B 267:2213–2218 Conradt L, Roper TJ (2003) Group decision-making in animals. Nature
421:155–158
Conradt L, Roper TJ (2010) Deciding group movements: where and when to go. Behav Process 84:675–677
Couzin ID, Krause J, Franks NR, Levin SA (2005) Effective leadership and decision-making in animal groups on the move. Nature 433: 513–516
Curé C, Antunes R, Samarra F, Alves AC, Visser F, Kvadsheim PH, Miller PJ (2012) Pilot whales attracted to killer whale sounds: acoustically-mediated interspecific interactions in Cetaceans. PLoS One 7:e52201
Da Cunha RGT, Byrne RW (2009) The use of vocal communication in keeping the spatial cohesion of groups: intentionality and specific functions. In: Garber PA, Estrada A, Bicca-Marques JC, Heymann EW, Strier KB (eds) South American primates. Springer, New York, pp 341–363
Fischhoff IR, Sundaresan SR, Cordingley J, Larkin HM, Sellier M-J, Rubenstein DI (2007) Social relationships and reproductive state influence leadership roles in movements of plains zebra, Equus burchelli. Anim Behav 73:825–831
Flack A, Freeman R, Guilford T, Biro D (2013) Pairs of pigeons act as behavioural units during route learning and co-navigational leader-ship conflicts. J Exp Biol 216:1434–1438
Gordon J (2001) Measuring the range to animals at sea from boats using photographic and video images. J Appl Ecol 38:879–887 Gueron S, Levin SA (1993) Self-organization of front patterns in large
wildebeest herds. J Theor Biol 165:541–552
Hamilton WD (1971) Geometry for the selfish herd. J Theor Biol 31:295–311 Han S, Wang J (2012) Integrated GPS/INS navigation system with
dual-rate Kalman filter. GPS Solutions 16:389–404
Hide C, Moore T, Smith M (2003) Adaptive Kalman filtering for low-cost INS/GPS. J Navig 56:143–152
Howland JC, Macfarlane N, Tyack P (2012) Precise geopositioning of marine mammals using stereo photogrammetry. In: Oceans, 2012. IEEE, Hampton Roads
Johnson MP, Tyack PL (2003) A digital acoustic recording tag for mea-suring the response of wild marine mammals to sound. IEEE J Oceanic Eng 28:3–12
King AJ, Sueur C, Huchard E, Cowlishaw G (2011) A rule-of-thumb based on social affiliation explains collective movements in desert baboons. Anim Behav 82:1337–1345
Krause J, Ruxton GD (2002) Living in groups. Oxford University Press, Oxford
Macdonald DW (1983) The ecology of carnivore social behaviour. Nature 301:379–384
Mattson MC, Thomas JA, Aubin DS (2005) Effects of boat activity on the behavior of bottlenose dolphins (Tursiops truncatus) in waters surround-ing Hilton Head Island, South Carolina. Aquat Mamm 31:133–140 Nagy M, Ákos Z, Biro D, Vicsek T (2010) Hierarchical group dynamics
in pigeon flocks. Nature 464:890–893
Nagy M, Vásárhelyi G, Pettit B, Roberts-Mariani I, Vicsek T, Biro D (2013) Context-dependent hierarchies in pigeons. P Natl Acad Sci USA 110:13049–13054
Nowacek SM, Wells RS, Solow AR (2001) Short-term effects of boat traffic on bottlenose dolphins, Tursiops truncatus, in Sarasota bay, Florida. Mar Mammal Sci 17:673–688
Parrish JK, Hamner WM (1997) Animal groups in three dimensions: how species aggregate. Cambridge University Press, Cambridge Pitman RL, Ballance LT, Mesnick SI, Chivers SJ (2006) Killer whale
predation on sperm whales: observations and implications. Mar Mammal Sci 17:494–507
Stienessen SC, Parrish JK (2013) The effect of disparate information on individual fish movements and emergent group behavior. Behav Ecol 24:1150–1160
Sumpter D, Buhl J, Biro D, Couzin I (2008) Information transfer in moving animal groups. Theory Biosci 127:177–186
Visser F, Miller PJ, Antunes RN, Oudejans MG, Mackenzie ML, Aoki Kagari A, Lam F-PA, Kvadsheim PH, Huisman J, Tyack PL (2014) The social context of individual foraging behaviour in long-finned pilot whales (Globicephala melas). Behaviour 151:1453–1477 Whitehead H, Dufault S (1999) Techniques for analyzing vertebrate
so-cial structure using identified individuals: review and recommenda-tions. Adv Study Behav 28:33–74
Whitehead H, Christal J, Tyack PL (2000) Studying cetacean social struc-ture in space and time. In: Mann J, Connor R, Tyack P, Whitehead H (eds) Cetacean societies: field studies of dolphins and whales. University of Chicago Press, Chicago, pp 65–86
Williams R, Ashe E (2007) Killer whale evasive tactics vary with boat number. J Zool 272:390–397