The Acceptability Delta Criterion: Memorization is
not enough.
by
Héctor Javier Vázquez Martínez
Submitted to the Department of Electrical Engineering and Computer
Science
in partial fulfillment of the requirements for the degree of
Master of Engineering in Electrical Engineering and Computer Science
at the
MASSACHUSETTS INSTITUTE OF TECHNOLOGY
February 2021
c
○ Massachusetts Institute of Technology 2021. All rights reserved.
Author . . . .
Department of Electrical Engineering and Computer Science
January 15, 2021
Certified by . . . .
Professor Robert C. Berwick
Professor of Computational Linguistics and Computer Science and
Engineering
Thesis Supervisor
Accepted by . . . .
Katrina LaCurts
Chair, Master of Engineering Thesis Committee
The Acceptability Delta Criterion: Memorization is not
enough.
by
Héctor Javier Vázquez Martínez
Submitted to the Department of Electrical Engineering and Computer Science on January 15, 2021, in partial fulfillment of the
requirements for the degree of
Master of Engineering in Electrical Engineering and Computer Science
Abstract
In order to effectively assess Knowledge of Language (KoL) for any statistically-based Language Model (LM), one must develop a test that is first comprehensive in its cover-age of linguistic phenomena; second backed by statistically-vetted human judgement data; and third, tests LMs’ ability to track human gradient sentence acceptability judgements. Presently, most studies of KoL on LMs have focused on at most two of these three requirements at a time. This thesis takes steps toward a test of KoL that meets all three requirements by proposing the LI-Adger dataset: a comprehensive col-lection of 519 sentence types spanning the field of generative grammar, accompanied by attested and replicable human acceptability judgements for each of the 4177 sen-tences in the dataset, and complemented by the Acceptability Delta Criterion (ADC), an evaluation metric that enforces the gradience of acceptability by testing whether LMs can track the human data.
To validate this proposal, this thesis conducts a series of case studies with Bidi-rectional Encoder Representations from Transformers (Devlin et al. 2018). It first confirms the loss of statistical power caused by treating sentence acceptability as a categorical metric by benchmarking three BERT models fine-tuned using the Corpus of Linguistic Acceptability (CoLA; Warstadt & Bowman, 2019) on the comprehensive LI-Adger dataset. We find that although the BERT models achieve approximately 94% correct classification of the minimal pairs in the dataset, a trigram model trained using the British National Corpus by Sprouse et al. 2018, is able to perform simi-larly well (75%). Adopting the ADC immediately reveals that neither model is able to track the gradience of acceptability across minimal pairs: both BERT and the trigram model only score approximately 30% of the minimal pairs correctly. Additionally, we demonstrate how the ADC rewards gradience by benchmarking the default BERT model using pseudo log-likelihood (PLL) scores, which raises its score to 38% correct prediction of all minimal pairs.
This thesis thus identifies the need for an evaluation metric that tests KoL via gradient acceptability over the course of two case studies with BERT and proposes the ADC in response. We verify the effectiveness of the ADC using the LI-Adger
dataset, a representative collection of 4177 sentences forming 2394 unique minimal pairs each backed by replicable and statistically powerful human judgement data. Taken together, this thesis proposes and provides the three necessary requirements for the comprehensive linguistic analysis and test of the Human KoL exhibited LMs that is currently missing in the field of Computational Linguistics.
Thesis Supervisor: Professor Robert C. Berwick
Acknowledgments
I must first express my gratitude for Annika Heuser, whose editing help and support was instrumental to the timely completion of this thesis. I thank Sagar Indurkhya and Prof. Norbert Hornstein for giving me the pivotal feedback that led me to the main topic of this thesis: The Acceptability Delta Criterion. Additionally I thank Prof. Charles Yang, Prof. Jordan Kodner and Dr. Robert Ajemian for encouraging me to pursue my scientific curiosities, as well as my colleagues and mentors, among them Abbie Bertics, Prof. Barbarah Lust, Beracah Yankama, Shinjini Ghosh, Prof. Suzanne Flynn, and Spencer Caplan for giving me the sandbox where my ideas have grown and developed. I give special thanks for Prof. Robert C. Berwick, who wel-comed me to this community, has advised me on my research path, and guided in the development of the project I present here.
Contents
Introduction 13
1 BLiMPs were meant to fly! 19
1.1 Assessing Knowledge of Language (KoL) . . . 19
1.2 BLiMP: The Benchmark of Linguistic Minimal Pairs . . . 20
1.2.1 Not everything on the BLiMP flies. . . 21
1.3 Taking the BLiMP to new heights . . . 24
1.3.1 The LI-Adger dataset . . . 24
1.3.2 Human Magnitude Estimation (ME) data . . . 26
1.3.3 The Acceptability Delta Criterion (ADC) . . . 27
2 Fine-tuning BERT for Acceptability Judgements 33 2.1 BERT pilots the BLiMP . . . 34
2.2 BERT drinks the CoLA . . . 35
2.3 BERT has too much to drink . . . 40
2.4 Benchmarking with the LI-Adger Dataset . . . 43
2.5 BERT takes on the ADC (ADC round 1) . . . 47
2.5.1 Correlations at the minimal pair level . . . 48
2.5.2 Applying the Acceptability Delta Criterion . . . 50
3 Evaluating out-of-the-box BERT 55 3.1 BERT Masked Language Modeling . . . 56
3.2 Correlations with human judgements . . . 57 3.3 BERT says best 2 out of 3 (ADC round 2) . . . 62
List of Figures
2-1 BERTCoLA MCC scores on CoLA Analysis Set by major feature . . . 38
2-2 BERTCoLA MCC scores on CoLA Analysis Set by minor feature . . . 39
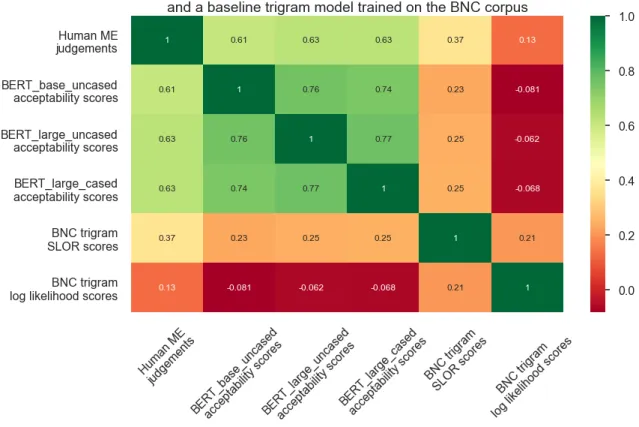
2-3 Percentage of Acrobatic Sentences in the LI-Adger test set . . . 42 2-4 PCC matrix between human judgements, BERTCoLA,
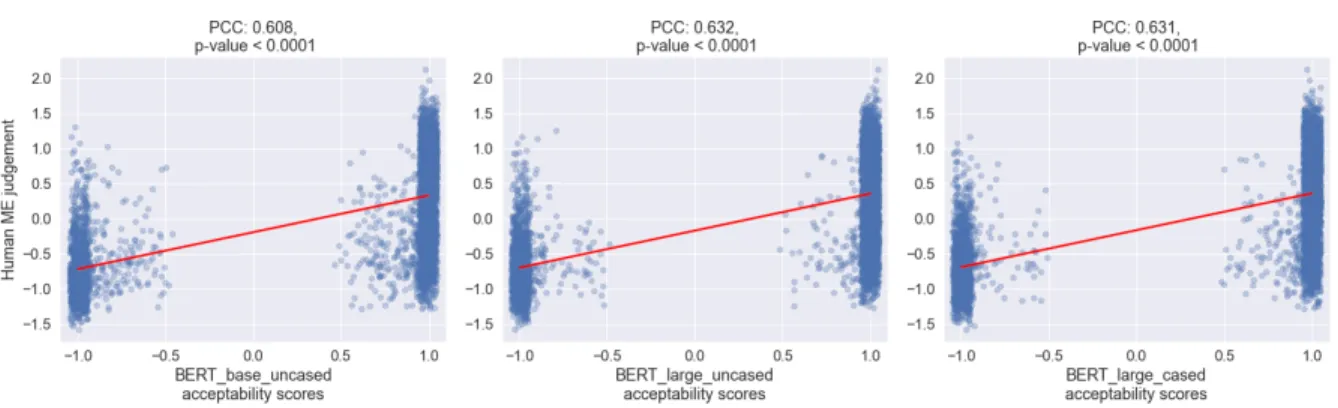
and a trigram model . . . 46 2-5 Human judgements vs. BERTCoLA acceptability scores
on LI-Adger dataset . . . 47 2-6 PCC matrix between human judgements, BERTCoLA,
and a trigram model . . . 48 2-7 Human judgement deltas vs. BERTCoLA acceptability
score deltas on LI-Adger minimal pairs . . . 50 3-1 PCC matrix between human judgements, BERT acceptability
& PLL scores, and a trigram model . . . 58 3-2 Human judgements vs. BERT acceptability & PLL scores
on LI-Adger dataset . . . 59 3-3 PCC matrix between human judgements, BERTCoLA,
BERTMLM, and a trigram model . . . 60
3-4 Human judgements vs. BERT acceptability & PLL scores
List of Tables
1.1 Four acceptable sentences from the CGI dataset . . . 23
1.2 Example multi-condition phenomenon from the Adger dataset. . . 25
1.3 Example multi-condition minimal pairs from the Adger dataset . . . . 25
1.4 Two minimal pairs for the Linguistic Inquiry (LI) dataset . . . 28
1.5 Example of the Acceptability Delta Criterion (ADC) . . . 31
2.1 MCC scores on the CoLA out-of-domain test set . . . 37
2.2 MCC scores on the CoLA test set and LI-Adger dataset . . . 44
2.3 PCCs with human data on LI-Adger sentences vs. minimal pairs . . . 49
2.4 BERTCoLA and trigram model scores under BLiMP & ADC . . . 51
2.5 Four minimal pairs where the BLiMP Criterion and ADC with 𝛿 = 5.0 differ . . . 52
2.6 BERTCoLA ADC with 𝛿 ={0.5,1.0} scores sans easy min pairs . . . 53
2.7 Four minimal pairs where BERTCoLA meets ADC with 𝛿 = 0.5 but not the trigram model . . . 53
2.8 Four minimal pairs where the trigram model meets ADC with 𝛿 = 0.5 but not BERTCoLA . . . 54
3.1 BERTMLM, BERTCoLA, and trigram model scores under BLiMP & ADC . . . 62
3.2 Four minimal pairs where BERTMLM meets the BLiMP Criterion but not the ADC with 𝛿 = 5.0 . . . 63
3.3 Four minimal pairs where BERTMLM meets the ADC
with 𝛿 = 5.0 but not the BLiMP Criterion . . . 64 3.4 Four minimal pairs where BERTCoLA meets ADC
with 𝛿 = 5.0 but the BERTMLM models do not . . . 65
3.5 Four minimal pairs where BERTMLM meets ADC
with 𝛿 = 5.0 but BERTMLM does not . . . 65
3.6 BERTMLM ADC with 𝛿 ={0.5,1.0} scores
sans easy min pairs . . . 66 3.7 Overlap between BERTMLM and BERTCoLA under the ADC . . . 67
Introduction
Assessing the Knowledge of Language (KoL) of statistically-based Language Models (LMs) generally involves assuming some fundamental property or computation occur-ring in the Human Language Faculty and arguing that a currently poorly understood, statistical, and typically connectionist model, also partakes in the use of that property or computation. This quickly becomes a problematic task because understanding the Human Language Faculty has been conventionally posed as a problem to be solved at a causal level removed from the algorithmic and computational implementation levels. Put in more abstract terms, assessing the KoL of a LM requires inferring some abstract operation inside a human black box based on input-output analysis and determining whether a second, statistical black box is somehow also performing the same operation by some other means.
The issue is made even more challenging by changes in either field that conse-quently change our assumptions surrounding the Human Language Faculty or the black boxes used in Machine Learning (ML). This, in turn, immediately impacts claims relating the two by some abstract property, linguistic or otherwise, that is required for the evaluation of LMs. If any concrete progress is to be made when it pertains to KoL in LMs, then the design of the tests we perform and their conclusions must be based on the same empirical data from current input-output analyses of the Human Language Faculty that has subsequently been used to build the linguistic theories that attempt to characterize and explain Human KoL.
This thesis takes concrete steps toward designing such a test of KoL for LMs by positing the necessary components required to build upon the same bedrock of em-pirical data as the field of generative grammar in Linguistics. First, we propose the
LI-Adger dataset, a collection of statistically powerful and attested linguistic phe-nomena representative of the field of Linguistics (Sprouse & Almeida 2012; Sprouse et al. 2013), accompanied by human acceptability judgements in the form of Mag-nitude Estimation (ME) data. Altogether, the dataset has an attested maximum False Positive (Type 1 error) rate between 1-12% and is well above the 80% threshold for statistical power (<20% False Negatives, or Type 2 errors) (Sprouse & Almeida 2017). The reliability of the LI-Adger dataset is such that, if the linguistic theories were somehow proven to be incorrect and reformulated, it would not be because of the data, but because of incorrect theorizing; any tractable theory of linguistics must account for the empirical phenomena observed in the LI-Adger dataset (Sprouse & Almeida 2012). To complement this data, we propose the Acceptability Delta Crite-rion (ADC), a proof of concept metric that enforces the gradience of acceptability in its evaluation of model performance, and adopts the continuous human judgements as the ground-truth labels that LMs must approximate in order to demonstrate KoL. Our results suggest that, when acceptability is treated as a functionally categorical metric on isolated minimal pairs of sentences as it has been traditionally treated in the literature (Linzen et al. 2016; Marvin & Linzen 2018; Wilcox et al. 2018; Warstadt & Bowman 2020; among others), the task of determining sentence acceptability fails to properly test for KoL. Under this relaxed metric, the large, cased version of Bidi-rectional Encoder Representations from Transformers (BERTlarge−cased; Devlin et al.
2018) when fine-tuned using the Corpus of Linguistic Acceptability (CoLA; Warstadt et al. 2019) (the model is henceforth referred to as BERTCoLAlarge−cased), correctly
eval-uates 2213 out of 2365 (∼94%) minimal pairs in the LI-Adger dataset; that is, for those 2213 minimal pairs, BERTCoLAlarge−cased gives a higher score to the sentence in
the minimal pair deemed by experts to be the acceptable one of the pair. We will continue to refer to this metric as the BLiMP Criterion, named after the BLiMP dataset (Warstadt et al. 2020). To put the performance of BERTCoLAlarge−cased) into
perspective, a trigram model using the Syntactic Log-Odds Ratio (SLOR; Pauls & Klein 2012; Lau et al. 2017) is able to correctly evaluate 1781 out of 2365 (∼75%) minimal pairs. Considering the coverage of phenomena in the LI-Adger dataset, we
may interpret these results in one of two ways: either metrics such as the BLiMP Criterion lead to statistically underpowered tests with a high rate of false positives, or a basic trigram model using SLOR encodes the KoL necessary to account for 75% of the phenomena in Linguistics. We opt for the first interpretation and consider this evidence of a theoretical flaw in the metric itself, not a demonstration of what the models know about language.
Adopting the ADC (with 𝛿 = 0.5), which enforces that LMs’ predictions be within a set number of standard deviation units (𝛿) from the human ME judgements, quickly changes the panorama. BERTCoLAlarge−cased only correctly evaluates 726 out of 2365
(∼31%) minimal pairs, whereas the trigram model with SLOR correctly evaluates 712 out of 2365 (∼30%). These results imply that, when it comes to tracking the acceptability of sentences across minimal pairs, the KoL encoded in BERT does not go much farther than that of an 𝑁 -gram model.
Here we proceed as follows. First, we attempt to replicate the linguistic anal-ysis of BERT conducted by Warstadt & Bowman (2020) using the grammatically annotated Corpus of Linguistic Acceptability. Over the course of this replication, we confirm evidence of underspecification in overparametrized Neural LMs as identified by D’Amour et al. (2020); McCoy et al. (2019), among others. In particular, we observe predictions on the LI-Adger sentences from BERTCoLAbase−uncased, the smallest
(i.e. least overparametrized) of the original BERTCoLA models, is extremely
sensi-tive to the order in which the CoLA training sentences are presented, even though overall performance remained relatively unchanged. We observe this behavior even within the same initialization of the model, where the only difference between two runs is the random seed used to shuffle the training data. This underspecification takes the form of instability in the LI-Adger test set predictions: sentences predicted as acceptable (1) by BERT with around 90-99% confidence flip to be predicted as unacceptable with a similar magnitude, or vice versa. We find that over the course of 200 different training orders, 1272 sentences, or roughly 30% of the sentences in the LI-Adger dataset exhibit this flipping behavior. We affectionately name this subset of sentences the Acrobatic Sentences.
Given the alarmingly high proportion of acrobatic sentences produced by the predictions from BERTCoLAbase−uncased, we find ourselves obliged to consider successful
replication as achieving Matthew’s Correlation Coefficient (MCC) scores on the CoLA test set that are reasonably close to those reported by Warstadt et al. (2020). To this end, we select the BERTCoLA models with the single best performance on the CoLA
out-of-domain test set and further test them using the LI-Adger dataset under the BLiMP Criterion. Although we find that the BERTCoLA models satisfy the BLiMP
criterion for roughly 94% of the minimal pairs, the magnitudes of their predictions do not track the degrees of acceptability exhibited by the gradient human judgements.
When benchmarking BERTCoLAmodels using the BLiMP criterion, the output of
the models is determined by multiplying the final hidden vector (⃗ℎ ∈ R𝑑) by a weight matrix 𝑊 ∈ R2x𝑑learned during the fine-tuning phase and taking the softmax of the
product, written explicitly in Equation 1.
softmax(⃗𝑥) = 𝑒
𝑥𝑖
∑︀𝑗=𝐾
𝑗=0 𝑒𝑥𝑗
(1)
The final output of the BERTCoLA models (𝑜𝑢𝑡) is then computed by taking argmax
of the two-dimensional vector resulting from the softmax, as expressed in Equation 2, thus yielding the final categorical 1/0 prediction.
𝑜𝑢𝑡 = argmax [︂
softmax(𝑊 ℎ) ]︂
(2)
However, in order to improve the BERTCoLA models’ performance apriori before
ap-plying the ADC, we adopt the labels ±1 instead of 1/0 and scale the predicted labels by the output of the final softmax classification head in Equation 1. Now we have an approximate method of knowing when the BERTCoLA models consider a sentence
completely acceptable (∼0.95), completely unacceptable (∼ -0.95), and anything in between. We confirm we do not lose any information because the categorical labels are recovered by taking the sign of the new output. The delta in the BERTCoLAlarge−cased
metric only weakly correlates with the human judgements (∼0.349, 𝑝<0.0001). For reference, conducting the same analysis with the SLOR scores of a trigram model trained on the British National Corpus (Sprouse et al. 2018) yields almost the same Pearson’s correlation coefficient (∼0.333, 𝑝<0.0001).
The above analyses by nature warrant further controls. For one, we are uncertain of what information–semantic, syntactic or otherwise–might be introduced into the BERT models by the CoLA training set itself, as opposed to already being present in their pretrained representations. Additionally, training a linear classifier on top of the BERT models’ embeddings very rarely yields a softmax output of less than 0.95, meaning most predictions were around either 0.99 or -0.99. In spite of BERT’s claimed KoL, expecting gradience from the resulting BERTCoLAafter fine-tuning using
the categorical labels could be viewed as unfair to the model due to its lack of access to gradient data. We believe this is a fair expectation because we do not have access to categorically labeled raw linguistic input during language acquisition, and we are ultimately probing the LMs for Human KoL. Regardless, we repeat the analyses on the out-of-the-box version of BERT (BERTMLM). We obtain pseudo-log-likelihood
(PLL) scores from BERTMLM by performing a variant of a Cloze test in which we
sequentially mask each word in a given sentence and retrieve the probability of the originally masked token as predicted by BERTMLM (Wang & Cho 2019; Shin et al.
2019; Salazar et al. 2019 ).1 In this task, the total PLL of a sentence 𝑠
𝑖 of length 𝑛 is
the sum total of the log-likelihood score of each of its tokens [𝑤0, ..., 𝑤𝑛], which can
be expressed as: PPL(si) = 𝑛 ∑︁ 𝑗=0 log(𝑃 (𝑤𝑗|𝑤0, ..., 𝑤𝑗−1, 𝑤𝑗+1, ...𝑤𝑛)) (3)
We find that this objective only slightly improves performance under the ADC: scor-ing 890 out of 2365 (∼38%) minimal pairs with 𝛿 = 0.5, as well as slightly
improv-1We are fully aware that Jacob Devlin himself has said that BERT is not a language model and
recommended against this sequential masked language modeling procedure (See the original issue on the Google Research GitHub repository). We point readers to Salazar et al. (2019), who report BERTMLM beats the state-of-the-art GPT-2 on BLiMP (Warstadt et al. 2020) when using PLL
ing the correlation with the human judgement deltas across minimal pairs (∼0.384, 𝑝<0.0001).
Given the results of these analyses, the contributions of this thesis are threefold. First, it highlights the importance of interpreting sentence acceptability as a gradient metric and demonstrates how exhibiting such gradience is a prerequisite to attributing any KoL to a LM. Secondly, it proposes the Acceptability Delta Criterion as a proof of concept measurement that enforces the gradience of acceptability in its evaluation of performance and adopts continuous human judgements as the ground-truth labels that LMs are expected to approximate. Finally, it presents the LI-Adger dataset of over 4000 sentences each associated to a human ME result, and approximately 2400 unique minimal pairs, each supported by an Acceptability Delta value. Because the sentences in the LI-Adger dataset have a fairly wide and representative coverage of the field of linguistics, and because the human data presented here is statistically power-ful, reliable and has been replicated on multiple occasions, researchers will hopefully adopt this data as the bedrock analysis test set of LMs against which any and all claims about their KoL can be put to the test.
Chapter 1
BLiMPs were meant to fly!
1.1
Assessing Knowledge of Language (KoL)
The success of Neural Language Models at different natural language tasks, such as Next Sentence Prediction (NSP), Machine Translation (MT) and Question Answer-ing (QA), among others1, has made it a popular endeavor to assess the potential
Knowledge of Language encoded in the learned representations of the language mod-els and how that KoL may be contributing to their performance. If one were to roughly summarize these efforts, one could group these types of analyses into two broad methodological categories: those that treat the language model as a black box and draw conclusions about the system based on thorough input-output analysis, and those that train additional classifiers (probes) to use the representations inside the black box in order to accomplish some linguistically meaningful task (Conneau et al. 2018; Elazar et al. 2020).
The probing approach requires an additional training corpus labeled with the lin-guistic concepts of interest in order to train and evaluate the probing classifier before drawing any conclusions. However, because probing relies on training an additional classifier on top of the latent (in other words: opaque and currently poorly under-stood) representations of neural LMs, it is extremely difficult to control for
confound-1For a quick collection of more natural language tasks and how different models perform on them,
ing variables, such as the information being introduced into the system by training the probing classifier in the first place (Warstadt et al. 2020). Additionally, D’Amour et al. (2020) have found substantial evidence indicating that these overparametrized neural LMs by nature exploit different sets of spurious correlations according to their random initialization in spite of exhibiting very similar performance on I.I.D. test sets. This poses a unique set of difficulties for the use of probes for any assessment of KoL in such LMs.
To compound the matter, Human KoL, due to its abstract, deliberately acom-putational nature, can only be assessed via proxies, generally by probing language acquisition or use. At present, the studies of LMs’ KoL that rely on an input-output analysis of a system tend to focus on probing their weak generative capacity: testing whether a given LM can discern whether a particular sequence of words is or is not in the set of sentences generated by some presumed corresponding grammar, typically by comparing the probabilities the LM assigns to different but related sequences of words.
We believe for these reasons that in order to effectively assess KoL for any statistically-based LM, one must develop a test that requires both KoL in the form of a grammar for a language and a mapping that describes the use of that grammar. We take steps to this end by presenting the LI-Adger dataset, a collection of roughly 4200 sentences, each backed by human Magnitude Estimation (ME) data assigning a gra-dient acceptability value to each sentence. This thesis also posits the Acceptability Delta Criterion (ADC) as a measure that enforces the gradience of acceptability when evaluating LMs, and it empirically shows how it is a step above the weak generative capacity tested by evaluating set membership.
1.2
BLiMP: The Benchmark of Linguistic
Minimal Pairs
weak generative capacity by positing the Benchmark of Linguistic Minimal Pairs for English (BLiMP). They automatically generated 67 datasets of 1000 minimal pairs each from grammar templates that span 12 linguistic phenomena. They designed the templates to contrast in grammatical acceptability by isolating specific phenomena in syntax, morphology or semantics. In doing so, the authors intend to mirror what a working linguist uses to probe KoL in native speakers of a language. Because such principles generally appeal to grammatical constraints, they go beyond simple weak generative capacity.
Although the concept of using minimal pairs is not new (Linzen et al. 2016; Marvin & Linzen 2018; Wilcox et al. 2018; to name a few), the creators of BLiMP take the idea to a much larger scale and propose a single metric for evaluation, which we will call the BLiMP Criterion. For a given minimal pair 𝑚𝑖 consisting of an acceptable
sentence 𝑠𝑖,1 and an unacceptable sentence 𝑠𝑖,2, if a LM evalutes 𝑃 (𝑠𝑖,1) > 𝑃 (𝑠𝑖,2),
then the LM has met the BLiMP Criterion for 𝑚𝑖. The authors of BLiMP thus score
a LM on the BLiMP Benchmark according to the percentage of all the minimal pairs for which it was able to fulfill the BLiMP Criterion. This, of course, can be broken down into further analyses of the 12 linguistic phenomena they sought to represent in the dataset.
1.2.1
Not everything on the BLiMP flies.
The BLiMP Criterion is met whenever the acceptable sentence of a minimal pair re-ceives a higher score or probability than its unacceptable counterpart. This setup has the unfortunate consequence of treating sentence acceptability, a metric well known to be gradient by nature (Sprouse et al. 2018), as functionally categorical. Under the BLiMP criterion, a sentence is either more acceptable or less acceptable than its counterpart, greatly simplifying the task of assigning acceptability judgements for LMs. This point is underscored by the high performance of the baseline 5-gram model in Warstadt et al. (2020), scoring 61.2% of the 67,000 minimal pairs correctly under the BLiMP Criterion. This has the immediate implication that an 𝑁 -gram model, well understood to have little to no Knowledge of Language, suddenly knows
approximately 60% of all the phenomena tested in BLiMP.
On the subject of the phenomena tested in BLiMP lies the question of whether the authors’ selection of phenomena is representative of syntax or linguistics. They very correctly point out that, because they designed the grammatical templates with an emphasis on controlling for sentence length and lexical parity, their coverage of linguistic phenomena is fundamentally limited. There is therefore no concrete notion to what achieving 60% correctness on BLiMP means, as in the case of the 5-gram model, because the KoL being tested is only the subset that can be reasonably gen-erated using a templated approach.
Templating also brings with it another problem: although the authors validate their data using human judgement data using a Forced Choice (FC) task, automatic generation leads to semantically implausible sentences. The authors argue that this semantic implausibility should not influence human subjects’ judgements because all semantically implausible sentences are pairs of an acceptable and unacceptable sentence that differ along a single feature, which should control for that confound. However, Sprouse et al. (2018) conducted a similar exercise by setting up an accept-ability FC experiment wtih Chomsky’s canonical Colorless green ideas sleep furiously sentence. They first obtained all 120 possible permutations of the 5 word sequence (henceforth the CGI dataset) and proceeded to generate all possible 7140 unique pairs of sentences from the 120 CGI sentences. Sprouse et al. (2018) ranked each CGI sentence according to the Elo chess rating system by treating each FC trial as a chess match. They found that, although the canonical sentence is perfectly well-formed, three other sentences were rated as more acceptable, shown along with their acceptability (Elo) ratings in Table 1.1 below.
Even though in theory the canonical (cgi.0) sentence should have received the highest acceptability rating out of all its other 119 permutations, it was bested by three of its kin. Although it may be argued (with some squinting) that cgi.24 and cgi.25 are also perfectly well-formed, the case is much harder to make for cgi.11. Hence semantic implausibility is a very strong confounding factor when eliciting human acceptability judgements even in FC, casting doubt on the reliability of the native
Sentence ID Sentence Elo score cgi.0 colorless green ideas sleep furiously 179.9308187 cgi.11 colorless ideas furiously sleep green 180.7792248 cgi.24 green colorless ideas sleep furiously 220.4766292 cgi.25 green colorless ideas furiously sleep 187.6557574
Table 1.1: Four sentences from the Colorless Green Ideas (CGI) dataset collected by Sprouse et al. (2018). All 120 permutations of the canonical sentence were paired with each other for a total of 7140 unique pairs. Each FC trial was treated as a chess match, and then each sentence was given an Elo chess rating according to the number of matches it won.
speakers’ judgements for this class of minimal pairs.
Lastly is the fact that the human judgements of the BLiMP data were collected using a FC task in which the human participants were asked to select the more accept-able sentence of the two in each minimal pair. Although the FC task is statistically more powerful than the Likert Scale (LS) and Magnitude Estimation (ME) tasks at detecting differences in acceptability, it is ill-suited for quantitative experiments of this nature. FC tasks only detect a difference in acceptability, but do not allow direct comparison of the magnitude of the change in acceptability (Schütze & Sprouse 2013). Hence, very valuable information is lost: a very large difference in the acceptability of two sentences in a minimal pair merits a different explanation than that of a small difference in acceptability.
By computing human performance on BLiMP based on the number of minimal pairs where the more acceptable sentence of the pair was preferred via the FC task, the authors adopt the paradigm of relying on expert labels as the ground truth in evaluation. However, the minimal pairs where the human judgements were considered to be incorrect, i.e, where the unacceptable sentence was preferred over the acceptable one under FC, can also be interpreted to mean that, for those minimal pairs in particular, the FC task could not detect an appreciable difference in acceptability. After all, the linguistic theory the phenomena come from is fundamentally derived from human data, thus it stands to reason that one may adopt the human judgements
as the true labels in the paradigm, not the expert-assigned categorical labels.
1.3
Taking the BLiMP to new heights
In this section, we explain the three major contributions of this thesis. This the-sis first presents the LI-Adger dataset collected by Sprouse & Almeida (2012) and Sprouse et al. (2013) of well over 4000 sentences each associated to a human ME result, thereby yielding approximately 2400 minimal pairs with a representative cov-erage of the field of generative syntax. To effectively use this dataset, this thesis highlights the importance of interpreting sentence acceptability as a gradient metric and demonstrate how exhibiting such gradience is a prerequisite to attributing any KoL to a LM. Lastly, this thesis proposes the Acceptability Delta Criterion (ADC) as a proof of concept measurement that begins to enforce the gradience of acceptability in its evaluation of model performance and adopts continuous human judgements as the ground-truth labels that LMs are expected to approximate.
1.3.1
The LI-Adger dataset
The LI-Adger dataset is a collection of two separate datasets. The first consists of a randomly selected sample of 150 pairwise phenomena (300 sentence types) from Linguistic Inquiry (LI) 2001-2010 collected by Sprouse et al. (2013). Each pairwise phenomena includes 8 hand-constructed, lexically matched minimal pairs such that most of the contribution of lexical information to the acceptability of the sentences would be distributed equally to the pair. For the purposes of complete transparency: 144 out of the 150 pairwise phenomena consisted of 8 lexically matched pairs of sentences. The remaining 6 phenomena consisted of 7 lexically matched pairs and one non-matched pair, because the originally published pair in LI was not lexically matched.
The second set of sentences is an exhaustive selection of 219 sentence types from Adger’s (2003) Core Syntax textbook (198 directly from the textbook + 21 created as additional controls) that form 105 multi-condition phenomena collected by Sprouse &
Almeida (2012). Much like the LI dataset, 8 tokens of each sentence type were created by hand such that the structural properties of the condition were maintained but the lexical items varied. One thing to note is that many of these sentences often have interesting names from Greek mythology in the textbook, but these were changed to common names in order to keep the proper names from biasing the native speakers’ judgements of the sentence. For the purposes of the LI-Adger dataset as a whole, we have split each multi-condition phenomenon into minimal pairs by taking each possible combination of acceptable and unacceptable sentences in the condition as a valid minimal pair. For example, the multi-condition phenomenon from Chapter 8 (Functional Categories III ) of the textbook presented in Table 1.2 below would yield the two minimal pairs presented in Table 1.3:
Sentence ID Sentence
ch8.150.*.01 Melissa seems that is happy. ch8.151.g.01 It seems that Melissa is happy. ch8.152.g.01 Melissa seems to be happy.
Table 1.2: Example multi-condition phenomenon from the Adger dataset. Note: the original sentences in the Adger textbook use the name Agamemnon, but was changed to Melissa in order to avoid any potential influence of the unfamiliar name in native speakers’ judgements.
Acceptable sentence Unacceptable sentence It seems that Melissa is happy. Melissa seems that is happy. Melissa seems to be happy. Melissa seems that is happy.
Table 1.3: Two minimal pairs constructed from a single multi-condition phenomenon from the Adger dataset. Note: the original sentences in the Adger textbook use the name Agamemnon, but was changed to Melissa in order to avoid any potential influence of the unfamiliar name in native speakers’ judgements.
The Adger dataset, in virtue of being sampled from the Core Syntax textbook, which constructs a theory of syntax from the ground up on the basis of examples, can be taken to have reasonably good coverage of the field of syntax. Add to this coverage the LI dataset, which is sampled from the 111/114 articles published in
Linguistic Inquiry about US English syntax from 2001-2010 (out of the total 308 articles published during that time). Therefore, to the extent that the Adger Core Syntax texbook and LI 2001-2010 are representative of the data in the field, so is the LI-Adger dataset. (Sprouse & Almeida 2012; Sprouse et al. 2013).
1.3.2
Human Magnitude Estimation (ME) data
Perhaps even more importantly than the coverage of linguistic phenomena represented in the LI-Adger dataset is the human judgement data that comes with it. Sprouse & Almeida (2012) collected Magnitude Estimation and Yes-No judgement data from a total of 440 native participants for the 469 data points they sampled from the Adger Core Syntax textbook. After conducting three different statistical analyses on the data (traditional null hypothesis significance tests, linear mixed-effects models, and Bayes factor analyses), they found that the maximum replication failure rate between formal and informal judgements (i.e. formal vs. informal data collection methods) was 2 percent (Sprouse & Almeida 2012; Schütze & Sprouse 2013).
Sprouse et al. (2013) took those analyses even further with their sample of 148 two-sentence phenomena from LI 2001-2010. They collected data for the LI sentences using the 7-point Likert Scale (LS) task, ME and FC and vetted it under 5 differ-ent statistical analyses (the same three as Sprouse & Almeida (2012) plus Descriptive directionality and two-tailed null hypothesis tests). They estimated a minimum repli-cation rate for journal data of 95 percent ±5 (Sprouse et al. 2013; Schütze & Sprouse 2013.
Finally, Sprouse & Almeida (2017) sampled 50 pairwise phenomena from LI dataset in a complementary study that determined the statistical power of formal linguistics experiments by task and average effect size and recommend setting the threshold for well-powered experiments at 80% statistical power. They find that the FC task would reach the 80% power threshold and detect 70% of the phenomena published in LI 2001-2010 with just ten participants, assuming each provides only one judgement per phenomenon. With fifteen participants, FC would detect 80% of the phenomena. Because the ME task has less statistical power than FC, it requires
at least thirty to thirty-five participants to reach the same 80% coverage of LI 2001-2010 as FC (Sprouse & Almeida 2017; Schütze & Sprouse 2013. Because 20 is the sample size of the human FC data in BLiMP, and the sample sizes for the LI-Adger datsets are much larger (104 participants per condition for the LI sentences and 40 for the Adger sentences), we do not forfeit any statistical power by using ME data in spite of the higher statistical power of the FC task. On the contrary, the ME task will allow us not only to perform the same type of functionally categorical acceptability comparison as the BLiMP Criterion, but also allow us to make comparisons between every condition in the dataset.
Taken together, the LI-Adger dataset is a representative collection of linguistic phenomena that have been validated multiple times over by human judgement data across ME, FC, LS and Yes-No tasks. The human ME data we include as part of the LI-Adger dataset is therefore reliable, replicable and statistically powerful. The LI-Adger dataset has the added benefit of being theory-agnostic; if linguistic theories were to fundamentally change in the future, the significance and validity of the data would remain unchanged.
1.3.3
The Acceptability Delta Criterion (ADC)
Thanks to the ME data associated with each sentence in the LI-Adger dataset, we can now make direct acceptability comparisons, not just between the two sentences of a minimal pair, but also across minimal pairs and even across phenomena. It is crucial to be able to make such direct comparisons due to the gradient nature of acceptability. Acceptability judgement experiments carry as a necessary underlying assumption that acceptability is a percept that arises in response to linguistic stimuli. Collecting data about the percept requires then that the subject report that per-ception of acceptability (Chomsky 1965; T Schütze 2016; Sprouse & Almeida 2013; Schütze & Sprouse 2013). Consequently, acceptability judgements are a behavioral response that may vary in intensity, much like brightness, loudness, temperature, pain, etc. The degree of this response is inherently informative, in particular because acceptability is the behavioral output of the grammatical system, to which neither
speakers nor linguists have direct access.
In order to illustrate the informativeness of adopting gradient acceptability judge-ments and of being able to make direct comparisons across minimal pairs with the ME data, take as an example the following two minimal pairs:
Sentence ID Sentence ME zscore
32.3.Culicover.7a.g.01 John tried to win. 1.453262 32.3.Culicover.7b.*.01 John tried himself to win. -0.86729 33.2.bowers.7b.g.07 Sarah counted the change accurately. 1.230412 33.2.bowers.7b.*.07 Sarah accurately counted the change. 1.20698 Table 1.4: Two minimal pairs for the Linguistic Inquiry (LI) dataset collected by Sprouse & Almeida, 2012. The ME zscore is the averaged zscore transformation of the Magnitude Estimation results across 104 different experimental participants.
It is clear that the difference in acceptability across the Culicover minimal pair is vastly different from the difference across the Bowers minimal pair in Table 1.4. In fact, the average ME rating for the expert-labeled unacceptable Bowers sentence (33.2.bowers.7b.*.07) is much higher than many other sentences in the data that are expert-labeled as acceptable, meaning the 104 participants that were asked to rate this sentence found it statistically completely acceptable. This type of information is absolutely crucial when evaluating whether a LM has knowledge of any particu-lar linguistic phenomenon, yet this information is lost when analysing performance according to the BLiMP criterion.
To this end, we propose the Acceptability Delta Criterion (ADC). It is founded on the principle that, if we are to ascribe any inferred knowledge of one black box (the Human Language Faculty) to another black box (Neural Language Models) based solely on an input-output analysis of both systems, then the response of both systems must agree both categorically and in magnitude. In other words, for a minimal pair such as the Culicover pair in Table 1.4 whose change in human acceptability rating is nearly night and day, a language model with comparable KoL will output a similarly drastic change in acceptability rating across the same minimal pair.
function 𝑓 that takes in a sequence of words 𝑥𝑖 and outputs a score 𝑦𝑖. The first step
in the ADC is to understand the range of values output by the language model 𝐿 over the 4179 LI-Adger sentences: 𝑌 = [𝑦1, 𝑦2, ..., 𝑦4179]. With the full range of value,
we apply a z-score transformation to each of the values in 𝑌 by subtracting the mean of 𝑌 from each of the values and then dividing them by the standard deviation of 𝑌 . This will yield the set z-score transformed predictions 𝑍 = [𝑧1, 𝑧2, ..., 𝑧4179]. Notice
that because this is a purely linear transformation, it preserves the relationships between the data points. In addition, the resulting set of predictions 𝑍 represents a standardized form of 𝑌 , where each prediction 𝑧𝑖 is expressed in standard deviation
units of 𝑦𝑖 from the mean of 𝑌 (Schütze & Sprouse 2013).
One may argue that even though the human ME data and the scores output by the LM, because the scales are by nature fundamentally different, cannot be compared even when expressed in standard deviation units. Let us assume for a moment that what we obtain from the LM is a probability distribution over the sequence of words (as per the canonical definition of a LM). That means that whatever is output by the LM is bounded in the range [0, 1], yet we typically work with log probabilities in this context, so the range of possible values becomes (−∞, 0] assuming there is some smoothing in place such that we do not attempt to calculate the logarithm of 0. Strictly speaking, the range of log probabilities is upper- and lower-bounded, but in practice it is mostly upper-bounded. Turning to ME data, the participant is asked to use a reference sentence as a unit of measurement to estimate how acceptable the target sentence is. For example, given a reference sentence 𝑎 and a target sentence 𝑏, the participant must give an estimate of how acceptable 𝑏 is by using 𝑎 as a unit of measurement. I.e. 𝑏 is four times more acceptable than 𝑎, or 𝑏 is half as acceptable as 𝑎. This means that the scale is theoretically lower-bounded by 0 (which could be argued to be absolute unacceptability), but open-ended and infinite on the upper range of the scale. In practice, participants seem to use the ME task as a Likert Scale with more response options. Both original units of measurement then (ME and log probabilities) are scales bounded on one end and open on the other end. Converting both to standard deviation units converts them to an unbounded scale,
which Schütze and Sprouse argue not to be an issue even for LS measurements, which are both discrete and bounded at both ends of the scale (Sprouse 2011; Schütze & Sprouse 2013).
Now that we have grounds for making the comparison and a value for how accept-able the model 𝐿 finds a sequence of words 𝑥𝑖 in terms of standard deviation units
𝑧𝑖, we can begin to compare the degree of this acceptability response to the human
judgement data, also expressed in standard deviation units. For a given minimal pair 𝑚𝑖 consisting of an acceptable sentence 𝑠𝑖,1 and an unacceptable sentence 𝑠𝑖,2,
we will have 4 pieces of information: two human Z-score transformed acceptability judgements ℎ𝑖,1 and ℎ𝑖,2, and two language model scores 𝑧𝑖,1 and 𝑧𝑖,2. We turn these
into two concrete points of comparison: a human acceptability delta ∆ℎ𝑖 = ℎ𝑖,1− ℎ𝑖,2
and a language model acceptability delta ∆𝑙𝑚𝑖 = 𝑧𝑖,1− 𝑧𝑖,2. In this new formulation,
no information has been lost. Recall that the BLiMP Criterion is met for the mini-mal pair 𝑚𝑖 when the language model scores the acceptable sentence higher than the
unacceptable one, i.e. ∆𝑙𝑚𝑖 > 0.
With the fully defined delta values as well as a reformulated BLiMP Criterion in terms of the delta values, we may finally proceed to define the ADC. Let 𝛿 be a scalar value indicating the number of maximum allowed units of deviation between the human judgement delta ∆ℎ𝑖 and the language model delta ∆𝑙𝑚𝑖. Using this 𝛿
value, we consider the ADC to be met for the minimal pair 𝑚𝑖 when the following
two conditions are met:
sign(∆ℎ𝑖) = sign(∆𝑙𝑚𝑖) (1.1)
|∆ℎ𝑖 − ∆𝑙𝑚𝑖| < 𝛿 (1.2)
The 𝛿 parameter in Equation 1.2 can be adjusted to allow for larger or smaller amounts of deviation between the human and LM acceptability deltas. If 𝛿 is set to a large number, the ADC functionally becomes the BLiMP Criterion because it is dominated by Equation 1.1. The main difference would be that, instead of comparing the expert labels to the LM’s output, the human judgements would become the ground
truth. For example, if 𝛿 is set to a very large number, and the human ME data find the expert-labeled unacceptable sentence as more acceptable than the expert-labeled acceptable counterpart, then the LM is expected to follow the same monotonicity.
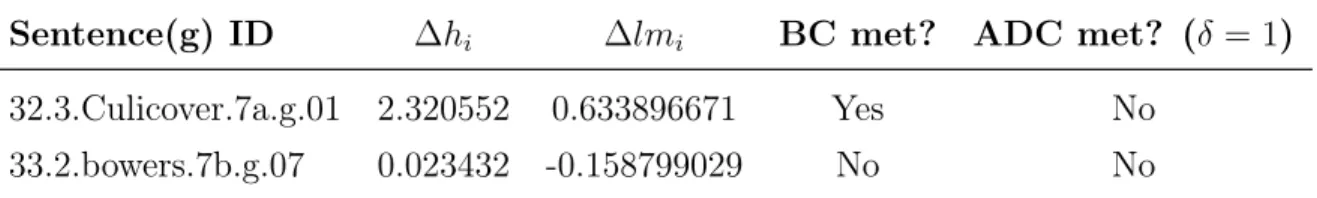
As an example of the ADC in action, consider the minimal pairs from Table 1.4, expressed in Table 1.5 in terms of the Sentence ID of the grammatical sentence. We show the acceptability delta values for the log probabilities of a simple trigram model trained on the British National Corpus (Sprouse et al. 2018), as well as the human acceptability deltas. We also include two columns indicating whether the BLiMP Criterion (BC) or Acceptability Delta Criterion (ADC) was met.
Sentence(g) ID ∆ℎ𝑖 ∆𝑙𝑚𝑖 BC met? ADC met? (𝛿 = 1)
32.3.Culicover.7a.g.01 2.320552 0.633896671 Yes No 33.2.bowers.7b.g.07 0.023432 -0.158799029 No No
Table 1.5: The two minimal pairs from Table 1.4 with acceptability delta values from the human judgements and log probability scores from a trigram trained by Sprouse et al. (2018) on the British National Corpus (BNC). The last two columns show whether the BLiMP Criterion (BC) or the Acceptability Delta Criterion (ADC) was met.
Although we maintain the ADC is posited here as a proof of concept, we hope that its simplicity appeals to the intuition that a LM’s acceptability judgements must track those of native speakers both in absolute terms (categorically) and in magnitude of the response if any KoL is to be claimed. For this reason, this thesis withholds from determining a final value of 𝛿, as it is both the subject of ongoing work and will likely be the topic of debate. Instead, this thesis adopts a first and second approximation of 𝛿 = 0.5 and 𝛿 = 1 for the case studies used to study the results of the Acceptability Delta Criterion.
Chapter 2
Fine-tuning BERT for Acceptability
Judgements
Although we have expressed our qualms regarding the probing approach to assessing the KoL of Neural LMs in Section 1.1, we believe it important to explore this avenue nonetheless, even if to a limited extent. Pre-trained Transformer-based models encode a large body of general knowledge, but are poorly optimized for specific natural language tasks out of the box. Therefore, in order to get optimal downstream task performance, it may be advantageous to fine-tune the pre-trained Transformer model on a downstream task with domain-specific data (Radford et al. 2018; Devlin et al. 2018).
Our task of interest is obtaining acceptability judgements over entire sequences of words from BERT in order to compare them across the LI-Adger minimal pairs under two different criteria. We do not want to discount the possibility that BERT’s performance may improve on either criterion by fine-tuning the model for sequence classification specifically. We formulate the sequence (acceptability) classification task and training as follows.
When given a sequence of words 𝑠𝑖, BERT’s final hidden layer will produce an
encoded sequence output ℎ𝑖. Accordingly, we proceed to train a linear output layer
that maps via a learned weight matrix 𝑊 the encoded sequence output ℎ𝑖 to a
terms of the softmax function (Equation 1), written formally as Equation 2.1 (Sun et al. 2019).
𝑃 (𝑐𝑗|ℎ) = softmax(𝑊 ℎ𝑖) (2.1)
We will loosely interpret the output of the softmax in the final layer as the model’s confidence in a particular label, or how acceptable or unacceptable BERT finds a particular sequence of words to be. To clarify, although Sun et al. (2019) define the output of the softmax in Equation 1 as a true probability, hence why we refer to it as confidence, Guo et al. (2017) among others have found that in order for the softmax output of a neural network to be considered a true probability or confidence, it must be calibrated to the true correctness likelihood via other post-processing methods currently unavailable to us. For example, there is currently no complete theory of the gradient nature of acceptability that can produce the gradient acceptability score for a given sentence on demand (Sprouse & Almeida 2012). However, without confidence calibration, Guo et al. (2017) find the softmax output of modern neural networks often overestimates the true underlying probabilities. Conversely, when BERT is used to predict the probability of a token (Masked Language Modeling - MLM), a similar softmax operation is performed to yield what is considered the true probability of the target token. We do not adopt a particular stance on the matter and will simply use the italicized term confidence to refer to the softmax output as formulated in Equation 2.1 by Sun et al. (2019).
2.1
BERT pilots the BLiMP
Over the course of this chapter and the remainder of this thesis, we will be working with Bidirectional Encoder Representations from Transformers (BERT; Devlin et al. (2018)). We determined BERT to be the ideal model to test due to the growing body of research attributing ever greater KoL to BERT. Warstadt & Bowman (2019) have already shown high Matthews Correlation Coefficient (MCC; Matthews 1975) scores between the expert acceptability labels for the sentences in the Corpus of Linguis-tic Acceptability (CoLA; Warstadt et al. 2019) and BERTCoLA models’ predictions.
These researchers have gone on to show with a grammatically annotated CoLA anal-ysis set that BERTCoLA models exhibit very strong positive MCC scores on multiple
syntactic features. For example, they claim BERT exhibits strong knowledge of com-plex or noncanonical argument structures such as ditransitives and passives, and has a distinct advantage over baseline performance on sentences with long-distance de-pendencies such as questions. Additionally, Manning et al. (2020) have approximated sentence tree structures by linearly transforming BERT’s learned representations into a metric that captures parse tree distances. Finally, Salazar et al. (2019) used the raw psuedo-log-likelihood (PLL; Wang & Cho 2019; Shin et al. 2019; Salazar et al. 2019) from the out-of-the-box BERTMLMlarge−casedto evaluate its KoL using the BLiMP
benchmark and found it to correctly predict 84.8% of the minimal pairs in BLiMP, thereby beating GPT-2 by 4.2% and almost reaching the human baseline at 88.6%. As we will demonstrate below, we do not align ourselves with many of the claims we have reviewed here regarding the KoL encoded in BERT. Nonetheless, we believe it important to provide background for the claims that have recently been made in the field.1 We will take the information provided here as the baseline level of performance
we will expect from BERT moving forward: in other words, we do not believe it unfair given these results to a priori expect BERT to exhibit the same or a similar level of gradience in acceptability judgements across minimal pairs to that of humans.
2.2
BERT drinks the CoLA
In order to provide BERT with the best possible chance of achieving maximum perfor-mance in our proposed test of KoL using the LI-Adger dataset and the ADC, we begin our analyses of BERT by first replicating the results observed by Warstadt & Bow-man (2019)(henceforth W&B 2019). This replication serves two purposes: to ensure that our training regime did not inadvertently cripple BERT in any meaningful way, and to have an objective data point of how performance on phenomena attributed
1For a recent review of the knowledge of language that has been attributed to BERT, see A
to BERT such as noncanonical argument structures, as W&B argued, translates to performance on the ADC.
We use the Huggingface Transformers library (Wolf et al. 2020) to fine-tune three pre-trained versions of BERT in order to be comprehensive in our coverage: 10 random seeds of BERTCoLAbase−uncased, 20 random seeds of BERTCoLAlarge−uncased, and 20 random
seeds of BERTCoLAlarge−cased. Here we note a slight divergence from the authors in
methodology. W&B 2019 noted they trained 20 random restarts of BERTCoLAlarge
(we suspect the cased version) and discarded 5 out of the 20 restarts because they were degenerate, i.e. those restarts yielded an MCC of zero on the CoLA test set. Instead of training a fixed number of seeds and then discarding the degenerate ones, we continued training seeds until we reached 20 nondegenerate random restarts of BERTCoLAlarge−uncased and BERTCoLAlarge−cased.
We recreate in Table 2.1 below an updated version of the table of MCC scores on the CoLA test set presented by W&B both in 2018 and 2019. We add a column to indicate the authors responsible for training the model and include our three trained models in the comparison. Additionally, we include two models submitted by Ja-cob Devlin to the GLUE Leaderboard for additional points of comparison, although we assume the scores presented in the leaderboard are the maximum MCC scores achieved by the models on the CoLA out-of-domain test set.
Our mean MCC scores for BERTCoLAlarge−cased were within error margins of the
BERTCoLAlarge model reported by W&B 2019. Additionally, the maximum MCC
score achieved here by BERTCoLAlarge−cased beat the score posted by Jacob Devlin on
the GLUE Leaderboard, and was less than 0.01 away from the maximum MCC score posted by W&B’s BERTCoLAlarge. We consider these results to be strongly indicative
of successful replication, given the known stochastic variation in such models, and proceed to conduct the remainder of the linguistic analyses presented by W&B 2019 using the CoLA analysis set. However, we focus our analyses exclusively on the three BERTCoLA models we trained, and do not replicate the results of the other models,
as they are not the focus of this thesis.
ModelCoLA Mean (STD) maximum Ensemble Authors
CoLA baseline 0.320 (0.007) 0.330 0.320 W&B 2019
GPT 0.528 (0.023) 0.575 0.567 W&B 2019
BERTlarge 0.582 (0.032) 0.622 0.601 W&B 2019
Human 0.697 (0.042) 0.726 0.761 Warstadt et al. 2018 BERTbase−uncased 0.478 (0.018) 0.514 0.522 Héctor & friends
BERTlarge−uncased 0.542 (0.019) 0.583 0.578 Héctor & friends
BERTlarge−cased 0.574 (0.026) 0.613 0.588 Héctor & friends
BERTbase 0.521* (N/A) 0.521* 0.521* Jacob Devlin
BERTlarge 0.605* (N/A) 0.605* 0.605* Jacob Devlin
Table 2.1: Replication of Warstadt & Bowman (2019) with our trained BERTCoLA
models for comparison. Performance (MCC) on the CoLA test set, including mean over restarts of a given model with standard deviation, maximum over restarts, and majority prediction over restarts. We include the BERTCoLA scores on the GLUE
leaderboard for the CoLA task submitted by Jacob Devlin for further points of ref-erence.
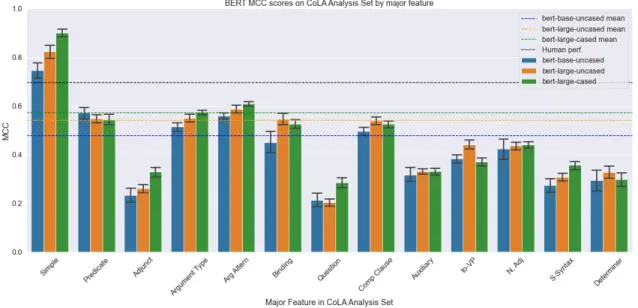
trial seems even more promising. In Figure 2-1 below we replicate the first figure in W&B 2019, which shows model performance by major syntactic feature in the CoLA analysis set. We deviate slightly from the authors when plotting mean MCC performance. While they use dashed lines to show MCC performance on the entire CoLA development set, we use them to show MCC performance on the CoLA out-of-domain test set as a follow up to the MCC scores presented in Table 2.1.
Unfortunately, the major features in the CoLA analysis set are where our success-ful replication ends. By that we mean that studying the finer-grained minor features in the analysis set reveals what the MCC scores on the test set and major features have obscured. Much like Figure 2-1, we replicate the second figure in W&B 2019 in Figure 2-2, but again using the average CoLA out-of-domain test set MCC scores presented in Table 2.1 as the horizontal dashed lines.
The added resolution of the minor features reveals somewhat erratic behavior from the three different BERT models. For one, we observe degenerate performance (MCC = 0) on a number of features, but most notably sentences that contain Complement
Figure 2-1: Replication of Warstadt & Bowman (2019) with our BERTCoLA models
for comparison. Performance (MCC) on CoLA analysis set by major feature. Dashed lines show mean performance on the CoLA out-of-domain test set. From left to right, performance for each feature is given for base-uncased, large-uncased, and large-cased.
Clause Subjects (CP Subj), Raising, or Noun-Noun Compounds (NNCompd) toward the right-hand side of Figure 2-2. Thankfully, we only see this degenerate behavior from BERTCoLAlarge−cased in NNCompd, but also observe very low MCC scores for a
handful of other features. Most notably, the BERTCoLA models perform the worst on
the Question major feature in Figure 2-1, which also translates to poor performance on Matrix Questions (Matrix Q) and Embedded Questions (Emb Q). Other under-performing minor features of note are the Miscellaneous Adjuncts (Misc), Modal Verbs (Modal) and Negation (Neg). We believe this to be a manifestation of the underspecification phenomenon identified by D’Amour et al. (2020), where near iden-tical performance on I.I.D. test sets is nonetheless met with different combinations of spurious and meaningful correlations acquired during training. Although we do not proceed to investigate the extent of this underspecification behavior as it pertains to W&B 2019, we do investigate to what extent this may be reflected when testing performance on the LI-Adger dataset.
Given the positive MCC results by BERTCoLAlarge−cased on the CoLA out-of-domain
Figure 2-2: Replication of Warstadt & Bowman (2019) with our trained BERTCoLA
models for comparison. Performance (MCC) on CoLA analysis set by minor feature. Dashed lines show mean performance on the CoLA out-of-domain test set. From left to right, performance for each feature is given for base-uncased, large-uncased, and large-cased.
in the analysis set, we are satisfied with the performance of our BERTCoLAlarge−cased
model’s performance. Accordingly, we select the random restart that yielded the maximum MCC score reported in Table 2.1 as the model to be studied in our later analyses. Lastly, we have grounds to believe our failure to replicate exact results on the CoLA analysis set’s minor features is not the fault of our training regime or
choice of hyperparameters, but rather a consequence of the overparametrization that is characteristic of the BERT models, and almost certainly all neural LMs (D’Amour et al. 2020).
2.3
BERT has too much to drink
The volatility in the three BERTCoLAmodels’ predictions revealed by our attempts to
replicate the results of Warstadt & Bowman (2019) warrants further investigation. As we briefly alluded to in Section 2.2, we do not intend to assess the degree of instability in the CoLA analysis set, nor do we wish to make claims regarding the validity of the KoL attributed to BERT as a result of Warstadt & Bowman’s findings. Our interest here is simple: we want to know how and to what degree the overparametrization of the BERTCoLA models may affect the results we observe when obtaining
accept-ability judgements from BERTCoLA on the LI-Adger sentences before applying the
Acceptability Delta Criterion.
Due to limited computational resources, we conduct the following experiment. We initialize a single instance of pre-trained BERTbase−uncased with a linear classification
head as expressed in Equation 2.1 at the beginning of the chapter. This is the only point in the experiment where a model is initialized, so the weight matrix 𝑊 in the linear output layer will always have the exact same starting weights. Next, we make a full copy of the model in order to keep the base initialization without any fine-tuning, and perform fine-tuning on the second copy using the CoLA. However, before performing the fine-tuning, we shuffle the order of the training data according to one random seed. After the fine-tuning process, we gather a categorical acceptability prediction from BERTCoLAbase−uncased for each sentence in the LI-Adger sentence by
selecting the label with the highest softmax output. I.e. for the sentence Colorless green ideas sleep furiously (𝑠𝑖), one random seed of BERTCoLAbase−uncased outputs a
softmax value of 0.168 for the the unacceptable label (𝑃 (𝑐𝑗 = 0|ℎ𝑖) = 0.168), and a
softmax value of 0.832 for the acceptable label (𝑃 (𝑐𝑗 = 1|ℎ𝑖) = 0.832). Therefore, we
the model’s output 𝑜𝑢𝑡𝑖 more succinctly as follows: 𝑜𝑢𝑡𝑖 = argmax 𝑐𝑗∈{0,1} [︂ 𝑃 (𝑐𝑗|ℎ𝑖) ]︂ (2.2)
Although we change this paradigm for later analyses, we continue to use the categori-cal output for this particular experiment because it allows us to categori-calculate performance using MCC as in the CoLA out-of-domain test set, which is where we first identified this particular instability.
We repeat the process of cloning BERTbase−uncased and fine-tuning the copy with
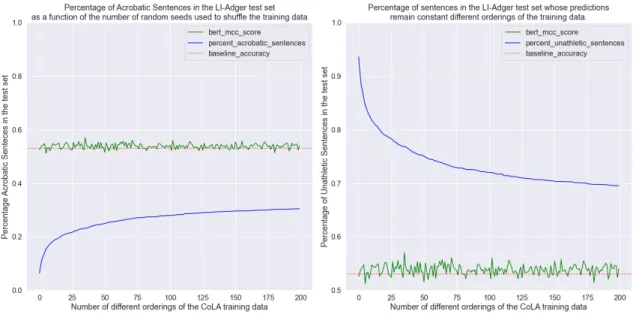
the reshuffled CoLA training set 200 times. That is, the exact same BERT model is trained on the same data, but shuffled into 200 different orders. Each time we col-lect the fine-tuned model’s categorical predictions for the sentences in the LI-Adger dataset, we compare them to the previous seed’s predictions. Every sentence whose predicted label changes between the previous and current random seed is considered an “Acrobatic Sentence" due to its exhibited fipping behavior in response to a re-ordering of the training data. For the sake of consistency, we name the sentences whose predictions remain constant the “Unathletic Sentences," because they do not flip back and forth. We plot the percentage of the LI-Adger sentences that fall into the set of Acrobatic Sentences as a function of the number of different training orders used to fine-tune BERTCoLAbase−uncased in Figure 2-3. We additionally plot the baseline
accuracy of a majority-class predictor.
The pattern of instability in Figure 2-3 has important negative implications for the strength of any conclusions that can be drawn regarding BERT if it needs to be fine-tuned as part of the experiment. Recall this instability arises from the funda-mentally underdetermined system of equations the model is trying to solve, which by nature either have no solutions or infinitely many solutions. By having more param-eters than data points, BERT, as well as any other such overparametrized model, is able to settle on an unknown number of spurious correlations that may yield good performance on I.I.D. test sets (D’Amour et al. 2020). Figure 2-3 shows that while BERTCoLAbase−uncased has a relatively constant MCC score on the LI-Adger dataset,
Figure 2-3: As the same initialization of BERTCoLAbase−uncased is fine-tuned in different
random orders, the percentage of sentences in the test set that become Acrobatic Sen-tences (left) and the percentage of senSen-tences whose predicted labels remain constant (Unathletic Sentences–right). The MCC score achieved by BERT on the LI-Adger dataset at each random seed is plotted in green. The baseline accuracy of a majority-class predictor is plotted in orange.
it changed its predictions for 1272 out of the 4178 total sentences in the LI-Adger dataset. What is more sobering is the fact that we performed this test with the BERTbase−uncased model, the version of BERT with the fewest parameters. Although
we do not conduct the same test with BERTlarge−cased out of a lack of computational
resources, we have no reason to believe this instability will be any less pronounced. On the contrary, because we are effectively tripling the number of free parameters (from 110M in BERTbase to 340M in BERTlarge) in an already underdetermined system of
equations, we expect nothing other than an even more severe instability.
At this point we can summarize what this implies for our Acceptability Delta Criterion test using the LI-Adger dataset. We briefly discussed in Section 1.1 why we do not believe probing to be the best approach to assessing the KoL of neural LMs. The results observed in Figure 2-3 are strong evidence for the lack of reliability of such experiments. However, we will proceed to study the performance of BERTCoLA
We will not yet dismiss the argument that BERT must be fine-tuned for sequence classification in order to perform its best (Sun et al. 2019). However, we will evaluate BERT by adopting some of the recommendations of D’Amour et al. 2020.
Let us momentarily set aside the scientific question and consider BERT for what it is: an engineering achievement capable of state-of-the-art performance in deployment of multiple different NLP services and tasks such as Google Search. If we take the LI-Adger dataset as an example of data that will be observed in deployment, then we cannot select a BERT model to evaluate according to MCC performance on the LI-Adger dataset. After all, if one had access to the data that that will be seen in deployment... what would be the point of all the research that has been conducted for Machine Learning models to generalize beyond the training data? Consequently, we select the BERTCoLA model to evaluate according to MCC performance on the
CoLA out-of-domain test set, and then evaluate its performance on an entirely unseen LI-Adger dataset.
The last point we wish to make is that we select a single model out of the multiple random restarts of each of the BERTCoLA models instead of averaging predictions
across them. This is in part because the ML pipeline typically selects the model that best performs on the held-out test set and uses it in deployment. The principal reason for this approach, however, is that we wish to evaluate the KoL contained in the model. By averaging the predictions of multiple different random restarts of the same model, especially with the degree of instability observed in Figure 2-3, we might mask anything meaningful that we could learn about the models, because the test would amount to evaluating the average of many different spurious correlations, even if it results in better performance overall.
2.4
Benchmarking with the LI-Adger Dataset
Having evaluated all the models on the CoLA out-of-domain test set, we select the best performing random restart of each model to evaluate under the Acceptability Delta Criterion using the LI-Adger dataset. However, before applying the Acceptability
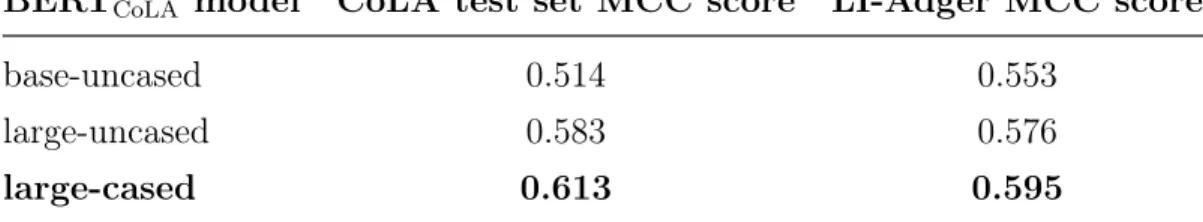
Delta Criterion, we treat the LI-Adger dataset as if it were the CoLA test set: We assign each sentence its original, categorical (1/0) expert label and evaluate each model’s MCC performance on the LI-Adger. This is to ensure that the LI-Adger dataset is not a priori too easy or too hard for the models. Table 2.2 displays the MCC scores of the best performing BERTCoLA models both on the CoLA
out-of-domain test set and the LI-Adger dataset.
BERTCoLA model CoLA test set MCC score LI-Adger MCC score
base-uncased 0.514 0.553
large-uncased 0.583 0.576
large-cased 0.613 0.595
Table 2.2: MCC scores for each of the chosen BERTCoLA models on the CoLA
out-of-domain test set and the LI-Adger dataset when using the expert labels as the true labels to be predicted. The models selected had the highest MCC score on the CoLA out-of-domain test set out of all the other random restarts.
The MCC scores on the LI-Adger dataset presented in Table 2.2 confirm that there is no overt abnormality in the BERTCoLA models’ behavior with the dataset.
The next step is to evaluate how the models’ predictions correlate with the human judgements on an individual sentence level. In order to do this, we need to make the models’ predictions gradient, which is also a prerequisite of the Acceptability Delta Criterion. The first change we make is to update our expert labels to be ±1 instead of 1/0. Now recall our example from Section 2.3 with the sentence Colorless green ideas sleep furiously. Rewriting the model output with the new labels would look as follows: 𝑃 (𝑐𝑗 = −1|ℎ𝑖) = 0.168, and 𝑃 (𝑐𝑗 = 1|ℎ𝑖) = 0.832. The traditional paradigm
calls for selecting the label 𝑐𝑗 with the highest softmax output as the categorical
prediction, but what we will do is multiply the chosen label by the model’s confidence in that label. This results in the following equation describing each BERTCoLAmodel’s
output 𝑜𝑢𝑡𝑖 for sentence 𝑠𝑖:
𝑜𝑢𝑡𝑖 = argmax 𝑐𝑗∈{−1,+1} [︂ 𝑃 (𝑐𝑗|ℎ𝑖) ]︂ * max 𝑐𝑗∈−1,+1 [︂ 𝑃 (𝑐𝑗|ℎ𝑖) ]︂ (2.3)