HAL Id: hal-03034998
https://hal.archives-ouvertes.fr/hal-03034998
Submitted on 2 Dec 2020HAL is a multi-disciplinary open access
archive for the deposit and dissemination of sci-entific research documents, whether they are pub-lished or not. The documents may come from teaching and research institutions in France or abroad, or from public or private research centers.
L’archive ouverte pluridisciplinaire HAL, est destinée au dépôt et à la diffusion de documents scientifiques de niveau recherche, publiés ou non, émanant des établissements d’enseignement et de recherche français ou étrangers, des laboratoires publics ou privés.
STUDY OF THE TEMPERATURE OF CEREBRAL
ARTERIAL BLOOD FLOW, FOR THE
CHARACTERIZATION OF THE DEGREE OF
STENOSIS: APPLICATION TO STROKE
J.R. Tsafack Nzifack, J. S. Mabekou Takam, Rostand Moutou Pitti, Medard
Fogue, Pierre Kisito Talla
To cite this version:
J.R. Tsafack Nzifack, J. S. Mabekou Takam, Rostand Moutou Pitti, Medard Fogue, Pierre Kisito Talla. STUDY OF THE TEMPERATURE OF CEREBRAL ARTERIAL BLOOD FLOW, FOR THE CHARACTERIZATION OF THE DEGREE OF STENOSIS: APPLICATION TO STROKE. Journal of Materials Science and Engineering A, 2020, 10 (2), �10.17265/2161-6213/2020.3-4.004�. �hal-03034998�
STUDY OF THE TEMPERATURE OF CEREBRAL ARTERIAL BLOOD
FLOW, FOR THE CHARACTERIZATION OF THE DEGREE OF
STENOSIS: APPLICATION TO STROKE
, , , ,
1:Unité de Recherche de Mécanique et de Modélisation des Systèmes Physiques (UR2MSP), Université de Dschang, Cameroun
2 : Département de Génie Civil, Université de Clermont Ferrand, France
3 : Laboratoire d’ingénierie des systèmes industriels et de l’Environnement (LISIE), IUT Fotso Victor de Bandjoun, Cameroun
* : Corresponding author : tpierrekisito@yahoo.com
ABSTRACT
Based on the biological heat transfer equation of Penne, the internal temperature distribution of the biological tissue was studied, taking into account the evolution of stenosis and hematocrit. The one-dimensional simplifying cylindrical heat equation of the biological living tissues in permanent regime was solved by the finite difference method and analytically, to assess the temperature change under the variation of stenosis, hematocrit, thermal conductivity, kinematic viscosity, generation of metabolic heat and the heat transfer coefficient. The main results show that the temperature increases as the stenosis and hematocrit increase in size; and the secondary results show that the heat transfer coefficient and the thermal conductivity lower the body temperature while metabolic heat generation increases body temperature. This is in accordance with the literature.
KEYWORDS: Temperature, Penne’s equation, Stenosis, Hematocrit INTRODUCTION
With the advancement of clinical medicine in thermal diagnosis of diseases, it is very important to understand thermal phenomena and the behavior of biological body temperature. One approach is to study the distribution of temperature in biological tissue. However, precise thermal analysis of biological tissue is difficult because they include conduction, convection, radiation, internal metabolism, evaporation, phase change and the regulation of the inherent temperature. Not only is the tissue heterogeneous and anisotropic, but the mechanisms also maintaining body temperature, such as blood flow and metabolic heat generation. Recently, the development of research shows that the problem of heat transfer in biological tissues becomes a complex problem. But there are several discussions without conclusion in this area. Thus in (HenneryPennes, 1948) proposed a simple linear mathematical model to describe the thermal interaction between human tissue and perfused blood, and the effect of metabolism. He measured the radial temperature in the forearm by drawing thin thermocouples through the arms of nine elongated subjects. This was based on experimental observation. Using this experimental concept, the model (Mitchell and Myers 1968), the model (Keller and Seiler 1971), the model (Wulff 1974), the model (Chen and Holmes 1980), the model (Weinbaum and Jiji 1985), the model (Khaled and Vafai 2003), (Nakayama and Kuwaha Model 2008) have discussed thermal behavior in various constant parameters with human tissue layers. The
distribution of temperature takes over in the blood and arterial tissues. (Cooper and Trezek 1972) found an analytical solution of heat diffusion equation for brain tissue with negligible effect on blood flow and metabolic heat generation. (D. B. Gurung 2007) studied the abnormal thermoregulation model in the human dermal part. He also studied the temperature distribution in the steady state and in the unstable state in three layers of the dermal part. He also used the numerical method for the finality of the techniques of solution which is the most precise for the analysis of the temperature in the human body. (Hen and Dil 2018) study the effect of the thermal parameters of the dermal part in living cylindrical tissues. For the different models which have been investigated in literature, none of them did not considered the effect of hematocrit and stenosis which strongly influences the flow regime. In the present work, we are going to use the model of (Pennes 1948) use by (Hen and Dil 2018), by coupling with hematocrit and stenosis to better control the variation of the temperature. Furthermore, we shall analyze the partitioning effect of hematocrit and the evolution of atherosclerosis on variation temperature variation. Here, we neglected the axial and angular direction and considered only the stationary state model of radial direction. The numerical (finite difference method) and analytical result obtained are presented graphically and compared to the result of (Zhang et al 2004) and (Hen and Dil 2018) by applying the appropriate values of the physical and physiological parameters. The solution obtained can be used for the measurement of thermal parameters, the reconstruction of the temperature field and thermal diagnosis and in the treatment which maximizes the therapeutic effect while minimizing undesirable side effects. It may also be useful to design medical devices to operate within a special range of heating and cooling temperature rates, such as (Zhang et al 2004), thus for the prediction of cerebrovascular diseases.
II) MATRIELS AND METHODS
II-1) MODELISATION OF TEMPERATURE
Over the past years, many researchers have developed different models with different views. The mathematical model used for the transfer of bio-heat is based on the Penne equation. (Pennes 1948) is preferable for studying the heat transfer between the blood and the tissues which also associates the metabolism effect and the blood perfusion. The modified Pennes equation is written as
where are the density (k/ ), the specific heat (J/kg. ) and the thermal conductivity of tissue, respectively. is the blood perfusion rate per unit volume (kg/s. ). is the specific blood, is the metabolic heat generation pert unit volume (w/ ), represents the temperature of arterial blood ( and T is the tissue temperature ( ). Based on the Pennes equation, the one-dimensional mathematical model was used to describe the heat transfer
from living cylindrical tissues, in the stationary state, is presented below (Kai and Xinxin; Hen and Dil 2018).
The model is axial symmetric, so the boundary conditions are described as (Kai and Xinxin ;Hen and Dil 2018):
Where R is the radius of the concerned tissue, is the coefficient of heat transfer which
accounts for the effects of both convection and radiation on the surface of the tissue, is the ambient temperature.
II-2) STENOSIS MODELING
Stenoses are characterized by a lesion of lipid infiltration, called an athermous plaque which develops on the internal surface of the arterial vessel (Figure II- 1) and which blocks blood circulation and hematocrit (Figure II-2).
Figure (II-2) :Circulation of hematocrit in different stage of stenoses (Tsafack et al 2019)
II-3) CHARACTERIZATION OF DIFFERENT VALUES OF REYNOLD
To characterize the Reynolds difference value at the different stages of stenosis, we concentrated our mine in the work of (Maurizio 2018), which during its simulation calculated the Reynolds number (Re). The Reynolds number is a dimensionless quantity which is useful for determining whether the flow is laminar or turbulent: if it is greater than a critical value, the flow is turbulent, if it is less, the flow is laminar. In general, the Reynolds number is defined by the flowing formulation
Where is the blood density, d is the diameter of the vessel, is the mean blood velocity throughout the vessel and it can be expressed as the ratio between the mean incoming flow (Q) and the inlet area (A):
is the blood viscosity that is express using a simplified formulation of the Einstein relationship and is given by the following formula
where represents plasma viscosity
For low value of shear rate, blood behave like pseudoplastic fluids and this behavior occurs for >12%.This is due to the presence of fibrinogen which determine the aggregation of the red blood cells into “rouleau”,generally mode up by fewer tens of erythrocytes, increasing
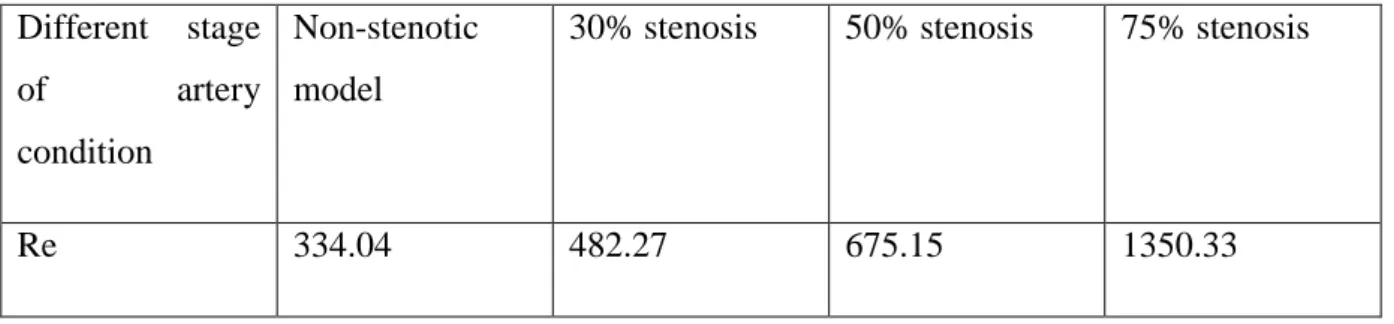
blood viscosity. Since these parameters were known, Reynolds number were calculated at rest condition both for the non-stenotic model and in correspondence of the 3 stenoses diameter, to see if these three degrees of stenosis may promote a laminar flow or cause a turbulent flow. The value obtained by (Maurizio 2018) are reported in the following table (1)
Table (1): Different stages of artery conditions with correspondent of Reynolds values determine by (Maurizio 2018) at rest condition
Different stage
of artery
condition
Non-stenotic model
30% stenosis 50% stenosis 75% stenosis
Re 334.04 482.27 675.15 1350.33
II-4) FINAL MODEL FORMULATION
In this section, we will couple the bio-heat model with the stenos model. Introducing equation 6 into equation 4, we will have
Using equation (7), we have the new blood density
Now let us introduce equation (8) into equation (2) to have a final expression of our model
II-5) RESOLUTION BASED ON FINITE DIFFERENCE METHOD
From equation (9), we have
Using the Finite Difference Method (FDM)
with h=
Now let us introduce equation (11) and (12) into equation (10), with have
where
II-6) DISCRETISATION OF BOUNDARY CONDITION from equation (3) for i=1,2…,R-1 and for i=R
with D=[(2+ ) - (1+ )] E= (1+ )
From equation (14), (15) and (16) we can find the following system of linear equations represented in matrix form:
AX=B (17) where
; and B= a= - (2+ ; =
) and ) where i is the number of line .
The matrix (17) gives the nodal values in FDM which make it possible to calculate the temperature distribution profile.
II-7) ANALYTICAL RESOLUTION
To solve analytically, we first carry out the dimensioning of equation (9) and its boundary condition by introducing the characteristic quantities (Ozisik et al 1983 and Wang et al 1992)
Then, replace equation (16) in equation (9):
Here the dimensionless parameters and variables will be defined as
Thus equations (9) and (3) can be rewritten in the form
Also, in order to normalize the equation, we assume
By thus substituting equation (21) in equation (19), we obtain:
It is clear that equation (22) is a modified zero order Bessel differential equation, the general solution of which can be expressed as follows:
Where and are respectively the modified Bessel function of the second type. In order to determine, if the analytical solution can be expressed by the Bessel function, equation (22) was compared to the generalized Bessel equation as follows:
The corresponding solution of equation (24) is:
Where and are respectively the modified Bessel functions of the first type, and are arbitrary constants which can be obtained as a function of the given boundary conditions. The result of the comparison between equation (22) and equation (24) is shown below:
, m=0, ,p=1,
Thus, the solution of equation (22) can be expressed as:
By replacing (26) with (21), the solution of (19) can be written as
The next step is to determine the values of two arbitrary constants .
According to the characteristics of the Bessel equation, when z = 0, we have
so we have :
Finally, the analytical solution of T is:
II-8) DETERMINATIONS OF PARAMETERS Table 2: Values of parameters
Symbol Value Unit Description Reference
0.00003 Kg/s. Blood perfusion
3850 J/Kg. Blood specific
heat
Hen and Dil 2018
K 0.48 W/m. Tissue thermal
conductivity
Hen and Dil 2018
30.023 W/m. Heat transfer
coefficient
Hen and Dil 2018
1085 W/ Heat generation
per unit volume
Hen and Dil 2018
37 Artery
temperature
Hen and Dil 2018
R 0.0285 m radius Hen and Dil 2018
45% - Hematocrite Hen and Dil
2018
0.0167 mean blood
velocity
0.165 plasma viscosity
III) RESULTS AND DISCUSSIONS
III-1) VALIDATION OF RESULTS
The results of the new model were validated by the reproduction of the results of the literature established for a simple pipe (without stenosis and Hematocrit). Figure (1) shows a decrease in temperature when the radial direction becomes important. This is due to the fact that when the body temperature is above the set value, the hypothalamus causes the phenomenon of sweating, evaporation, which causes a lowering of the skin temperature. At the same time, the skin arterioles dilate in order to promote heat exchanges with the outside.
Figure (1): Temperature as a function of the radial direction II-2) INFLUENCE OF STENOSIS ON TEMPERATURE
0 0.005 0.01 0.015 0.02 0.025 0.03 34 34.5 35 35.5 36 36.5 37 37.5 r [m] T[ c] Analytic solution Numerical solution
Figure (2) describes the evolution of the temperature with the increasing of the stenosis size. It shows that, as the obstacle increases, the temperature increases too. This increase in temperature is due to the friction of the fluid particles. This implies that, the stress becomes important at the cross of the stenosis section and it will therefore be important to control the temperature to avoid the evolution of stenosis. In the previous work of (Tsafack et al 2019) it was observed that, when the stenosis increased radially, the amplitude of the oscillations decreased as the inertial blood flow decreased rapidly due to blockage of the lumen. This suggests that the loss of singular inertial blood flow occurs when there is disturbance of the normal flow.
In the same vein (Gou et al 1999) shows for a high temperature, more than 38 , the patient is victim of cardiovascular and cerebrovascular disease. This is in agreement with our result, since figure (2) shows that, at a higher temperature of 38 the stenosis is already more than 50% of reduction in the initial wall.
Furthermore, in the experience of (kin et al 1996), he observed a rat with a body temperature above 40 , plunging into a brain violation in a few hours. this is in agreement with our result, since figure (2) shows that, when the temperature is higher than 40 , the degree of stenosis is higher than 75% of reduction of the arterial wall, therefore this is normal that, this rat is exposes to the brain offense.
Figure (2): Influence of stenosis on temperature
0 0.005 0.01 0.015 0.02 0.025 0.03 34 35 36 37 38 39 40 r [m] T [ c] Re=33.04; 0% of stenosis Re=482.27; 30% of stenosis Re=675.15; 50% of stenosis Re=1350.33; 75%of stenosis
III-3) TEMPERATURE DECREASE STUDY
III-3-1) INFLUENCE OF THE HEAT TRANSFER COEFFICIENT
Figure (3) shows that increasing the heat transfer coefficient decreases body temperature. This is because the temperature of the atmospheric pressure cools the body surface.
Figure (3): Influence of the heat transfer coefficient on temperature III-3-2) INFLUENCE OF THERMAL CONDUCTIVITY (K)
The result of figure (4) shows that the thermal conductivity has the effect of lowering the temperature. This decrease in temperature is because the atmospheric air touches the body at a lower temperature. According to Fourier law the temperature moves from the hottest medium to the least hot medium.
0 0.005 0.01 0.015 0.02 0.025 0.03 34 34.5 35 35.5 36 36.5 37 37.5 r [m] T [ c] hA=5 hA=15 hA=35 hA=55
Figure (4): Influence of thermal conductivity (K) on the temperature
III-4) STUDY OF AN INCREASE OF TEMPERATURE III-4-1) INFLUENCE OF HEMATOCRITIS (Ht)
The result of figure (5) shows that, the increase of hematocrit increases the body temperature; this is due to the fact that, the hematocrit increases the density of the blood, and that provokes an increase in resistance of the blood flow (Shung et al 1992 and Tsafack et al 2019).
Figure (5): Influence of hematocrits (ht) on the temperature
0 0.005 0.01 0.015 0.02 0.025 0.03 34 34.5 35 35.5 36 36.5 37 r [m] T [ c] k=0.14 k=0.17 k=0.19 k=0.21 0 0.005 0.01 0.015 0.02 0.025 0.03 34 34.5 35 35.5 36 36.5 37 r [m] T [ c] Ht=0.08 Ht=0.3 Ht=0.45 Ht=1
III-4-2) INFLUENCE OF THE GENERATION OF METABOLIC CHARGER (qm)
Figure (6) shows that, increasing (qm) increases the temperature. This is due to the fact that the metabolic generates heat, which causes the body temperature to rise.
Figure (6): Influence of the generation of metabolic charger (qm) on temperature II-4-3) INFLUENCE OF ARTERIAL TEMPERATURE
Figure (7) shows that increasing arterial temperature increases body temperature. Furthermore we observe that the arterial temperature is equal to the body temperature (Ta = 36.5; 37; 37.5; 38 is equal to body temperature T = 36.5; 37; 37.5; 38 respectively)
\
Figure (7): Influence of arterial temperature on the skin temperature
0 0.005 0.01 0.015 0.02 0.025 0.03 34.5 35 35.5 36 36.5 37 37.5 r [m] T [ c] qm=20 qm=1085 qm=1900 qm=2500 0 0.005 0.01 0.015 0.02 0.025 0.03 34 35 36 37 38 r [m] T [ c] Ta=36.5 Ta=37 Ta=37.5 Ta=38
CONCLUSION
In this article we have studied the distribution of the temperature of biological tissue, taking into account stenosis and hematocrit. The heat transfer model of penne in one-dimensional biological heat transfer in steady state has been solved by the numerical and analytical method, to obtain the temperature changes with variation in the size of the stenosis and hematocrit. The results of this contribution brought a new technic to use temperature to control the evolution of stenosis; this is to improve the prediction of cardiovascular and cerebral diseases. The results provided by this article promote the knowledge to control the evolution size of stenosis by taking just a temperature of the body. These provide a good knowledge of the thermal behavior of biological tissue, which is precious for the measurement of thermal parameters, the reconstruction of a temperature field and the diagnosis and treatment of cardiovascular and cerebral disease.
REFERENCES
Chen, M. M., Holmes, K. R. (1980). Micro-vascular contributions in tissue heat transfer. Annals of the New York Academy of Sciences, 335:137–150.
Cooper T. E. and Trezek G. J.(1972), A Probe Technique for Determining the Thermal Conductivity of Tissue, J. Heat transfer, ASME, 94, pp.133.
Grau AJ, Buggle F, Schnitzler P et al. Fever and infection early after ischemic stroke. J Neurol Sci 1999 ; 171 : 115-20.
Gurung D. B.(2007), Mathematical Study of Abnormal Thermoregulation in Human Dermal Parts, Ph. D. Thesis, Kathmandu University, Nepal.
Keller, K. H. and Seilder, L. (1971). An analysis of peripheral heat transfer in man. Journal of Applied Physiology, 30:779–789.
Khaled, A.-R. A. and Vafai, K. (2003). The role of porous media in modeling flow and heat transfer in biological tissues. International Journal of Heat Mass Transfer, 46:4989–5003.
Kim Y, Busto R, Dietrich WD et al. Delayed postischemic hyperthermia in awake rats
worsens the histopathological outcome of transient focal cerebral ischemia. Stroke 1996 ; 27 : 2274-81.
L. ACHABa, A. MAGNINb, J.R. CLERMONTb, S. BENHADIDa (2015) Etude numérique d’écoulements du sang dans des domaines axisymétriques en présence d’une sténose importante avec un modèle de fluide à seuil Congrès Français de Mécanique
Maurizio Lodi Rizzini (2018) Impact of Stenosis Length and Severity on Clinical Functional Parameters in an Atherosclerotic Coronary Model Master thesis in Biomedical Engineering
Mitchell, J. W. and Myers, G. E. (1968). An analytical model of the countercurrent heat exchange phenomena. Biophysics Journal, 8:897–911.
Nakayama, A., Kuwahara, F., and Liu, W. (2008). A macroscopic model for countercurrent bioheat transfer in a circulatory system. Journal of Porous Media, 12:289–300.
Ozisik, M N, Yu, C M. Heat Conduction. Beijing: Higher Education Press. 1983. 712—715
Pennes H. H.(1948), Analysis of Tissue and Arterial Blood Temperature in Resting Human Forearm, A Journal of Applied Physiology, 1(2), pp. 657−678.
Tsafack, takam, fogue, & talla. study of cerebral blood flow by the lumped parameter model to predict the rupture of the arterial wall: application to stroke. international journal of academic research and reflection vol. 7, no. 6, 2019
Wang, B X, Wang, Y M. Study on the Basic Equations of Biomedical Heat Transfer. Transport Phenomena Science and Technology. Beijing: Higher Education Press. 1992. 773--776
Weinbaum, S. and Jiji, L. M. (1985). A new simplified bioheat equation for the effect of blood flow on local average tissue temperature. ASME Journal of Biomechanical
Engineering, 107:131–139.
Wulff, W. (1974). The energy conservation equation for living tissue. IEEE Transactions on Biomedical Engineering, BME-21:494–495.
Zhang K. Y. X. and Yu F.(2004), An Analytic Solution of One-Dimensional Steady-State Pennes Bioheats Transfer Equation in Cylindrical Coordinates, Journal of thermal Science, 13(3), pp. 255−258.