HAL Id: hal-01219781
https://hal.archives-ouvertes.fr/hal-01219781
Submitted on 23 Oct 2015HAL is a multi-disciplinary open access archive for the deposit and dissemination of sci-entific research documents, whether they are pub-lished or not. The documents may come from teaching and research institutions in France or abroad, or from public or private research centers.
L’archive ouverte pluridisciplinaire HAL, est destinée au dépôt et à la diffusion de documents scientifiques de niveau recherche, publiés ou non, émanant des établissements d’enseignement et de recherche français ou étrangers, des laboratoires publics ou privés.
Detection of Alzheimer’s disease signature in MR
images seven years before conversion to dementia:
Toward an early individual prognosis.
Pierrick Coupé, Vladimir S Fonov, Charlotte Bernard, Azar Zandifar, Simon
F Eskildsen, Catherine Helmer, José V Manjón, Hélène Amieva, Jean-François
Dartigues, Michèle Allard, et al.
To cite this version:
Pierrick Coupé, Vladimir S Fonov, Charlotte Bernard, Azar Zandifar, Simon F Eskildsen, et al.. Detection of Alzheimer’s disease signature in MR images seven years before conversion to dementia: Toward an early individual prognosis.. Human Brain Mapping, Wiley, 2015, �10.1002/hbm.22926�. �hal-01219781�
Detection of Alzheimer’s Disease Signature in MR
Images Seven Years Before Conversion to Dementia:
Toward an Early Individual Prognosis
Pierrick Coupé 1, Vladimir S. Fonov 2, Charlotte Bernard 4,5,6, Azar Zandifar 2, Simon F. Eskildsen 3, Catherine Helmer 7,8,9, José V. Manjón 11, Hélène Amieva 7,8,9, Jean
françois Dartigues 7,8,10, Michèle Allard 4,5,6, Gwenaelle Catheline 4,5,6, D. Louis
Collins2 and the Alzheimer’s Disease Neuroimaging Initiative*
Corresponding author: pierrick.coupe@labri.fr
1 Laboratoire Bordelais de Recherche en Informatique, Unité Mixte de Recherche CNRS (UMR 5800),
PICTURA Research Group, Bordeaux, France
2 McConnell Brain Imaging Centre, Montreal Neurological Institute, McGill University, Montreal, Canada
3801 University Street, Montreal, Canada H3A 2B4
3 Center of Functionally Integrative Neuroscience and MINDLab, Aarhus University, Aarhus, Denmark 4 Univ. Bordeaux, INCIA, UMR 5287, F-33400 Talence, France.
5 CNRS, INCIA, UMR 5287, F-33400 Talence, France. 6 EPHE, Bordeaux, France
7INSERM, ISPED, Centre INSERM U897-Epidemiologie-Biostatistique, Bordeaux, France 8University of Bordeaux, Bordeaux, France
9INSERM, CIC 14.01, module EC, Bordeaux, France
10University Hospital, Memory Consultation, CMRR, Bordeaux, France
11Instituto de Aplicaciones de las Tecnologías de la Información y de las Comunicaciones Avanzadas
(ITACA), Universitat Politècnica de València, Camino de Vera s/n, 46022 Valencia, Spain
* Data used in the preparation of this article were obtained from the Alzheimer’s Disease Neuroimaging Initiative (ADNI) database (www.loni.ucla.edu/ADNI). Hence, the investigators within the ADNI contributed to the design and implementation of ADNI and/or provided data, but did not participate in analysis or writing of this report. ADNI investigators include (complete listing available at http://www.loni.usc.edu/ADNI/Data/ADNI_Authorship_List.pdf).
Abstract:
Finding very early biomarkers of Alzheimer’s Disease (AD) to aid in individual prognosis is of major interest to accelerate the development of new therapies. Among the potential biomarkers, neurodegeneration measurements from MRI are considered as good candidates but have so far not been effective at the early stages of the pathology. Our objective is to investigate the efficiency of a new MR-based hippocampal grading score to detect incident dementia in cognitively intact patients. This new score is based on a pattern recognition strategy, providing a grading measure that reflects the similarity of the anatomical patterns of the subject under study with dataset composed of healthy subjects and patients with AD. Hippocampal grading was evaluated on subjects from the Three-City cohort, with a follow-up period of 12 years. Experiments demonstrate that hippocampal grading yields prediction accuracy up to 72.5% (p<0.0001) 7 years before conversion to AD, better than both hippocampal volume (58.1%, p=0.04) and MMSE score (56.9%, p=0.08). The area under the ROC curve (AUC) supports the efficiency of imaging biomarkers with a gain of 8.4 percentage points for hippocampal grade (73.0%) over hippocampal volume (64.6%). Adaptation of the proposed framework to clinical score estimation is also presented. Compared to previous studies investigating new biomarkers for AD prediction over much shorter periods, the very long follow-up of the Three-City cohort demonstrates the important clinical potential of the proposed imaging biomarker. The high accuracy obtained with this new imaging biomarker paves the way for computer-based prognostic aides to help the clinician identify cognitively intact subjects that are at high risk to develop AD.
Introduction
Alzheimer’s Disease (AD) is the most common form of dementia affecting the elderly and the prevalence of AD increases with age. It is the fourth leading cause of death among adults in high-income countries. Although numerous drug-modifying clinical trials for AD have been conducted, none have been effective (1). Two hypotheses could explain this lack of efficiency: a) therapy has been implemented too late, after irreversible brain damage has occurred, stressing the need to identify the disease earlier (2, 3) before neurodegeneration is too severe; b) the therapeutic strategy is not appropriate, requiring a better understanding of disease pathological mechanism(s). Either way or both at the same time, finding very early biomarkers of prodromal AD, characteristic of the presymptomatic phase (before memory loss and cognitive decline) of the disease, is therefore a major issue for current international research on AD.
With this aim, highly sensitive biomarkers are needed. While structural imaging markers are considered sensitive enough to detect very early stage of disease (4-6), the current model assumes that their modification occurs after the apparition of the first symptoms (7, 8) and MRI-based studies were based on datasets with a relatively short follow-up period before diagnosis (around 3-5 years). However, it is now well admitted that pathological changes to the brain occur decades before the first symptoms appear in AD. Thus efforts to identify subjects in the prodromal phase of AD have recently shifted to the presymptomatic phase of the disease.
In this context, it is highly desirable to study population-based cohorts that include healthy elderly with longer term follow-up. In addition, population-based cohorts give us the opportunity to avoid the potentially biased selection associated with recruitment in memory clinics and enable the study of imaging and neuropsychological parameters at the presymptomatic stage (silent phase) of the
disease. Herein, in the present study, we propose to evaluate MRI-based imaging biomarkers on a dataset from a population-based cohorts of healthy elderly subjects with long follow-up (12 years) enable the study of imaging and neuropsychological parameters over the course of the presymptomatic phase of AD. During the 12 years follow-up period some subjects will convert to AD do so 7 years (on average) after enrollment into the study. This long follow-up enables to track evidence of neurodegeneration at least 7 years before clinical diagnosis using MRI.
Another limitation of previous studies evaluating neurodegeneration biomarkers is the method of estimating the MRI neurodegeneration signature. Among the biomarkers proposed in the literature, hippocampal atrophy is considered a sensitive and powerful marker of AD progression (4). Recent comparisons of MRI-based measurements of neurodegeneration (hippocampus volume loss, cortical thickness reduction or global brain atrophy) revealed that hippocampus volume is currently among the best candidates for predicting AD (6, 9). However, the prediction accuracy obtained using hippocampus volume is relatively low, around 65% in subjects 18 months before conversion to AD (9). Therefore, performing automatic individual prognosis using hippocampus volume as a neurodegeneration surrogate appears limited.
Recently, we developed advanced image analysis methods that have been proposed to better detect the AD signature in MRI (10, 11). Based on a pathological pattern recognition strategy, such approaches are able to provide a grading measure that reflects the similarity of the anatomical patterns of the subject under study with datasets composed of healthy and pathological subjects. In this manner, it is possible to accurately reveal the presence of neurodegeneration, even when it is subtle. These methods take advantage of using a large training library composed of cognitively normal (CN) controls and AD patients to learn from example. Using the ADNI dataset (12), we have showed that hippocampal grading significantly enables
better automatic prediction of AD compared to hippocampal volume (11). This advanced image analysis method is based on an MRI-based pattern recognition strategy that is able to provide a grading measure that reflects the similarity of the anatomical patterns of the subject under study with datasets composed of healthy subjects and patients with AD.
The present study aims to assess the predictive value of hippocampal grade on incident dementia in cognitively intact patients. Our two hypotheses are: 1) subtle neurodegeneration can be detected very early in the course of AD by using hippocampal grade in a population-based study with long follow-up (12 years); and 2) accurate scoring of subjects from Bordeaux site of the Three-City project could be achieved by using the AD and cognitively normal (CN) populations from another cohort, ADNI dataset, as a training library.
Material and Methods
Table 1: Demographic details of the AD patients and CN subjects of the ADNI database used as training dataset and of the stable CN and converter CN of the Bdx-3C dataset used as testing images.
Population size
% Male Age (SD) MMSE (SD)
CN (ADNI) 225 52% 76.0 (5.0) 29.1 (0.9) AD (ADNI) 192 52% 75.6 (7.7) 22.8 (2.9) Stable CN (Bdx-3C) 309 41% 72.7 (3.9) 28.4 (1.2) Converter CN (Bdx-3C) 37 30% 75.4 (3.9) 27.9 (1.4)
Training dataset: ADNI
The Alzheimer's Disease Neuroimaging Initiative (ADNI) dataset (http://adni.loni.usc.edu/) contains T1w MRI scans for AD and CN subjects at several time points (12). In the proposed study, we used all baseline scans of ADNI1 at 1.5T of 225 CN subjects and 192 AD patients as training data to estimate hippocampal grading of the testing dataset. The clinical AD diagnosis was made according to the
NINCDS-ADRDA Alzheimer's Criteria (13). We did not find any statistically significant differences for age (p=0.52) or gender (p=0.61) between the AD and CN groups using a general linear model (GLM). Demographic details for the training dataset are provided in Table 1. The ADNI MRI scans were acquired on 1.5T GE, Philips, and Siemens scanners using a 3D MPRAGE T1-w sequence as recommended by the MRI Core of the ADNI consortium (12). The ADNI acquisition protocol is based on sagittal 3D MP-RAGE sequence (TR=2400ms, minimum full TE, (TI=1000ms, flip angle 8°, FOV 240 mm, voxel size of 1.25x1.25x1.2 mm3). Images were then reconstructed at a voxel size of approximately 1x1x1.2 mm3.
Test dataset: Bdx-3C
In this study, we used subjects from the Bordeaux site of the Three-City (Bdx-3C) dataset, a prospective population-based cohort designed to assess the risk of dementia and cognitive decline due to vascular risk factors (14). In this longitudinal dataset, neuropsychological tests were performed by trained psychologists at baseline and at 2, 4, 7, 10 and 12 years. MRI scans were acquired at baseline and at 4 and 9 years. The neuropsychological evaluation consisted of several tests performed at each follow-up, always including the Mini Mental State Evaluation (MMSE) (15) to evaluate global cognitive function. During follow-up, subjects suspected of dementia were seen at home by a neurologist or a geriatrician who confirmed the diagnosis and specified the etiology of dementia. After this assessment, definitive diagnosis was made by a panel of independent neurologists to obtain a consensus on the diagnosis and the etiology according to the DSM-IV criteria for dementia and the NINCDS-ADRDA criteria for AD (13).
In the Bdx-3C study, 663 subjects have a baseline MRI scan. By using baseline scans of all the CN subjects who remain free of dementia during 12 years, we built a stable CN (sCN) group while subjects who converted to AD during the last 3
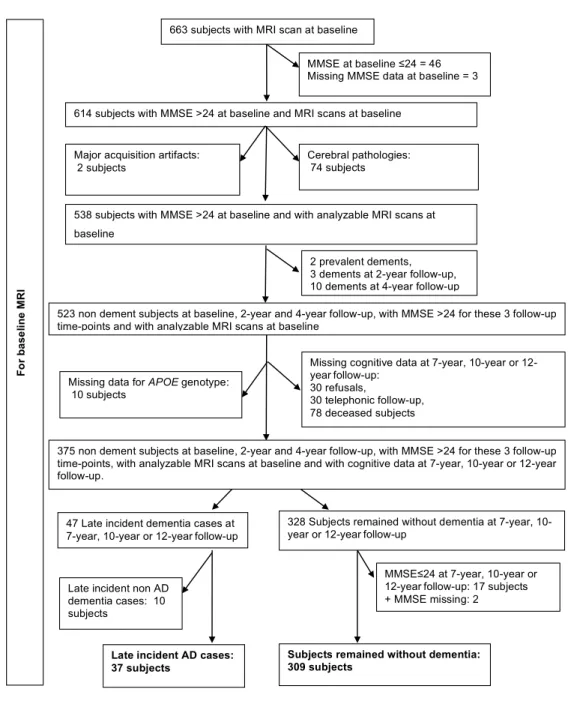
follow-ups were used to build the converter CN (cCN) group. The group construction is similar to the procedure described in a previous study (16). First, subjects with missing MMSE (n= 3) and MMSE ≤ 24 (n=46) at baseline were excluded and subjects with unusable MRI scans were removed (74 for brain pathologies and 2 for major acquisition artifacts). In addition, subjects with prevalent dementia (n=2) and early incident dementia (n=13) at 2-year and 4-year follow-up were excluded. Then, subjects with missing data for 7-year, 10-year and 12-year follow-up (n=148) were excluded. Among these 375 remaining subjects, 47 presented late incident dementia at 7-year, 10-year or 12-year neuropsychological follow-up and 328 remained free of dementia until the 12-year follow-up. Finally, only subjects fulfilling the criteria for AD dementia type (n= 37) were used in cCN group and only subjects free of dementia with a MMSE >24 (n= 309) at 7-year, 10-year and 12-year follow-up were kept to construct the sCN (see Figure 1). We do not use CN subjects who converted at 2-year and 4-2-year follow-up in order to build a homogeneous group composed of subjects far from conversion. Therefore, Bdx-3C dataset was divided into two groups of 309 sCN and 37 cCN. Demographic details of both Bdx-3C groups are provided in Table 1. We found statistical difference between sCN and cCN groups for age (p=0.0001) but not for gender (p=0.17). At baseline, no statistical difference was observed between groups for a global cognitive scale (i.e., MMSE) using generalized linear model. This indicates that cCN subjects are in a silent phase.
We estimated the mean time before AD diagnosis for the cCN group at 103.05 months (SD: 24.26) using the baseline MRI and the follow-up exams where AD diagnosis was established. However, low frequency of follow-up exams might introduce a bias by overestimating this duration. Therefore, we also computed an estimated average time before conversion to compensate for this bias. To estimate the time before conversion, we used the average time between the closest follow-up exam before AD diagnosis and the follow-up exam when AD diagnosis was established. For instance, when a patient was seen and clinically classified
non-demented after the 4-year follow-up and seen again at the 7-year follow-up and classified as demented, we considered that the clinical conversion to dementia occurred between the 4-year follow-up and the 7-year follow-up. From a statistical point of view, we estimated that the time of the conversion to AD occurred at the middle of the interval. Using this procedure, the mean time before the estimated conversion to AD was 84.47 months (SD: 25.26). The MRI scans were obtained on a 1.5 Tesla Gyroscan Intera system (Philips Medical Systems, Netherlands). MRI volumes were acquired using 3D MP-RAGE T1-weighted sequence (TR/TE 8.5/3.9 ms, flip angle 10°, matrix size 256x256, FOV 240 mm, yielding 124 slices with a slice thickness of 1 mm, voxel size 0.94x0.94x1 mm3).
Image Preprocessing
All the images (ADNI and Bdx-3C) were preprocessed through the same fully automatic pipeline (17). The preprocessing included the following steps: estimation of the standard deviation of noise (18); denoising based on an optimized nonlocal means filter (19); correction of inhomogeneities using N3 (20); registration to stereotaxic space (stx) based on a linear transform to the ICBM152 template (1x1x1 mm³ voxel size) (21) using a population-specific template derived from the ADNI database (22); linear intensity normalization of each subject on template intensity; brain extraction using BEaST (23); image cropping around the structures of interest and cross-normalization of the MRI intensity between the subjects within the estimated brain mask (24) (see Figure 2). Finally, the hippocampal volume was estimated with (25).
Hippocampal grading
Inspired by our work based on a nonlocal patch-based framework for MRI denoising (19) and for MRI segmentation (25), we recently proposed a new method to estimate
structure grading called SNIPE (10, 11). The grading or scoring of the structure under consideration is achieved by estimating the nonlocal similarity of the subject under study to different training populations. With the nonlocal framework, SNIPE is able to handle inter-subject variability by enabling a one-to-many mapping between the subject’s anatomy and those of the training templates. Moreover, by employing the patch-based comparison principle, SNIPE can detect subtle anatomical changes caused by the disease. In short, the technique uses a library of manually labeled MRI datasets from healthy aging subjects and patients with AD. For each voxel in a new subject to be analyzed, the method defines a 7x7x7 voxel patch centered on the voxel in question (see Figure 2). The procedure then searches the template library for similar patches. Template structure labels are weighted by the patch similarity, and the structure label with the maximum weight is then associated with the voxel. At the same time, the template group (+1.0 for normal controls and -1.0 for AD subjects) is also weighted by the patch similarity. The resulting average weight is used as a grading value to indicate how similar this voxel is to the CN group or the AD group (see (10) for details). In this paper, we also propose to adapt this grading framework to image-based estimation of clinical scores as explained in the following.
After the preprocessing pipeline, we estimated hippocampal grading on the Bdx-3C dataset using the following steps: selection of the training subjects, structure grading and feature extraction.
a) Training subjects selection: AD and CN populations of ADNI were used as training library to achieve hippocampal grading of the cCN and sCN groups of the Bdx-3C dataset. During our experiment, the selection of the 50 closest subjects from each training population (i.e., AD and CN) was achieved using the sum of the squared difference (SSD) over an initialization mask. In a previous study (10), we showed that 50 subjects provides a good tradeoff between accuracy and computational burden.
b) Structure grading for the subject under study: For each voxel of the subject under study in the hippocampal area, we compared the surrounding patch (a cube of 7x7x7 voxels) with all the patches from the N=100 training templates selected from the ADNI AD and CN populations in the hippocampal area. For each patch comparison, the SSD between the patch under study and the considered training patch was used to assign a weight to the training patch. More precisely, the patch P(xi) surrounding
the voxel xi under study is compared with all the patches P(xs,j) of the training
template s within a search area Ω of size 9x9x9 voxels. The patch similarity between
P(xi) and P(xs,j) was estimated by the sum of squared differences (SSD) measure.
Finally, each patch received a weight w(xi, xs,j):
𝑤 𝑥!, 𝑥!,! = 𝑒
! ! !!!! !!,! !
!
!(!!)!
(1)
where ||.||2 is the L2-norm computed between each intensity of the elements of the patches P(xi) and P(xs,j), and h(xi)2 is the smoothing parameter of the weighting function. This weighting function is designed to give a weight close to 1 when the SSD is close to zero and a weight close to zero with the SSD is high. The smoothing parameter was automatically and locally adjusted as follows:
ℎ(𝑥!)!= min!
!,! 𝑃 𝑥! − 𝑃 𝑥!,! !
!
+ 𝜖 (2)
where ε is a small constant used to avoid numerical instability. These estimated weights were then used to perform structure grading using the group membership status of training subjects (i.e., CN or AD). As described in (10), we used a non-local estimator to estimate grading values at each voxel:
𝑔 𝑥! = !∈!𝑤 𝑥!, 𝑥!,! . 𝑝! ! !!! 𝑤 𝑥!, 𝑥!,! !∈! ! !!! (3)
where ps is the clinical status of the considered ADNI training template s. In our case, ps=-1 was used for AD status while ps=1 was used for normal control. Therefore, a negative grading value g(xi) indicates that the neighborhood surrounding
xi is more characteristic of AD than CN (respectively, of CN than AD) (see Fig. 2). Respectively, a positive grading value indicates that the neighborhood surrounding xi is more characteristic of CN than AD. In this paper, an adaptation to clinical score estimation of this grading framework is also proposed. To do that, clinical status ps in
Eq. (3) is replaced by clinical scores of ADNI training subjects. In our experiments, we used ADNI MMSE scores to perform patch-based MMSE estimation of Bdx-3C subjects.
c) Feature extraction: At the end of the previous step, hippocampal grading maps (or patch-based MMSE maps) were obtained for all the Bdx-3C subjects (see Figure 2 and 3). To estimate the final patch-based features, the hippocampus segmentation masks are used to compute the average grading values over left and right hippocampus. Finally, left and right grading values are fused using the mean.
Age Correction
To control for age effect between groups, we followed the procedure dedicated to dementia studies proposed in (26-28). In such approach, only the control group is used to estimate the age-related effect through linear regression. Here, linear regression models have been estimated first using the sCN group only. Then, these models were used for correcting age-related effect impacting the considered biomarkers (i.e., volumes, grades, MMSE scores and patch-based MMSE estimation) for cCN and sCN groups.
Validation framework
In order to study the AD prognostic accuracy of the imaging biomarkers and the considered global cognitive test evaluated at baseline (i.e. MMSE), we performed classification experiments on sCN vs. cCN subject of the Bdx-3C dataset. In the proposed experiments, we used a Leave-One-Out Cross Validation (LOOCV) procedure and the classification step was based on linear discriminant analysis (LDA) as done in (9, 10). In this type of cross-validation, the classifier is trained on n−1 samples and then the trained classifier is used to classify the remaining sample. The biomarker values were corrected for age difference. All the classification results were analyzed in terms of Correct Classification Rate (CCR), specificity (SPE) and sensitivity (SEN). Moreover, a McNemar’s test was performed to verify that the classifier tested was significantly different from a random classifier to show results are better than chance. Finally, the classifier performance was studied also by estimating the Area Under the receiver operating characteristic Curve (AUC) using posterior probabilities of the LDA obtained within the LOOCV procedure. A bootstrap approach was used to estimate the 95% confidence interval of AUC.
Results
Detection of Alzheimer’s Disease Signature
As previously mentioned, hippocampal atrophy can be better characterized using pathological pattern recognition than using pure volume. The main idea of hippocampal grading is to use a training MRI library to efficiently track the presence of AD signature. For a given anatomical pattern (e.g., a cube of 7x7x7 mm) located in the hippocampal area of the subject under study, a search for similar patterns is done within a large number (around 50,000 in our experiment) of anatomical patterns available in the training MR images composed of two groups - a healthy and a pathological group (i.e., CN and AD) (see Figure 2 and Table 1). Here, the studied subject is extracted from Bdx-3C and the training library is composed of ADNI MRI
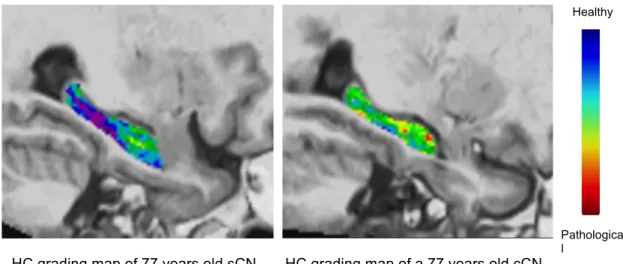
(12). The degree of similarity and the number of similar patterns found in each group is used to decide if the current anatomical pattern is more CN-like or AD-like. A strong similarity with AD pathological patterns indicates the presence of an AD MRI signature and thus reveals that the neurodegeneration process related to AD has started. This procedure is repeated for each voxel included in the hippocampus that implies approximately 350,000,000 pattern comparisons are used to establish the final grading map in the proposed framework. Finally, the average grading value over the hippocampus is used as hippocampal grading measure and can be viewed as a consensus decision. Each grading value obtained for each voxel can be viewed as a “weak” classifier of the status of the current subject. The advantage of using an ensemble of classifiers composed of many “weak” classifiers has been demonstrated in machine learning (29). Figure 3 shows typical examples of hippocampal grading maps at the same position in stereotaxic space for age-matched sCN and cCN subjects (this baseline MR image for a converter subject is 7.5 years before conversion to AD). The hippocampal grading map of the sCN subject (mainly blue-purple color) indicates that the majority of the anatomical patterns of the subject are highly similar to anatomical patterns found in the ADNI CN training subjects. For the cCN subject, a number of red focal regions appear, indicating that these hippocampal regions exhibit high structural similarity with the pathological pattern of ADNI AD training subjects. This demonstrates that in these areas, AD-like anatomical patterns were found in this cCN subject and thus that neurodegeneration was detected 7.5 years before conversion to AD. Finally, green regions indicate anatomical patterns equally similar to the anatomy of AD and CN ADNI training subjects. While the human visual system cannot detect the subtle anatomical difference between both subjects, the involved pathological pattern recognition method based on a simultaneous comparison of a huge number of anatomical patterns succeeds in detecting very early signs of AD.
Biomarkers comparison
After image processing, hippocampus segmentation and hippocampus grading maps were obtained for all the Bdx-3C subjects. The segmentations were used to estimate the left and right HC structure volumes, and the average grading value was estimated over the hippocampus segmentations. Finally, the used features were the hippocampal volume (i.e., sum of left and right hippocampus volumes) and the hippocampal grading (i.e., mean grading value estimated over left and right hippocampus). For a given voxel, the grading scale goes from 1 when only CN-like patterns are found to -1 when only AD-like patterns are found. Figure 4 shows the distributions of the compared imaging biomarkers and the cognitive test. All the values were adjusted for age differences between groups. The hippocampal volume of the non-converter group was significantly larger than the hippocampal volume of the converter group (p=0.004) and the hippocampal grade values of the non-converter group were significantly higher than the non-converter group (p<0.0001). As previously mentioned MMSE scores were not significantly different between groups (p=0.16). Finally, as for hippocampal grading, patch-based MMSE estimation was significantly different between groups (p<0.0001).
Automatic Early Prognostic
In order to study the AD prognostic detection accuracy at presymptomatic stage (i.e. 7 years before conversion to AD) of the compared biomarkers and cognitive test, we performed automatic classification experiments on sCN versus cCN. In the proposed experiments, we used a Leave-One-Out Cross Validation (LOOCV) procedure. Table 2 shows the classification performance for hippocampal grade, hippocampal volume, patch-based MMSE estimation and MMSE scores.
Table 2: Classification results based on linear discriminant analysis classifier with values adjusted for age difference. A leave-one-out cross-validation procedure was used. Results are reported for CCR=Correct Classification Rate, SEN=Sensitivity, SPE=Specificity, p-value of the McNemar’s test, AUC=Area under the ROC curve and CI=95% Confidence Interval. * Classification performance estimated as significantly better than random classifier using the McNemar’s test. The best results are in bold font.
Automatic Prognosis cCN (37) versus sCN (309)
84.47 months (SD: 25.26) before conversion to AD 103.05 months (SD: 24.26) before AD diagnosis
CCR % SEN % SPE % McNemar’s test
AUC [95% CI]
MMSE scores 56.9 46.0 58.3 0.08 52.0 [40.4-61.6]
Hippocampal volume 58.1 54.0 58.6 0.04* 64.6 [54.4-72.3]
Patch-based MMSE estimation 68.8 59.5 69.9 p<0.0001* 73.2 [63.8-81.5]
Hippocampal grade 72.5 64.9 73.5 p<0.0001* 73.0 [63.6-81.3]
Hippocampal grade obtained the highest classification accuracy (72.5%), followed by patch-based MMSE estimation (68.8%), hippocampal volume (58.1%) and the MMSE (56.9%). Therefore, hippocampal grade provided a gain of 14.4 percentage point (pp) in term of prognosis accuracy. In addition, hippocampal grade obtained the best sensitivity and specificity with a gain of 10.9pp for sensitivity and of 14.9pp for specificity. According to the McNemar’s test, only classification based on imaging biomarkers performed significantly (p≤0.05) better than a random classifier. The hippocampal volume was marginally significant (p=0.04) while hippocampal grade and patch-based MMSE estimation were highly significant (p<0.0001). Finally, the area under the ROC curve (AUC) shows the advantage of both proposed patch-based biomarkers (see Figure 5).
Patch-based clinical score estimation
Recently, several studies investigated age prediction (30) and clinical score prediction (31, 32) using MRI content. The interest of such image-based approaches is growing for early pathology detection and longitudinal follow-up. As previously explained, the proposed framework can be adapted to other problems than clinical status estimation. In fact, MMSE score can be predicted using image content through our patch-based grading framework. Instead of using clinical status of ADNI training subjects as input to estimate clinical status of 3C subjects, MMSE scores of ADNI training subjects can be used to perform a patch-based MMSE estimation. As explained in (30), such prediction methods require a calibration step to compensate for dataset differences. Here, we used a classical standardization procedure based on z-scores. The patch-based MMSE estimation obtained with ADNI MMSE scores are rescaled to MMSE scores of Bdx-3C subjects using mean and standard deviation of sCN population. As shown on Figure 4, image-based estimation of MMSE scores using our hippocampal grading framework enables to distinguish populations (p<0.0001) while MMSE score obtained by cognitive tests cannot (p=0.08). Table 2 shows prognostic accuracy obtained for MMSE and patch-based MMSE estimation. The image-based MMSE scores clearly improve prognosis accuracy compared to clinical MMSE scores with a gain of 11.9 pp in terms of CCR and 21.2 pp in terms of AUC (see Figure 5). The AUC is similar to values obtained with hippocampal grading while CCR is slightly lower.
Discussion
In this study, we showed that using hippocampal grading for early prognosis exhibited higher classification accuracy than hippocampal volume with a gain of 14.4pp. This result on the Bdx-3C population is in line with our previous results obtained on the ADNI dataset with subjects who converted to AD in 18.24 months on average (11), where we obtained 71% correct classification using hippocampal grade (p<0.0001) and 62% correct classification using hippocampal volume (p=0.0007).
Recently, we showed that combination of hippocampal grading with cortical thickness could improve classification accuracy (33). We also showed that performing gray matter grading over the entire brain could even improve this rate to 75.6% at the expense of a more complex framework requiring automatic ROI selection (34). A very recent independent study on the ADNI dataset confirmed these previous results and showed that hippocampal grading provides higher AD prognosis accuracy than current state-of-the-art MRI-based methods (35). Here, our results support the hypothesis that, although hippocampal volume has been found to be an efficient imaging biomarker on subjects close to AD diagnosis (9, 36), hippocampal volume loss is not sufficiently sensitive to enable automatic classification at a very early preclinical stage of the disease. The use of more sophisticated measures of the neurodegenerative process impacting hippocampal structure, such as the pathological pattern recognition method used here, appears to be crucial for the identification of an early presymptomatic phase of AD 7 years before conversion to AD. Even with the relatively crude feature of averaging over the entire hippocampus we obtain decent predictions. As Figure 3 indicates, some regions of the hippocampus seem more sensitive to the pathology. Therefore, more advanced grading-based features estimation (e.g., using hippocampal sub-fields segmentation) hold promises of even higher prediction accuracies. Finally, advanced approaches based on machine learning (35, 37-39) have recently demonstrated high performances. The combination of patch-based and learning-based strategies (e.g., deep learning) appears to be a good candidate to further improve early AD detection.
From a pathophysiological point of view, the performance of the hippocampal grade supports the hypothesis of hippocampal anatomical alterations 7 years before conversion to AD since pathological patterns were detected in the baseline MRI data of 7 out of 10 Bdx-3C subjects that converted to AD. Taken together these results are consistent with the idea that clinical AD is preceded by a long asymptomatic phase, which is characterized by progressive functional, metabolic and anatomical brain
alterations. Indeed, we assume that hippocampal grading alteration probably reflects a more subtle neurodegeneration process than global hippocampal atrophy measured with hippocampal volume; leading to earlier prediction capabilities for hippocampal grade than hippocampal volume during the neurodegenerative presymptomatic process. Subtle modifications of the microstructural integrity of the hippocampus are known to occur before volume changes can be detected (40-42). These modifications may influence MR signal properties in the tissue. Such subtle changes are likely to be picked up by the grading principle, thus increasing the sensitivity of hippocampal grading compared to conventional MRI based anatomical biomarkers.
In our study, imaging biomarkers exhibited higher classification accuracy than global cognitive status, reflected by MMSE scores. In accordance, hippocampal volume has been shown to be a more efficient predictor of AD conversion than a large number of cognitive tests in the ADNI dataset for subjects close to AD diagnosis (36). However, when using subjects with longer follow-up (43) or amnesic subjects (44), cognitive tests seem to provide better predictive accuracy. Here, on the Bdx-3C dataset, hippocampal biomarkers were better than MMSE 7 years before conversion to AD. In this paper, we also adapted our hippocampal grading framework to clinical score estimation. We showed that image-based MMSE prediction could provide better prognostic accuracy than clinical MMSE scores. It is interesting to note that using a binary variable (i.e., clinical status) or discrete score (i.e., MMSE) as training inputs yielded similar AUCs but slightly lower accuracy when using MMSE. These similar results were expected since clinical status is partially based on MMSE scores and thus are highly correlated. However, MMSE score provides a finer definition of pathology degree and thus should in theory have produced higher accuracy. The expected advantage of using this richer value than a simple binary status might be reduced by noise in MMSE measurements obtained by cognitive testing and by the
fact that the diagnosis is based on more than just MMSE. Further works should investigate longitudinal aspect of clinical score prediction as done in (31).
In the present work, we used an external dataset as training library (i.e. the ADNI dataset) to estimate hippocampal grade on the Bdx-3C dataset. The superior results obtained using hippocampal grade demonstrate the robustness of the proposed preprocessing pipeline to multi-site and multi-sequence datasets. Moreover, the possibility of using a large freely available dataset to train our pathological pattern recognition method highlights the clinical potential of such an approach. Finally, our study gives support to the hypothesis that North American and European populations share similar atrophic patterns caused by AD as discussed in (45).
To the best of our knowledge, this is the first study presenting an automatic MRI-based prognosis method that enables AD prediction 7 years before conversion to AD. First, we proposed a new computer-aided prognosis method based on latest advances in image processing. Then, we demonstrated the highest prognosis accuracy provided by hippocampal grading compared to hippocampal volume. At present, hippocampal volume is considered as state-of-the-art MRI-based biomarker for diagnostic criteria and clinical trial (46). To ensure that subjects were in presymptomatic phase, we used a dataset with a follow-up period of 12 years. Compared to previous studies investigating new biomarkers for AD prediction on shorter periods (47, 48), the very long follow-up used here enables to really evaluate the clinical potential of the proposed imaging biomarkers. The high accuracy obtained with the proposed hippocampal imaging-biomarker paves the way to the automatic identification of elderly subjects with high risk to develop AD.
Figure 1: Flowchart of the construction of both groups: converter (cCN) and stable (sCN). This figure details the number and the criteria of selection.
!
MMSE≤24 at 7-year, 10-year or
12-yearfollow-up: 17 subjects
+ MMSE missing: 2 MMSE at baseline ≤24 = 46 Missing MMSE data at baseline = 3
Major acquisition artifacts: 2 subjects
Cerebral pathologies: 74 subjects
538 subjects with MMSE >24 at baseline and with analyzable MRI scans at baseline
47 Late incident dementia cases at
7-year, 10-year or 12-yearfollow-up
Subjects remained without dementia: 309 subjects
Late incident AD cases: 37 subjects
328 Subjects remained without dementia at 7-year,
10-year or 12-10-yearfollow-up
Late incident non AD dementia cases: 10 subjects
663 subjects with MRI scan at baseline
Fo r ba s e li ne M R I
614 subjects with MMSE >24 at baseline and MRI scans at baseline
523 non dement subjects at baseline, 2-year and 4-year follow-up, with MMSE >24 for these 3 follow-up time-points and with analyzable MRI scans at baseline
Missing cognitive data at 7-year, 10-year or
12-yearfollow-up:
30 refusals,
30 telephonic follow-up, 78 deceased subjects
375 non dement subjects at baseline, 2-year and 4-year follow-up, with MMSE >24 for these 3 follow-up time-points, with analyzable MRI scans at baseline and with cognitive data at 7-year, 10-year or 12-year follow-up.
2 prevalent dements, 3 dements at 2-year follow-up, 10 dements at 4-year follow-up
Missing data for APOE genotype: 10 subjects
Figure 2: General principle of hippocampal grading by pathological pattern recognition. The figure presents the anatomical pattern recognition strategy for one voxel of subject under study by displaying only few similar anatomical patterns found in training MRI. This procedure is repeated for all the voxels of the subject under study over the hippocampus to obtain the final grading map. In this example the Bdx-3C subject under study is a cCN subject. Purple arrows symbolize the similarity between anatomical patterns. Dark purple indicates high anatomical patterns similarity and light purple indicates low similarity. For the anatomical pattern under study in this example derived from a cCN subject, more similar anatomical patterns are found in AD population and their weights (similarities) are higher. In the grading map, when the voxel color is blue, this indicates that the anatomical pattern surrounding this voxel is more similar to anatomical patterns found in the CN training subjects and thus that the local anatomy is closer to anatomies of healthy subjects (i.e. CN-like anatomical pattern). When the voxel color is green, this indicates that the anatomical pattern is equally similar to anatomical pattern found in the CN and the AD training subjects. Finally, when the voxel color is red, this indicates that the local anatomy contains alterations typical of the AD population (i.e. AD-like anatomical pattern) and thus the presence of neurodegeneration.
…
…
Healthy
Pathological
Training MRI of cognitively normal subjects from ADNI dataset
Training MRI of patients with Alzheimer's Disease from ADNI dataset
Subject under study from Bdx-3C dataset
Healthy
Pathologica l
HC grading map of 77 years old sCN subject
HC grading map of a 77 years old cCN subject. 7.5 years before conversion to
AD
Figure 3: Examples of hippocampal grading maps obtained on the Bdx-3C dataset for a sCN subject and a cCN subject 7.5 years before conversion to AD. The blue-purple hippocampal grading map of the sCN subject indicates that a majority of CN-like anatomical patterns in this subject has been detected. The green areas in the hippocampal grading map of the cCN subject indicate the hippocampal structural patterns of this subject are equally similar to the anatomy of AD and CN ADNI training subjects. Finally, red regions indicate that AD-like anatomical patterns have been found in this cCN subject 7.5 years before conversion to AD.
Figure 4: Hippocampal volumes, hippocampal grades, MMSE scores and patch-based MMSE estimation distributions adjusted for age. Significant differences were found for hippocampal volumes (p=0.004), hippocampal grades (p<0.00001) and patch-based MMSE estimation (p<0.00001), but not for MMSE scores (p=0.16).
cCN sCN 5500 6000 6500 7000 7500 8000 8500
Hippocampal Volume
Volume in stx in mm 3 cCN sCN 0 0.1 0.2 0.3 0.4 0.5Hippocampal Grading
Average grading value
cCN sCN 24 25 26 27 28 29 30 31
MMSE
MMSE score cCN sCN 24 25 26 27 28 29 30 31Patch−based MMSE estimation
Average patch
−
Figure 5: Receiver operating characteristic curves showing classifier performance for both considered imaging biomarkers and the global cognitive score. Posterior probabilities of a linear discriminant analysis were used within a leave-one-out cross-validation procedure.
0 0.2 0.4 0.6 0.8 1 0 0.2 0.4 0.6 0.8 1
False positive rate
True positive rate
ROC for Hippocampal Volume
AUC = 58.1 [95% CI 54.4 − 72.3] 0 0.2 0.4 0.6 0.8 1 0 0.2 0.4 0.6 0.8 1
False positive rate
True positive rate
ROC for Hippocampal Grading
AUC = 73.0 [95% CI 63.6 − 81.3] 0 0.2 0.4 0.6 0.8 1 0 0.2 0.4 0.6 0.8 1
False positive rate
True positive rate
ROC for MMSE
AUC = 52.0 [95% CI 40.4 − 61.6] 0 0.2 0.4 0.6 0.8 1 0 0.2 0.4 0.6 0.8 1
False positive rate
True positive rate
ROC for patch−based MMSE
Acknowledgments
The Three-City study is conducted under a partnership agreement between the Institut National de la Santé et de la Recherche Médicale (INSERM), the University Bordeaux 2 Victor Segalen and Sanofi-Aventis. The Fondation pour la Recherche Médicale funded the preparation and initiation of the study. The Three-City study is also supported by the Caisse Nationale Maladie des Travailleurs Salariés, Direction Générale de la Santé, MGEN, Institut de la Longévité, Conseils Régionaux d’Aquitaine et Bourgogne, Fondation de France, Ministry of Research-INSERM Programme “Cohortes et collections de données biologiques”. The 10-year and 12 year follow-up have been financed by ANR 2007LVIE 003 and "Fondation Plan Alzheimer". Data collection and sharing for this project were funded by the Alzheimer's Disease Neuroimaging Initiative (ADNI) (National Institutes of Health Grant U01 AG024904). The ADNI is funded by the National Institute on Aging and the National Institute of Biomedical Imaging and Bioengineering and through generous contributions from the following: Abbott, AstraZeneca AB, Bayer Schering Pharma AG, Bristol-Myers Squibb, Eisai Global Clinical Development, Elan Corporation, Genentech, GE Healthcare, GlaxoSmithKline, Innogenetics NV, Johnson & Johnson, Eli Lilly and Co., Medpace, Inc., Merck and Co., Inc., Novartis AG, Pfizer Inc., F. Hoffmann-La Roche, Schering-Plough, Synarc Inc., as well as nonprofit partners, the Alzheimer's Association and Alzheimer's Drug Discovery Foundation, with participation from the U.S. Food and Drug Administration. Private sector contributions to the ADNI are facilitated by the Foundation for the National Institutes of Health (www.fnih.org). The grantee organization is the Northern California Institute for Research and Education, and the study was coordinated by the Alzheimer's Disease Cooperative Study at the University of California, San Diego. ADNI data are disseminated by the Laboratory for Neuro Imaging at the University of California, Los Angeles. This research was also supported by NIH grants P30AG010129, K01 AG030514 and the Dana Foundation. This study has been carried out with financial support from the French State, managed by the French National Research Agency (ANR) in the frame of the Investments for the future Programme IdEx Bordeaux (ANR-10-IDEX-03-02), Cluster of excellence CPU, TRAIL (HR-DTI ANR-10-LABX-57) and the CNRS multidisciplinary project "Défi ImagIn". We also acknowledge funding from the Fonds de Recherche Québec - Sant é (FRQS-Pfizer). This work has been also supported by the Spanish grant TIN2011-26727 from Ministerio de Ciencia e Innovación.
Disclosure statement
Hippocampal grading method is the subject of a US provisional patent application (US 61/535,720 / P1310USPR). D.L. Collins is a consultant for NeuroRx Inc. and co-founder of True Positive Medical Devices Inc.
References
1. Karran E, Hardy J. Antiamyloid therapy for Alzheimer's disease--are we on the right road? The New England journal of medicine. 2014;370(4):377-8.
2. Cummings JL, Grossberg GT, Green P, Tocco M, Resnick EM, Olin JT, et al., editors. A review of the safety and tolerability of treatments for moderate to severe Alzheimer's disease. European journal of neurology; 2007.
3. Callaway E. Alzheimer's drugs take a new tack. Nature. 2012;489:13-4.
4. Frisoni GB, Fox NC, Jack CR, Scheltens P, Thompson PM. The clinical use of structural MRI in Alzheimer disease. Nat Rev Neurol. 2010;6(2):67-77.
5. Braskie MN, Thompson PM. A focus on structural brain imaging in the Alzheimer's disease neuroimaging initiative. Biological psychiatry. 2014;75(7):527-33.
6. Cuingnet R, Gerardin E, Tessieras J, Auzias G, Lehericy S, Habert MO, et al. Automatic classification of patients with Alzheimer's disease from structural MRI: a comparison of ten methods using the ADNI database. NeuroImage. 2011;56(2):766-81. 7. Frisoni GB, Fox NC, Jack CR, Jr., Scheltens P, Thompson PM. The clinical use of structural MRI in Alzheimer disease. Nat Rev Neurol. 2010;6(2):67-77.
8. Jack Jr CR, Knopman DS, Jagust WJ, Petersen RC, Weiner MW, Aisen PS, et al. Tracking pathophysiological processes in Alzheimer's disease: an updated hypothetical model of dynamic biomarkers. The Lancet Neurology. 2013;12(2):207-16.
9. Wolz R, Julkunen V, Koikkalainen J, Niskanen E, Zhang DP, Rueckert D, et al. Multi-method analysis of MRI images in early diagnostics of Alzheimer's disease. PLoS One. 2011;6(10):e25446.
10. Coupe P, Eskildsen SF, Manjon JV, Fonov VS, Collins DL. Simultaneous segmentation and grading of anatomical structures for patient's classification: application to Alzheimer's disease. NeuroImage. 2012;59(4):3736-47.
11. Coupe P, Eskildsen SF, Manjon JV, Fonov VS, Pruessner JC, Allard M, et al. Scoring by nonlocal image patch estimator for early detection of Alzheimer's disease. NeuroImage Clinical. 2012;1(1):141-52.
12. Jack CR, Jr., Bernstein MA, Fox NC, Thompson P, Alexander G, Harvey D, et al. The Alzheimer's Disease Neuroimaging Initiative (ADNI): MRI methods. J Magn Reson Imaging. 2008;27(4):685-91.
13. McKhann G, Drachman D, Folstein M, Katzman R, Price D, Stadlan EM. Clinical diagnosis of Alzheimer's disease: report of the NINCDS-ADRDA Work Group under the auspices of Department of Health and Human Services Task Force on Alzheimer's Disease. Neurology. 1984;34(7):939-44.
14. Group CS. Vascular factors and risk of dementia: design of the Three-City Study and baseline characteristics of the study population. Neuroepidemiology. 2003;22(6):316-25. 15. Folstein MF, Folstein SE, McHugh PR. "Mini-mental state". A practical method for grading the cognitive state of patients for the clinician. J Psychiatr Res. 1975;12(3):189-98. 16. Bernard C, Helmer C, Dilharreguy B, Amieva H, Auriacombe S, Dartigues JF, et al. Time course of brain volume changes in the preclinical phase of Alzheimer's disease. Alzheimer's & dementia : the journal of the Alzheimer's Association. 2014.
17. Aubert-Broche B, Fonov VS, Garcia-Lorenzo D, Mouiha A, Guizard N, Coupe P, et al. A new method for structural volume analysis of longitudinal brain MRI data and its application in studying the growth trajectories of anatomical brain structures in childhood. NeuroImage. 2013;82:393-402.
18. Coupe P, Manjon JV, Gedamu E, Arnold D, Robles M, Collins DL. Robust Rician noise estimation for MR images. Med Image Anal. 2010;14(4):483-93.
19. Coupe P, Yger P, Prima S, Hellier P, Kervrann C, Barillot C. An optimized blockwise nonlocal means denoising filter for 3-D magnetic resonance images. IEEE Trans Med Imaging. 2008;27(4):425-41.
20. Sled JG, Zijdenbos AP, Evans AC. A nonparametric method for automatic correction of intensity nonuniformity in MRI data. IEEE Trans Med Imaging. 1998;17(1):87-97.
21. Collins DL, Neelin P, Peters TM, Evans AC. Automatic 3D intersubject registration of MR volumetric data in standardized Talairach space. Journal of computer assisted tomography. 1994;18(2):192-205.
22. Fonov V, Evans AC, Botteron K, Almli CR, McKinstry RC, Collins DL, et al. Unbiased average age-appropriate atlases for pediatric studies. NeuroImage. 2011;54(1):313-27. 23. Eskildsen SF, Coupe P, Fonov V, Manjon JV, Leung KK, Guizard N, et al. BEaST: brain extraction based on nonlocal segmentation technique. NeuroImage. 2012;59(3):2362-73.
24. Nyul LG, Udupa JK. Standardizing the MR image intensity scales: making MR intensities have tissue specific meaning. P Soc Photo-Opt Ins. 2000;1(21):496-504.
25. Coupe P, Manjon JV, Fonov V, Pruessner J, Robles M, Collins DL. Patch-based segmentation using expert priors: application to hippocampus and ventricle segmentation. NeuroImage. 2011;54(2):940-54.
26. Dukart J, Schroeter ML, Mueller K, Alzheimer's Disease Neuroimaging I. Age correction in dementia--matching to a healthy brain. PLoS One. 2011;6(7):e22193.
27. Scahill RI, Frost C, Jenkins R, Whitwell JL, Rossor MN, Fox NC. A longitudinal study of brain volume changes in normal aging using serial registered magnetic resonance imaging. Archives of neurology. 2003;60(7):989-94.
28. Schott JM, Fox NC, Frost C, Scahill RI, Janssen JC, Chan D, et al. Assessing the onset of structural change in familial Alzheimer's disease. Annals of neurology. 2003;53(2):181-8.
29. Dietterich TG. Ensemble methods in machine learning. Multiple classifier systems: Springer; 2000. p. 1-15.
30. Franke K, Luders E, May A, Wilke M, Gaser C. Brain maturation: predicting individual BrainAGE in children and adolescents using structural MRI. NeuroImage. 2012;63(3):1305-12.
31. Zhang D, Shen D, Alzheimer's Disease Neuroimaging I. Predicting future clinical changes of MCI patients using longitudinal and multimodal biomarkers. PLoS One. 2012;7(3):e33182.
32. Stonnington CM, Chu C, Klöppel S, Jack CR, Ashburner J, Frackowiak RSJ, et al. Predicting clinical scores from magnetic resonance scans in Alzheimer's disease. NeuroImage. 2010;51(4):1405-13.
33. Eskildsen SF, Coupé P, Fonov VS, Pruessner JC, Collins DL, Alzheimer's Disease Neuroimaging I. Structural imaging biomarkers of Alzheimer's disease: predicting disease progression. Neurobiol Aging. 2015;36:S23-S31.
34. Komlagan M, Ta V-T, Pan X, Domenger J-P, Collins DL, Coupé P, et al. Anatomically Constrained Weak Classifier Fusion for Early Detection of Alzheimer’s Disease. Machine Learning in Medical Imaging: Springer; 2014. p. 141-8.
35. Tong T, Wolz R, Gao Q, Guerrero R, Hajnal JV, Rueckert D, et al. Multiple instance learning for classification of dementia in brain MRI. Med Image Anal. 2014;18(5):808-18. 36. Ewers M, Walsh C, Trojanowski JQ, Shaw LM, Petersen RC, Jack CR, Jr., et al. Prediction of conversion from mild cognitive impairment to Alzheimer's disease dementia based upon biomarkers and neuropsychological test performance. Neurobiol Aging. 2012;33(7):1203-14.
37. Suk H-I, Lee S-W, Shen D, Alzheimer's Disease Neuroimaging I. Hierarchical feature representation and multimodal fusion with deep learning for AD/MCI diagnosis. NeuroImage. 2014;101:569-82.
38. Moradi E, Pepe A, Gaser C, Huttunen H, Tohka J, Alzheimer's Disease Neuroimaging I. Machine learning framework for early MRI-based Alzheimer's conversion prediction in MCI subjects. NeuroImage. 2015;104:398-412.
39. Falahati F, Westman E, Simmons A. Multivariate data analysis and machine learning in Alzheimer's disease with a focus on structural magnetic resonance imaging. Journal of Alzheimer's disease: JAD. 2014;41(3):685-708.
40. Kantarci K, Petersen RC, Boeve BF, Knopman DS, Weigand SD, O'Brien PC, et al. DWI predicts future progression to Alzheimer disease in amnestic mild cognitive impairment. Neurology. 2005;64(5):902-4.
41. Fellgiebel A, Dellani PR, Greverus D, Scheurich A, Stoeter P, Müller MJ. Predicting conversion to dementia in mild cognitive impairment by volumetric and diffusivity measurements of the hippocampus. Psychiatry Research: Neuroimaging. 2006;146(3):283-7. 42. van Norden AGW, de Laat KF, Fick I, van Uden IWM, van Oudheusden LJB, Gons RAR, et al. Diffusion tensor imaging of the hippocampus and verbal memory performance: The RUN DMC Study. Human brain mapping. 2012;33(3):542-51.
43. Devanand DP, Pradhaban G, Liu X, Khandji A, De Santi S, Segal S, et al. Hippocampal and entorhinal atrophy in mild cognitive impairment: Prediction of Alzheimer disease. Neurology. 2007;68(11):828-36.
44. Fleisher AS, Sun S, Taylor C, Ward CP, Gamst AC, Petersen RC, et al. Volumetric MRI vs clinical predictors of Alzheimer disease in mild cognitive impairment. Neurology. 2008;70(3):191-9.
45. Westman E, Simmons A, Muehlboeck JS, Mecocci P, Vellas B, Tsolaki M, et al. AddNeuroMed and ADNI: Similar patterns of Alzheimer's atrophy and automated MRI classification accuracy in Europe and North America. NeuroImage. 2011;58(3):818-28.
46. Jack CR, Jr., Barkhof F, Bernstein MA, Cantillon M, Cole PE, Decarli C, et al. Steps to standardization and validation of hippocampal volumetry as a biomarker in clinical trials and diagnostic criterion for Alzheimer's disease. Alzheimer's & dementia : the journal of the Alzheimer's Association. 2011;7(4):474-85 e4.
47. Mapstone M, Cheema AK, Fiandaca MS, Zhong X, Mhyre TR, MacArthur LH, et al. Plasma phospholipids identify antecedent memory impairment in older adults. Nature medicine. 2014;20(4):415-8.
48. Hansson O, Zetterberg H, Buchhave P, Londos E, Blennow K, Minthon L. Association between CSF biomarkers and incipient Alzheimer's disease in patients with mild cognitive impairment: a follow-up study. The Lancet Neurology. 2006;5(3):228-34.