Deploying Fluorescent Nucleoside Analogues
for High#Throughput Inhibitor Screening
The MIT Faculty has made this article openly available.
Please share
how this access benefits you. Your story matters.
Citation
Seebald, Leah et al. "Deploying Fluorescent Nucleoside Analogues
for High#Throughput Inhibitor Screening." ChemBioChem 21, 1-2
(January 2020): 108-112 © 2019 Wiley-VCH Verlag GmbH & Co.
KGaA, Weinheim
As Published
http://dx.doi.org/10.1002/cbic.201900671
Publisher
Wiley
Version
Author's final manuscript
Citable link
https://hdl.handle.net/1721.1/126269
Terms of Use
Creative Commons Attribution-Noncommercial-Share Alike
Detailed Terms
http://creativecommons.org/licenses/by-nc-sa/4.0/
Deploying Fluorescent Nucleoside Analogues for High Throughput
Inhibitor Screening
Leah Seebald, Amaël Madec, Barbara Imperiali*[a]
[a] Dr. L. Seebald, Dr. A. Madec, Prof. B. Imperiali,
Department of Biology and Department of Chemistry Massachusetts Institute of Technology, Cambridge, MA 02139 (USA) E-mail: imper@mit.edu
[**] This research was supported by the National Institutes of Health GM097241 and GM131627.
Keywords: environment-sensitive fluorophore • glycosyltransferase • high throughput screening • nucleoside analogue
Abstract:
High-throughput small molecule screening in drug discovery processes commonly rely on fluorescence-based methods including fluorescent polarization and fluorescence/Förster resonance energy transfer. These techniques use highly accessible instrumentation, however may suffer from high false negative rates and background signals or, may involve complex schemes for the introduction of fluorophore pairs. Herein, we present the synthesis and application of fluorescent nucleoside analogues as the foundation for directed approaches for competitive binding analyses. The general approach describes selective fluorescent
environment-sensitive (ES) nucleoside analogues that are adaptable to diverse enzymes that act on nucleoside-based substrates. We demonstrate screening a set of uridine analogues and development of an assay for fragment-based lead discovery with the TcdB glycosyltransferase (GT), an enzyme associated with virulence in Clostridium difficile. The uridine-based probe used for this HTS has a KD of 7.2 µM with the TcdB GT and shows a >30-fold increase in
fluorescence intensity upon binding. The ES-based probe assay is benchmarked against two other screening approaches.
We present the development of nucleoside-based environment sensitive fluorophore (ESF) probes that are applicable to competitive-binding analyses. Use of the ESF probes is illustrated by application to a high throughput fragment-based screen for identification of leads for inhibitor development against a clinically-relevant glycosyl transferase from the Clostridium
difficile TcdB toxin. Enzyme ON OFF + ligand ligand RFU wavelength (nm)λ / nm RF U
Introduction:
Fluorescence-based analytical approaches are ubiquitous in biochemical and biological studies and form the mainstay of small-molecule ligand discovery efforts in chemical biology and medicinal chemistry research. Fluorescence is particularly useful in high throughput screening applications where alternative approaches, such as those involving radioactivity or complex instrumentation, are less accessible. Methods including fluorescence polarization (FP) [1] and differential scanning fluorimetry (DSF) [2] analyses are widely applied for initial steps in small molecule screening. FP assays are based on changes in the orientation and mobility of ligands upon binding to macromolecules, thereby providing information on solution state interactions.[3] FP plays an important role in the drug discovery process; when adapted to a multi-well plate reader format, FP assays provide relatively low cost analyses across a wide range of screening conditions.[4] In DSF, changes in protein stability due to small molecule binding are quantified by assessing thermal shifts in the presence of a dye, such as SYPRO® Orange, which becomes more fluorescent when bound to unfolded proteins. Applications of both FP and DSF in high-throughput screening (HTS) and drug development are well known and have been thoroughly reviewed.[5]
Despite the advantages of the aforementioned methods, there are notable drawbacks. For example, with FP there may be fluorophore aggregation,[6] unacceptable false-negative rates from high background due to excess fluorophore,[7] small variations in buffer and pH influencing the polarization of free fluorophore,[2] and in particular for fragment-based screening, competition between the large excess of screening compounds and fluorophores for
hydrophobic patches on protein surfaces.[8] In DSF, thermal shifts may be very small (<1 °C) and information on the site of small-molecule binding is not defined by the assay. In light of these issues, there remains a need for equally accessible and complementary methods for HTS screening for small-molecule protein ligands.
As an alternative to FP and DSF, enzyme-targeted ligands that have been elaborated with environment-sensitive fluorophores (ESFs) can provide advantages for HTS. ESFs have been extensively used as solvent polarity indicators[9] and as probes for investigating protein interactions and dynamics.[10] ESFs are highly sensitive to the polarity of the local
microenvironment due to modulation of the fluorophore quantum yield, which impacts signal brightness. Some ESFs may also undergo changes in emission wavelengths and thus are designated as solvatochromic.[11] Importantly, for ESFs that show an increased quantum yields with decreased solvent polarity, an excess of unbound ESF-containing reagents in HTS assays does not significantly contribute to background fluorescence,[12] thereby mitigating the problem
of false negatives arising in some FP-based screens.[13] Additionally, ESF probes that are selective for a specific hydrophobic binding pocket (i.e. ligand targeted) on a protein can compete for binding against candidate ligands used in HTS, providing an alternative readout to nonspecific fluorophore-dependent measurements to determine thermal stabilization by ligands in DSF-based assays.[2, 14] Finally, ligand-targeted ESFs enable validation of competitive binding at a protein binding site by observed decreases in fluorescence in the presence of the ligand.
Selectivity of the ESF probe for an enzyme active site can be achieved by incorporating key features of the cognate substrate scaffold. In this report, we describe ESF-derivatized nucleosides as probes for HTS of enzymes that use sugar nucleotides as substrates including the plethora of glycosyltransferases (GTs) that are implicated in complex glycan biosynthesis (Figure 1). First, we present the synthesis and screening of four nucleoside analogs as probes for HTS. Then, we exemplify the application of ESF-conjugated nucleoside probes in an HTS assay of the N-terminal GT domain of TcdB. TcdB is a polyprotein produced by Clostridium
difficile, a Gram-positive gastrointestinal pathogen that is currently a leading cause of
hospital-acquired infections in developed countries.[15] TcdB is a primary virulence factor for C. difficile, and is a member of a family of glucosylating toxins that inactivate small GTPases responsible for eukaryotic signaling pathways.[16] TcdB is a potential pharmacological target for inhibition to prevent the host target glucosylation that is associated with bacterial virulence,[17] and because of the current medical relevance of C. difficile.[18]
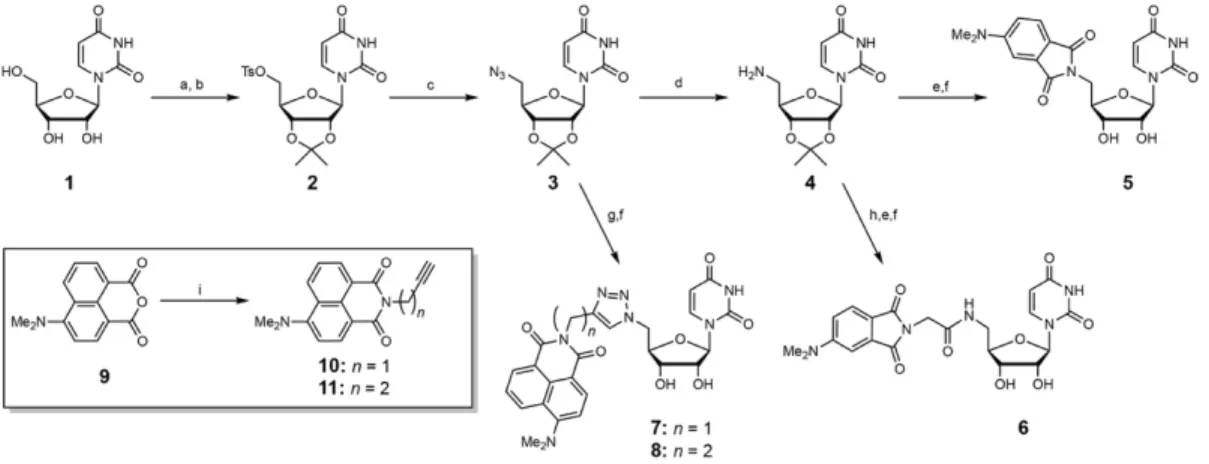
Figure 1. A) Probes synthesized for this study. Probes are based on a synthetically-accessible C5' amino-uridine analogue coupled to DMAP and DMN ESFs via varied linkers. B) Application of tailored uridine-based probes for HTS of enzymes selective for uridine-based enzyme substrates.
The ESFs employed in the current studies are based on N,N-4-dimethylamino-phthalimide (DMAP) and N,N-4-dimethylamino-naN,N-4-dimethylamino-phthalimide (DMN) derivatives.[19] These imides exhibit minimal fluorescence in polar aqueous environments – thus fluorescence is “turned off” in an unbound state – and enhanced fluorescence in hydrophobic environments (e.g. protein binding sites) – thus fluorescence is “turned on” in a bound state.[20] These fluorophores also show a small (40-80 nm) hypsochromic shifts.[19] DMAP and DMN are ideal fluorophores for substrate analogue preparation due to their relatively small size, which is less likely to perturb a natural substrate scaffold.[10a, 21] Additionally, synthesis can be accomplished while simultaneously minimizing the overall effort by utilizing standard coupling methods, such as amide coupling or Cu(I)-catalyzed azide-alkyne cycloaddition (Cu(I)AAC),[22] and a common nucleoside building block - in this case a uridine analog, with a primary amine handle at the ribose C-5'.The general approach described herein should be readily adaptable to diverse enzymes that act on nucleoside-based substrates and should be compatible with HTS discovery efforts.
Results
Uridine diphosphate glucose (UDP-Glc) is the glucosyl donor substrate for the TcdB GT (Km 21 µM),[23] therefore we chose a uridine core as the key structural feature for active-site recognition and conjugated both 4-DMAP[21a] and 4-DMN[21b] ESFs via varied linkers to screen for binding and fluorescence. The ESFs were appended to the ribose C-5' of uridine, using the modified amino-uridine derivative (4), by standard amide coupling methods or Cu(I)AAC (Scheme 1) to afford probes 5 through 8. When conjugated, each of the probes exhibits
comparable fluorescence properties to those of the unmodified dyes in water or buffer (data not shown).
Scheme 1. Syntheses of ESF probes. Reagents and conditions: (a) Acetone, sulfuric acid; (b) p-Toluenesulfonyl chloride, 4-(dimethylamino)pyridine, pyridine, dichloromethane; (c) Sodium
azide, 40 ⁰C, DMF; (d) Pd(OH)-C, isopropyl alcohol, H2O, formic acid; (e)
N,N-Diisopropylethylamine, hydroxybenzotriazole, HBTU, DMF, 4-(N,N-dimethylamino)phthalic anhydride; (f) Trifluoroacetic acid, MeOH; (g) CuSO4, tris(3-hydroxypropyltriazolylmethyl)amine, sodium ascorbate, 7: compound 10, 8: compound 11; (h) i. Fmoc-Gly-OH,
N,N-diisopropylethylamine, HBTU, DMF, ii. 20% piperidine in DMF; (i)
For the presented assay, the best probe for the TcdB GT was 5; it showed a low
background signal in buffer and the fluorescence signal upon binding to the TcdB GT was linear across the µM concentration range (Figure S2). As determined by fluorescence titration, probe 5 bound to the TcdB GT with a KD of 7.2 ± 1.2 µM and, at saturation showed a >30-fold increase in fluorescence at 512 nm relative to the unbound state (Figure 2). In general, we anticipate that signal changes with the ESF-based probes above 5-fold would be sufficient for general
adaptation to HTS assays as this would provide statistically robust data for analysis. Addition of competing UDP-Glc reduced fluorescence to unbound levels showing that binding of probe 5 is both competitive and reversible (Figure S3). Probe displacement with UDP-Glc also serves as an ideal positive control for further assay development towards HTS applications.
Figure 2. A) Fluorescence spectra showing titration of probe 5 with 20 µM TcdB GT. B) Binding of 5 with 20 µM TcdB GT measured at 518 nm.
Probes 6 - 8 did not signal the TcdB GT, however, binding to other select GTs and phosphoglycosyl transferases (PGTs) was observed (Figure S1). All fluorescence studies
included TWEEN-20 (0.09%) to minimize non-specific binding.[6] Full experimental details for fluorescence studies can be found in the Supplementary Information.
Towards the development of an HTS method, the ESF probe assay was transferred to a multiwell-plate reader format; volume was scaled to 20 µL and optimal working concentrations for the TcdB GT and 5 were found to be 10 µM each. The Maybridge Ro3 1000 compound diversity library, which includes stock solutions of fragments dissolved in DMSO to a final concentration of 100 mM, was used for the screen. The screen was carried out at 5 mM final fragment concentration, which is typical in fragment screening.[24] The working assay solution, with the ESF probe and the fragments (at 5 mM), included DMSO at 5.5% of the final volume.
Each microwell plate in the HTS included analyses of the following samples: background fragment fluorescence, positive controls, negative controls, and maximum expected signal control. At high concentrations many fragments are fluorescent, so measurement of the
fragment fluorescence in assay buffer with no added enzyme was used as the background. This background was subtracted from the fluorescence of the working assay, which included the ESF probe, enzyme, fragment, and assay buffer. Additionally, UDP-Glc (at 1 mM and 100 µM) was used as a positive control for probe displacement on each microwell plate of the HTS. Blank wells containing assay buffer and 5.5% DMSO were added to each plate as a negative control. Lastly, wells with probe 5, the TcdB GT and 5.5% DMSO in the absence of fragment were included to provide the maximum signal for ratio-based calculations.
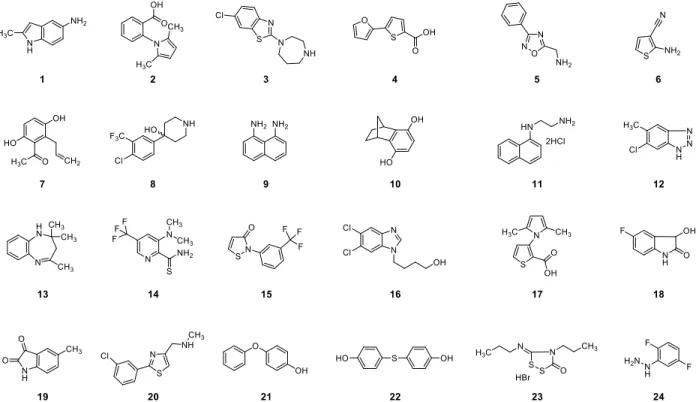
Hits were measured as the relative fluorescence ratio of background-corrected displacement signal to maximum signal (Eq. S1). The distribution of percent probe displaced (proportional to fragment binding) from the 1000-member library showed 34 fragments with a signal equal to, or more than 60% of the maximum observable signal (Figure S4). In HTS compound screening assays, validation of apparent hits is critical because false positives can arise from experimental artefacts, such as those due to fragment insolubility and fluorescence quenching.[8] In this case, the selection of 34 apparent hits was reduced to 24 hits after 10 fragments were determined to be false positives due to fluorescence quenching. In addition to the 24 apparent hits, five additional fragments were randomly selected as negative controls for further validation studies. The 24 apparent hits are numbered 1-24 and the additional five negative controls are numbered 25-29. The table also includes DMSO at 5.5% as a blank and additional negative control, numbered 30 (Table 1).
Hits and negative controls (1-30) from the ESF probe assay were tested with a DSF assay using SYPRO® Orange. In DSF, the protein Tm is the half maximum fluorescence signal found at complete protein denaturation. Samples exhibit a shifted Tm if stabilized or destabilized
in the presence of a screening compound, calculated as ΔTm.[8] Table 1 includes the ΔTm (determined in triplicate) of TcdB in the presence of fragments 1-29. The Tm of TcdB with an equivalent amount of DMSO, but without a fragment, was used as a control. Typically, fragments that stabilize the native conformation of a protein increase the Tm. However, some fragment binders may destabilize the native conformation upon binding to a non-native state of the enzyme.[25] Such fragments are still considered apparent hits, and are subject to further evaluation. DSF analyses may be complicated by interference from highly fluorescent fragments.[4] In this case the ΔT
m valuescannot be determinedand are thus recorded as not compatible (ΔTm: NC) with the DSF assay. A total of 11 fragments, of the 29 studied (Table 1), were deemed not compatible with DSF analysis, underscoring the need for alternative
approaches for HTS of fragments and other weak binders. Thus, in each of these cases, the ESF probe assay was able to provide a read-out for fragments that would have been eliminated from the HTS based solely on DSF incompatibility.
The 29 fragments were also subjected a biochemical activity assay. For this, we applied the Promega UDP-Glo® assay, which detects UDP release over the course of a GT reaction. Because this is a multienzyme-based detection assay, an equivalent high concentration of fragment to that used in ESF and DSF analyses was not compatible due to excessive off-target inhibition of assay enzymes. This is a well-known complication of fragment screening by activity analysis due to the high concentrations (typically 5 mM) that are necessary for hit identification in initial steps.[6] The activity of TcdB GT was tested in the presence of fragments at 800 µM. Fragments are typically weak binders, so high GT inhibition is not anticipated (Figure S5). Off-target inhibition of the Glo® reagent enzymes by the fragments was also tested and corrected for, however, in several cases we noted off-target inhibition of the Glo® assay at over 50% and these cases were deemed not compatible (NC) with the fragment assay (for complete error analysis see SI). Of the 29 fragments, 10 were found to be NC with the biochemical activity assay. This incompatibility rate is comparable that observed with the DSF assay and again underscores the value of the ESF probe-based approach. Structures of the fragment hits are available in the “Supplemental Information” and can now be further elaborated for structure-activity relationship (SAR) studies towards inhibitor development for TcdB (Figure S6).
In summary, although some of the hits from the ESF probe screen of the TcdB GT can be further validated using DSF or biochemical assay-based approaches, the significant rates of assay incompatibility with the high concentrations required for initial fragment-based screening highlights the challenges. From the 24 ESF-based leads, 30% were validated as hits by DSF and, an additional 46% could not be analyzed by DSF due to fluorescence interference from the
fragments. The enzyme-based biochemical assay also showed high incompatibility; 42% of the fragments showed excessive background inhibition of the assay itself (>50% even at 800 µM) and in this case only 20% of the ESF hits could be supported by activity analysis in the presence of 800 µM fragment. These percentages serve to highlight the potential of the ESF probes to address the challenges of low affinity fragments, a challenge that has been
documented between various HTS assays.[6, 26]
Conclusions
We have described a robust ESF-based assay for enzymes that act on nucleoside-based substrates such as the ubiquitous NDP-sugars that are extensively exploited as glycosyl donor substrates in the assembly of complex glycan structures and for post-translational protein modification. The exemplar assay uses a readily-accessible nucleoside analogue, which is modified with the environment-sensitive DMAP and shows a KD of 7.2 ± 1.2 µM with a >30-fold increase in fluorescence signal upon binding to the active site of the TcdB GT domain from the
C. difficile TcdB toxin. These properties make this probe highly amenable to HTS. The use of
the probe has been demonstrated in a fragment-based lead discovery screen using the 1000-member Ro3 Maybridge library; the ESF probe assay revealed 24 leads for further
development.
ESF nucleoside analogues, such as those presented in this report, can be applied to a diverse range of enzymes that act on nucleoside-based substrates. A subset of these enzymes includes glycosyltransferases and phosphoglycosyl transferases involved in the glycosylation pathways of bacterial pathogens that use NDP-sugars as substrates.[27] Many of these
glycosylation-related enzymes are potential antibiotic drug targets due to the key roles played in bacterial glycoconjugate biosynthesis. The strategy for nucleoside-based ESF probe
development provides valuable reagents for HTS applied to inhibitor development towards these nucleoside-accepting enzymes.
Table 1. Results of ESF probe (5) binding, DSF analysis and biochemical assay determination for 29 fragments # % probe displaced probe displaced Δ Tm Tm hits Inhibition at 800 µM # % probe displaced probe displaced Δ Tm Tm hits Inhibition at 800 µM
1 61 yes NC NC yes 16 78 yes -3.5 yes no
2 97 yes NC NC NC 17 98 yes NC NC NC
3 90 yes -0.2 no yes 18 80 yes NC NC NC
4 60 yes NC NC NC 19 88 yes NC NC yes
5 81 yes 1.0 yes no 20 79 yes -3.8 yes no
6 82 yes NC NC NC 21 76 yes 0.3 no no
7 90 yes 0.3 no NC 22 95 yes 1.2 yes no
8 66 yes -2.5 yes no 23 94 yes 0.5 no NC
9 61 yes NC NC yes 24 68 yes 1.2 yes NC
10 93 yes 1.8 yes NC 25 10 no 0.2 no no
11 87 yes NC NC yes 26 85[b] no -2.4 yes no
12 61 yes NC NC no 27 10 no 0.1 no no
13 83 yes NC NC no 28 9 no 0.3 no no
14 74 yes 0.8 no no 29 14 no 0.7 no no
15 95 yes -0.7 no NC 30[c] 0 no 40.5[c] no no
[a] NC: not compatible with DSF or biochemical assay at concentration of probe employed. [b] Concentration dependence validation showed this fragment to be a false positive as a fluorescence quencher in the ESF assay. [c] Control with equivalent volume of DMSO. [d] Tm for TcdB.
Acknowledgements
Financial support from the National Institutes of Health (GM097241 and GM131627
to B.I.) is gratefully acknowledged. We also acknowledge Dr. Nathaniel Shocker for expression and purification of TcdB, Dr. Debasis Das for initial fluorescence titration experiments and Dr. Christine Arbour for assistance with probe synthesis. We also acknowledge the MIT DCIF for NMR and HR-MS analyses. We thank Prof. Mathew Pratt and Narek Darabedian providing a sample of recombinant OGT.
[1] M. G. Lagorio, G. B. Cordon, A. Iriel, Photochem Photobiol 2015, 14, 1538-1559. [2] K. Huynh, C. L. Partch, Curr Protoc Protein Sci 2016, 1-19.
[3] D. M. Jameson, J. A. Ross, Chem. Rev. 2010, 110, 2685-2708. [4] W. A. Lea, A. Simeonov, Expert Opin. Drug Discov. 2011, 6, 17-32.
[5] M. D. Hall, A. Yasgar, T. Peryea, J. C. Braisted, A. Jadhav, A. Simeonov, N. P. Coussens, Methods
Appl Fluoresc. 2016, 4.
[6] B. J. Davis, D. A. Erlanson, Bioorg Med Chem Lett 2013, 23, 2844-2852.
[7] N. Malo, J. A. Hanley, S. Cerquozzi, J. Pelletier, R. Nadon, Nat. Biotechnol. 2006, 24, 167-175. [8] B. J. Davis, S. D. Roughley, Fragment-Based Lead Discovery, Vol. 50, 1st ed., Elsevier Inc., 2017. [9] C. Reichardt, Chem. Rev. 1994, 94, 2319-2358.
[10] a) G. S. Loving, M. Sainlos, B. Imperiali, Trends Biotechnol. 2010, 28, 73-83; b) W. L. Goh, M. Y. Lee, T. L. Joseph, S. T. Quah, C. J. Brown, C. Verma, S. Brenner, F. J. Ghadessy, Y. N. Teo, J. Am.
Chem. Soc. 2014, 136, 6159-6162.
[11] A. Marini, A. Muñoz-Losa, A. Biancardi, B. Mennucci, J. Phys. Chem. B 2010, 114, 17128-17135. [12] C. A. Telmer, R. Verma, H. Teng, S. Andreko, L. Law, M. P. Bruchez, ACS Chem. Biol. 2015, 10,
1239-1246.
[13] I. A. Karpenko, M. Collot, L. Richert, C. Valencia, P. Villa, Y. Mély, M. Hibert, D. Bonnet, A. S. Klymchenko, J. Am. Chem. Soc. 2015, 137, 405-412.
[14] H. L. Silvestre, T. L. Blundell, C. Abell, A. Ciulli, Proc. Natl. Acad. Sci. U.S.A. 2013, 110, 12984-12989.
[15] J. A. Karas, D. A. Enoch, S. H. Aliyu, J. Infect. 2010, 61, 1-8. [16] D. T. Denhardt, Biochem. J. 1996, 318, 729.
[17] J. Tam, G. L. Beilhartz, A. Auger, P. Gupta, A. G. Therien, R. A. Melnyk, Chem. Biol. 2015, 22, 175-185.
[18] S. S. Ghantoji, K. Sail, D. R. Lairson, H. L. DuPont, K. W. Garey, J Hosp Infect 2010, 74, 309-318. [19] G. S. Loving, B. Imperiali, J. Am. Chem. Soc. 2009, 130, 13630-13638.
[20] S. Fery-Forgues, J. P. Fayet, A. Lopez, Photochem. Photobiol. 1993, 70, 229-243.
[21] a) P. Venkatraman, T. T. Nguyen, M. Sainlos, O. Bilsel, S. Chitta, B. Imperiali, L. J. Stern, Nat.
Chem. Biol. 2007, 3, 222; b) G. Loving, B. Imperiali, J. Am. Chem. Soc. 2008, 130, 13630-13638.
[22] H. Li, R. Aneja, I. Chaiken, Molecules 2013, 18, 9797-9817.
[23] Z. L. Wu, C. M. Ethen, B. Prather, M. MacHacek, W. Jiang, Glycobiology 2011, 21, 727-733. [24] B. Lamoree, R. E. Hubbard, Essays in biochemistry 2017, 61, 453-464.
[25] a) P. Cimmperman, L. Baranauskiene, S. Jachimovičiute, J. Jachno, J. Torresan, V. Michailoviene, J. Matuliene, J. Sereikaite, V. Bumelis, D. Matulis, Biophys. J. 2008, 95, 3222-3231; bA. Kabir, R. P. Honda, Y. O. Kamatari, S. Endo, M. Fukuoka, K. Kuwata, Protein Sci. 2016, 25, 2132-2141. [26] A. Boettcher, S. Ruedisser, P. Erbel, D. Vinzenz, N. Schiering, U. Hassiepen, P. Rigollier, L. M.
Mayr, J. Woelcke, J Biomol Screen 2010, 15, 1029-1041.
[27] a) L. L. Lairson, B. Henrissat, G. J. Davies, S. G. Withers, Annu. Rev. Biochem. 2008, 77, 521-555; b) V. Lukose, M. T. C. Walvoort, B. Imperiali, Glycobiology 2017, 9, 820-833.
Supplementary Information for
Deploying Fluorescent Nucleoside Analogues for High Throughput Inhibitor Screening
Leah Seebald, Amaël Madec, Barbara Imperiali*Table of Contents
Materials and Methods ... 2
Fluorescence experiments. ... 2
Differential scanning fluorimetry ... 2
Cloning, expression and purification of TcdB GT ... 3
TcdB GT biochemical assays ... 3
Cloning, expression and purification of Cdc42 ... 4
High throughput fragment screen ... 4
Calculations ... 4 Supplemental figures ... 5 Figure S1 ... 5 Figure S2 ... 5 Figure S3 ... 6 Figure S4 ... 6 Figure S5 ... 7 Figure S6 ... 8 Synthesis ... 8 Synthesis of 5 ... 8 Synthesis of 6 ... 9 Synthesis of 7 ... 9 Synthesis of 8 ... 10 Synthesis of 9 ... 10 Synthesis of 10 ... 10 Synthesis of 11 ... 10 NMR spectra ... 11 References ... 16
Materials and Methods
All chemicals were purchased from commercial sources and used without further purification. Chromatographic purifications were conducted using SiliaFlash Irregular Silica Gel P60, 40 - 63 µm, 60 Å
(Silicycle). Thin-layer chromatography (TLC) was performed on Agela Technologies silica gel TLC plates. The Maybridge Ro3 chemical library was used as purchased, with fragments dissolved in DMSO to a final concentration of 100 mM. Compounds 1-5 were characterized by 1H and 13C NMR and HRMS. 1H and 13C NMR spectra were recorded on a Bruker 400 MHz NMR or 600 MHz spectrometer. Chemical shifts (δ) are reported in ppm relative to the residual proton in deuterated DMSO ((CD3)2SO) at 2.50 ppm for 1H and 39.52 ppm for 13C. MS spectra were collected using an LC-MS Agilent Series 1100 HPLC equipped with a YMC AQ12S03-1003 reverse phase C18 column and a Finnigan LCQ Deca electrospray ionization mass spectrometer, using a gradient of 5–95% acetonitrile in water with 0.1% TFA over 15 min.
Fluorescence experiments.
Fluorometer: Fluorescence measurements were conducted on a Horiba Jobin Yvon Fluoromax-3. TcdB GT was added to the cuvette (Starna Cells Inc, catalog number 16.100F-Q-10/Z15) at a fixed concentration with a final volume of 140 μL. Spectra were recorded in 50 mM HEPES, 100 mM NaCl, pH 7.5, 0.09% Tween-20. The fluorescence spectra were measured with excitation at 420 nm and the emission scan range from 450-650 nm. Compound 5 was titrated at varied concentrations from a high concentration stock.
Plate reader: Fluorescence measurements were conducted on a SynergyH1 multimode plate reader (Biotek). TcdB GT was added to the 96-well plate (Corning 3993 Assay plate, 96 well half area, no lid, flat bottom, non-binding surface, polystyrene) to a final concentration of 10 μM with a final volume of 30 μL. Dilutions were done with 50 mM HEPES, 100 mM NaCl, pH 7.5, 0.09% Tween-20. Compound 5 was added to the desired concentration, with the final DMSO concentration not exceeding 5.5%. The fluorescence spectra were measured with gain 120, plate read height 2.3 mm, excitation 420 nm, emission scan range 450-650 nm, at 25 ºC and shaking for 30 sec.
All data reported has been background corrected using the respective instrument software. Differential scanning fluorimetry. Samples were prepared to a final volume of 25 μL containing 10 μM TcdB GT protein in a buffer containing 50 mM HEPES, pH 7.5, 150 mM NaCl, 0.001% Triton X-100, 10X SYPRO orange® (diluted from a commercial stock solution of 5000X; Invitrogen). Each sample included a fragment from the Maybridge Ro3 master stocks added to a final concentration of 4 mM. DMSO in an equal volume for a separate sample was used as a reference. All samples were analyzed in triplicate. Fluorescence was measured using a Roche Lightcycler 480 RT-PCR instrument while increasing the temperature from 30 to 95 °C in increments of 4.4 °C/60 s. The midpoint temperature of the unfolding
protein transition (Tm) was calculated using the built-in functionality of the instrument software package. DMSO (Tref) was subtracted from the values obtained in the presence of fragment (Tfrag) to obtain thermal shifts ΔTm.[1]
Cloning, expression and purification of TcdB GT. The gene for the glycosyl transferase domain of TcdB (TcdB GT) from Clostridium difficile in a pUC57 vector was purchased from Genscript. Using
AAAAAAGGATCCATGAGTTTAGTTAATAGAAAACAGTTAGAAAAAATG and
AAAAAACTCGAGTCAAAGAGAACCTTCAAAATAATTCC as primers, the gene was amplified and cloned into a modified pET30b(+) vector containing an N-terminal His8 tag and a TEV protease cleavage site. Heterologous expression of TcdB GT was done in E. coli grown to an OD600 of 0.6 with isopropyl β-D-1-thiogalactopyranoside (IPTG) induction, and cells were harvested by centrifugation (3200 x g for 30 min). Cells were resuspended in buffer containing 50 mM sodium phosphate pH 7.3, 400 mM NaCl, 5 mM β-mercaptoethanol, and 10 mM imidazole; and tumbled with 4 µL protease inhibitor cocktail and 20 mg lysozyme for 15 min. 10 µg/mL DNaseI was added, followed by sonication to lyse. Lysate was cleared by centrifugation (100,000 x g for 50 min) and added to 3 mL of Ni-NTA resin
in a chromatography column. Resin was washed with a buffer (50 mM sodium phosphate pH 7.3, 400 mM NaCl, 5 mM β-mercaptoethanol), supplemented with imidazole with a gradient of 10-100 mM, followed by elution with 300 mM imidazole buffer, and fractions containing the purified protein were pooled after analysis by SDS-PAGE. Overnight dialysis was done on the pooled protein in 20 mM HEPES pH 7.3, 150 mM NaCl, 5 mM DTT with
addition of a His6-tagged TEV protease. After TEV cleavage the TcdB GT was flushed through a preequilibrated Ni-NTA resin and collected as the flow through.
TcdB GT biochemical assays. TcdB GT assays were performed using the UDP-Glo® assay [Promega cat. V6961], which detects UDP release from the glycosyl transferase reactions and provides a quantitative luminescence output. Off-target inhibition of the UDP-Glo® reagent enzymes by the fragments was tested and corrected for. UDP-Glo® assay control experiments were first conducted in the presence and absence of inhibitors at 1 μM UDP (for TcdB GT). These concentrations of UDP represent the amount of nucleotide released in a typical assay.[2] Using this information, the percent of background inhibition was used to adjust the luminescence readout. The reaction rate was determined to be linear over 15 min at the given concentrations. The quenching solution was prepared as described by Promega. Assays contained 30 μM Cdc42, 0.1% Triton X-100, 50 mM HEPES at pH 7.5, 100 mM KCl, 4 mM MgCl2, 1 mM MnCl2, 20 μM UDP-Glc, and 0.5 nM TcdB GT in a final volume of 20 μL. This assay used the catalytically-active TcdB
GT with Cdc42-His6 as the glycosyl acceptor and followed previously reported assay conditions.[3] Inhibitors were added at a final concentration of 800 μM with a final DMSO concentration of 5%. TcdB GT was preincubated in the reaction mixture lacking Glc for 10 min at rt. Upon the addition of UDP-Glc, the reaction was allowed to proceed for 5 min before the addition of quenching solution. The reaction mixture was transferred to a 96-well plate (white, nonbinding surface, Corning (Cat 3992). The luminescence measurements were carried out using a SynergyH1 multi-mode plate reader (Biotek). The 96-well plate was maintained at 25 ⁰C and was shaken in the double orbital mode at 237 cpm for 16 min followed by incubation for 44 min, after which time the luminescence was measured.
Cloning, expression and purification of Cdc42. This protocol was carried out from previous literature.[4]
High throughput fragment screen. Maybridge Ro3 plates were thawed and left at rt for 4 h prior to screen. Controls were pipetted directly into empty wells on the fragment plates. A master mix of the TcdB and compound 5 solution was prepared and pipetted into black well nonbinding 384 well plates (19 μL). The controls and fragments, 1 μL, were transferred by robot to the assay plates, and mixed. The final volume was 20 μL. Each plate was inspected for bubbles. If bubbles were present, the plate was centrifuged at high max speed for 1 min. The plates were read by the Tecan, at 10 minute and 1-hour time points. Kinetic reads showed negligible change in fluorescence signal. The following method was used on the Tecan i-control, infinite M10000Pro, serial # 1107006152. Reads were done with optimal gain. Excitation wavelength, 420 nm. Excitation bandwidth 5 nm. Emission wavelength 530 nm. Emission bandwidth 20 nm. Mode, fluorescence top reading. Number of flashes 50. Flash frequency 400 Hz. Integration time 20 µs. Lag time 0 μs. Settle time 0 ms. Z-position 20000 μm. Temp 28.8 ⁰C. The 384-well plates are Corning 384 flat bottom black polystyrol (Cat 3993).
Calculations
Background fluorescence of just the fragment = [background] TcdB + probe 5 = [maximum]
TcdB + probe 5 + fragment = [fragment]
Supplemental figures
Figure S1. A) Fluorescence spectra of probes 6-8 that were not a hit with TcdB GT. Light blue is the fluorescence from free dye in solution, dark blue is the fluorescence of the dye in the presence of an equivalent concentration of TcdB GT. B) Fluorescence spectra of probe 7 with OGT, and with select PGTs.
Figure S2. Linearity behavior demonstrated for probe 5 over a range of 1 µM to 150 μM, error bars represent triplicate sets.
Figure S3. Fluorescence spectra of probe 5 in the presence of TcdB GT, with a titration of UDP-Glc for substrate displacement.
Figure S4. Distribution of % probe displaced of the Maybridge Ro3 library containing a total of 1000 fragments. The final signal of 60% or higher was used as a cut off for fragment validation.
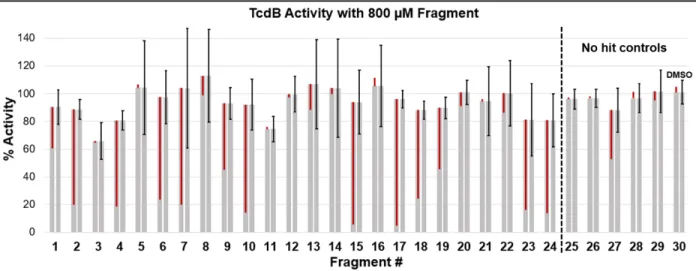
Figure S5. Biochemical activity of lead fragments and controls 1-30 at final concentration of 800 μM. Each fragment has two identical bars showing % activity. The left most bars of each fragment, those with a red line overlay, show a visual representation of % off-target assay inhibition by each fragment. The right most bars, those with the error bars. These error bars represent triplicate measurements of the biochemical activity assay and duplicate measurements of off-target assay inhibition, both used in the correction equation, Eq. 2. Correction and standard deviation equations shown below.
Off-target assay inhibition correction 100 − $% *JJ*K *3/:L:/K1% -.MK,- *3/:L:/K
% *JJ*K *3/:L:/K ∗ 100%; Eq. 2
Standard deviation calculated for propagation of error, using substitution with the two standard derived equations for addition/subtraction and multiplication/division.[5]
Addition/subtraction ex. 𝑥 = 𝑎 + 𝑏 − 𝑐 𝜎9 = Q𝜎* R+ 𝜎 2R + 𝜎3R Multiplication/division ex. 𝑥 =(*)(2) 3 UV 9 = QW UX *Y R + WUZ 2Y R + WU[ 3Y R
Figure S6. Top 24 leads from the Maybridge Ro3 library found by the ESF assay for TcdB inhibitor development.
Synthesis
Synthesis of compounds 1-4 has been previously reported.[6]
Synthesis of 5
. HBTU (69.0 mg, 0.182 mmol) and HOBt (24.5 mg, 0.182 mmol) were added to a solution of 4-(dimethylamino)phthalic anhydride (35.0 mg, 0.182 mmol) and 4 (50.0 mg, 0.152 mmol) in DMF (1.5 mL, 0.1 M). DIPEA (130 µL, 0.760 mmol) was added dropwise, and the resulting solution was stirred at rt under an inert nitrogen atmosphere for 14 h. The solution was diluted with 5% LiCl (10 mL), and extracted with EtOAc (3 X 25 mL). Organic layers were combined and dried with Na2SO4 and concentrated under reduced pressure. The intermediate product was dissolved in 4:1 H2O:TFA (5 mL) and stirred at rt for 14 h. Upon completion, the solvent was removed under reduced pressure and the title product was isolated as an amorphous bright yellow solid by flash chromatography using a gradient of 2-10% MeOH in DCM. Yield = 12.8 mg (20%). 1H NMR (600 MHz, DMSO-d6) δ: 11.34 (d, J = 2.3 Hz, 1H), 7.77 (d, J = 8.1 Hz, 1H), 7.64 (d, J = 8.5 Hz, 1H), 7.06 (d, J = 2.4 Hz, 1H), 6.95 (dd, J = 8.6, 2.4 Hz, 1H), 5.72 (d, J = 5.7 Hz, 1H), 5.65 (dd, J = 8.1, 2.3 Hz, 1H), 5.43 (s, 1H), 5.26 (s, 1H), 4.18 (t, J = 5.5 Hz, 1H), 4.02 (ddd, J = 7.8, 5.8, 3.9 Hz, 1H), 3.94 (t, J = 4.7 Hz, 1H), 3.84 – 3.74 (m, 2H), 3.10 (s, 6H); 13C NMR (101 MHz, DMSO-d6) δ: 168.74, 168.30, 163.51, 154.84, 151.15, 141.61, 134.55, 129.59, 125.10, 116.66, 115.41, 114.72, 105.84, 102.32, 88.79, 81.36, 72.83, 71.68, 47.81.; HRMS (ESI) m/z calcd. for C19H20N4O7 [M + H]+ 417.1410; found 417.1390.
Synthesis of 6. HBTU (19.1 mg, 0.050 mmol) and HOBt (6.8 mg, 0.050 mmol) were added to a solution
of Fmoc-Gly-OH (25.0 mg, 0.084 mmol) and 4 (20.0 mg, 0.042 mmol) in DMF (500 µL, 0.1 M). DIPEA (130 µL, 0.760 mmol) was added dropwise, and the resulting solution was stirred at rt under inertnitrogen atmosphere for 4 h. To the solution 4-methyl-piperidine (500 µL) was added and allowed to stir for 30 min under inert atmosphere. The solution was diluted in water (2 mL) and dropwise neutralized with 0.5 M HCl, then extracted with EtOAc (3 x 5 mL). Organic layers were combined and dried with Na2SO4 and concentrated under reduced pressure. The crude oil was carried over without further
purification. Next, the same procedure from 5 was followed for coupling the anhydride. HBTU (19.1 mg, 0.050 mmol) and HOBt (6.75 mg, 0.050 mmol) were added to a solution of 4-(dimethylamino)phthalic anhydride (9.6 mg, 0.050 mmol) and crude 6 in DMF (500 µL, 0.1 M). DIPEA (43 µL, 0.253 mol) was added dropwise, and the resulting solution was stirred at rt under inert nitrogen atmosphere for 14 h. The solution was diluted with 5% LiCl (1 mL), and extracted with EtOAc (3 X 5 mL). Organic layers were combined and dried with Na2SO4 and concentrated under reduced pressure. The intermediate product was dissolved in 4:1 H2O:TFA (1 mL) and stirred at rt for 14 h. Upon completion, the solvent was removed under reduced pressure and the title product was isolated as an amorphous bright yellow solid by flash chromatography using a gradient of 2-10% MeOH in DCM. Yield = 2.1 mg (8.8%). 1H NMR (600 MHz, DMSO-d6) δ: 8.38 (t, J = 5.9 Hz, 1H), 7.65 (d, J = 1.7 Hz, 1H), 7.63 (d, J = 1.3 Hz, 1H), 7.06 (d, J = 2.5 Hz, 1H), 6.96 (dt, J = 8.7, 2.1 Hz, 1H), 5.75 (d, J = 5.6 Hz, 1H), 5.64 (dd, J = 8.1, 2.3 Hz, 1H), 4.15 (d, J = 7.4 Hz, 2H), 4.05 (t, J = 5.5 Hz, 1H), 3.86 (t, J = 4.9 Hz, 1H), 3.80 (dt, J = 6.5, 4.4 Hz, 1H), 3.45 (ddd, J = 14.0, 6.1, 4.5 Hz, 1H), 3.28 (dt, J = 14.0, 6.1 Hz, 1H), 3.10 (s, 6H). 13C NMR (151 MHz, DMSO-d 6) δ: 168.57, 168.08, 167.27, 163.50, 154.81, 151.22, 144.31, 134.88, 125.08, 117.35, 117.09, 115.40, 105.81, 102.51, 101.16, 88.59, 82.95, 72.92, 71.04, 55.02, 47.63. HRMS (ESI) m/z calcd. for C19H20N4O7 [M + H]+ 473.155; found 473.1610.
Synthesis of 7. A 0.2 M aqueous solution of copper sulfate (85 µL, 0.017 mmol) was added to 170 µL of a 0.2 M aqueous solution of THTPA (170 µL, 0.035 mmol) and transferred to a round-bottom flask containing 3 (58.7 mg, 0.19 mmol). This was followed by the addition of the 6-(dimethylamino)-2(prop-2-yn-1-yl)-1,8-naphthalimide (48 mg, 0.017 mmol) in 200 µL of DMF. Finally, a 0.2 M aqueous solution of sodium ascorbate was added (136 µL, 0.027 mmol), and the reaction was stirred for 2 h. The reaction diluted with a 5% LiCl solution (10 mL) and extracted with EtOAc (3 X 25 mL). The organic layers were combined, dried over Na2SO4 and concentrated under reduced pressure. The crude residue was purified by flash silica chromatography using isocratic elution of 3% MeOH in DCM. The intermediate product was dissolved in 4:1 H2O:TFA (5 mL) and stirred at rt for 14 h. Upon completion, the solvent was removed under reduced
pressure and the title product was isolated as an amorphous bright orange solid. Yield = 25.0 mg (24%). 1H NMR (400 MHz, DMSO-d6) δ: = 11.34 (d, J = 2.3 Hz, 1H), 8.53 (dd, J = 8.5, 1.2 Hz, 1H), 8.47 (dd, J = 7.3, 1.1 Hz, 1H), 8.35 (d, J = 8.3 Hz, 1H), 7.98 (s, 1H), 7.76 (dd, J = 8.5 Hz, 7.3, 1H), 7.44 (d, J = 8.1 Hz, 1H), 7.22 (d, J = 8.4 Hz, 1H), 5.72 (d, J = 5.5 Hz, 1H), 5.59 (dd, J = 8.1, 2.2 Hz, 1H), 5.28 (d, J = 3.7 Hz, 2H), 4.61 (qd, J = 14.3, 5.8 Hz, 2H), 4.11 (dt, J = 7.3, 4.4 Hz, 1H), 3.99 (t, J = 5.5 Hz, 1H), 3.96 – 3.87 (m, 1H), 3.10 (s, 6H); 13C NMR (101 MHz, DMSO) δ 163.62, 163.07, 162.90, 156.94, 150.79, 143.47, 141.00, 132.67, 131.99, 130.94, 129.94, 129.18, 125.18, 124.38, 124.18, 122.39, 113.22, 113.14, 102.25, 88.57, 81.83, 72.19, 70.61, 51.24, 44.56, 35.15. HRMS (ESI) m/z calcd. for C19H20N4O7 [M + H]+ 547.182; found 547.1894.
Synthesis of 8. The same synthetic procedure was followed from 7 using 6-(dimethylamino)-2(but-3-yn-1-yl)-1,8-naphthalimide yielding the desired product as an amorphous bright yellow solid in 84% yield. 1H NMR (400 MHz, DMSO-d6) δ: = 11.37 (d, J = 2.2 Hz, 1H), 8.51 (dd, J = 8.5, 1.2 Hz, 1H), 8.45 (dd, J = 7.3, 1.1 Hz, 1H), 8.33 (d, J = 8.3 Hz, 1H), 7.95 (s, 1H), 7.75 (dd, J = 8.6, 7.3 Hz, 1H), 7.49 (d, J = 8.1 Hz, 1H), 7.21 (d, J = 8.4 Hz, 1H), 5.74 (d, J = 5.4 Hz, 1H), 5.62 (dd, J = 8.0, 2.2 Hz, 1H), 4.75 – 4.50 (m, 2H), 4.34 – 4.23 (m, 2H), 4.12 (dt, J = 7.1, 4.4 Hz, 1H), 4.02 (t, J = 5.5 Hz, 1H), 3.94 (d, J = 4.9 Hz, 1H), 3.10 (s, 6H), 2.98 (t, J = 7.7 Hz, 2H); 13C NMR (101 MHz, DMSO-d 6) δ: 163.77, 163.12, 163.10, 158.23, 156.77, 150.80, 144.02, 141.14, 132.48, 131.74, 130.76, 129.84, 125.17, 124.40, 123.47, 122.50, 113.48, 113.16, 102.22, 99.69, 88.75, 81.91, 72.26, 70.57, 51.19, 44.57, 40.33, 40.12, 39.91, 39.70, 39.61, 39.49, 39.28, 39.20, 39.07, 23.87 HRMS (ESI) m/z calcd. for C19H20N4O7 [M + H]+ 561.1970; found 561.200.
Synthesis of 9. Synthesis was carried out following the reported procedure.[7]
Synthesis of 10. Synthesis was carried out following the reported procedure.[8]
Synthesis of 11. Synthesis was carried out using the procedure for 10, substituting propargyl amine
hydrochloride for 3-butynylamine hydrochloride. Yield = 57.9 mg (42%). 1H NMR (400 MHz,Methanol-d4) δ 8.60 (ddd, J = 12.0, 7.9, 1.2 Hz, 2H), 8.49 (d, J = 8.3 Hz, 1H), 7.77 (dd, J = 8.5, 7.3 Hz, 1H), 7.27 (d, J = 8.3 Hz, 1H), 3.44 (s, 2H), 3.23 – 3.20 (m, 1H), 3.18 (s, 6H), 2.72 – 2.58 (m, 2H), 2.55 (t, J = 2.5 Hz, 1H).; 13C NMR (101 MHz, Methanol-d
4) δ 192.44, 189.68, 178.64, 176.10, 174.11, 165.30, 159.34, 146.77, 144.97, 134.90, 132.71, 131.88, 130.87, 124.56, 117.73, 112.91, 103.63, 43.63, 38.38.; HRMS (ESI) m/z calcd. for C18H16N2O2 [M + H]+ 292.121; found 292.1236.
References
[1] H. L. Silvestre, T. L. Blundell, C. Abell, A. Ciulli, Proc. Natl. Acad. Sci. U.S.A. 2013, 110, 12984-12989.
[2] A. G. E. Madec, N. S. Schocker, S. Sanchini, G. Myratgeldiyev, D. Das, B. Imperiali, ACS Chem.
Biol. 2018, 13, 2542-2550.
[3] J. Tam, G. L. Beilhartz, A. Auger, P. Gupta, A. G. Therien, R. A. Melnyk, Chem. Biol. 2015, 22, 175-185.
[4] P. Nalbant, L. Hodgson, V. Kraynov, A. Toutchkine, K. M. Hahn, Science 2004, 305, 1615-1619. [5] H. H. Ku, Journal of Research of the National Bureau of Standards, Section C: Engineering and
Instrumentation 1966, 70C, 263-263.
[6] Swastika, S. Chaturvedi, A. Kaul, P. P. Hazari, P. Jha, S. Pal, S. Lal, B. Singh, P. Barthélémy, A. K. Mishra, Int. J. Pharm. 2019, 565, 269-282.
[7] M. Sainlos, B. Imperiali, Nat. Protoc. 2007, 2, 3219-3225.
[8] M. Yang, Y. Song, M. Zhang, S. Lin, Z. Hao, Y. Liang, D. Zhang, P. R. Chen, Angew. Chem.,