Design and Development of a High-Altitude,
In-Flight-Deployable Micro-UAV
by MA
Tony S. Tao
B.S. Aerospace Engineering, 2010 The Pennsylvania State University
ARCHIVES
SSACHUSETTS 'NSTMTTEOF TECHNOLO3Y
u 1RA0RES
Submitted to the Department of Aeronautics and Astronauticson May 24, 2012 in partial fulfillment of the requirements for the degree of Master of Science in Aeronautics and Astronautics
at the
Massachusetts Institute of Technology May 2012
@
Massachusetts Institute of Technology, 2012. All rights reserved.Signature of Author
Department of Aeronautics and Astronautics May 24, 2012
Certified by
R. John Hansmuan Professor, Department of Aeronautics and Astronautics Thesis Advisor
/
/
Accepted by
Associate Professor
Eytan H. Modiano of Aeronautics and Astronautics Chair, Committee on Graduate Students
Design and Development of a High-Altitude,
In-Flight-Deployable Micro-UAV
by Tony S. Tao
Submitted to the Department of Aeronautics and Astronautics on May 24, 2012 in partial fulfillnent of the requirements for the degree of
Master of Science in Aeronautics and Astronautics at the
Massachusetts Institute of Technology May 2012
Abstract
A nicro-UAV ( UAV) system was developed to provide maximum endurance for a small atmospheric sensing payload. The system, composed of a 4UAV and protective case, folds and fits into a MJU-10/B flare cartridge (7.1" x 2.4" x 1.9") and is designed to be ejected in-flight from altitudes up to 30,000 ft at 300 G, to open and unfold in freefall, and to autonomous fly, sense, and transmit data for up to 45 minutes at mnaximnun altitude. The IUAV has a wingspan of 11.8", a length of 6.6", and a mass of 220 grains. Guided by first-principles, a series of design studies are conducted to maximize the airframe performance. The IUAV is refined through computational analysis, prototyping, and a multi-phase testing program involving wind tunnel, structural shock, and deployment tests. A series of airfoils was developed for the low Reynolds numbers in which the wings operate (between 30,000 and 80,000) and for manufacturing considerations. Detailed design of aircraft components is presented with a discussion of small-scale composites manufacturing processes. Folding and control mechanisms were developed to actuate control surfaces on a swinging wing. The resulting design carefully balances low Reynolds number aerodynamic effects, small-scale composite structures, and manufacturing capabilities in a configuration that offers unprecedented endurance (for aircraft of this size and altitude) in a widely-compatible package with mnission-reconfigurable payload.
Thesis Supervisor: R. John Hansman
Acknowledgements
I would like to thank my advisor, Dr R. John Hansman for his guidance and unwavering support throughout the past two years in the development and management of this thesis project. I would also like to thank Dr. Mark Drela for his valuable advice in aerodynamic design and construction techniques.
I would like to thank Russell Stratton for his encouragement and his development of the MATLAB endurance script and I would like to thank my undergraduate henchmen, especially Sam Range and Jonathan Allen, for their ideas and legwork in the construction of molding tools and protective cases.
I would also like to acknowledge the contributions by the members of the fall 2010 16.82 and spring 2011 16.821 classes for their input.
I am also very grateful for the MIT Lincoln Laboratory and the Air Force Contract #FA8721-05-C-0002 which funded this project; this work would not have been possible without their generosity.
Contents
A bstract ... ... - - - ... 2
Nomenclature ... 11
Chapter 1: Introduction... 13
1 .1. M issio n O v erv iew ... 15
1.1.1. Concept of Operations... 16
1.1.2. Driving Requirements:... 17
1.2. Requirement Details ... ... 18
1.2.1. High Altitude Environment ... ... 18
1.2.2. M JU-10/B Flare Cartridge ... ... 19
1 .2 .3 . S ta b ility ... ...- -. 2 0 1.3. Requirements Compared to Other UAV Systems ... 21
Chapter 2: LU AV System ... 23
2 .1 . O v e rv ie w ... 2 3 2 .2 . E x ten d ed P ay lo ad ... 26
2 .3 . A u ito p ilo t ... 2 6 2.4. Folding and Deployment ... 27
Chapter 3: Sizing and Configuration Design ... 31
3.1. Electric Propulsion Design Considerations ... 32
3.2. Endurance-Performance Relations ... 36
3.2.1. Endurance Equation Formulation... 36
3.2.2. Endurance M aximization Baseline ... 39
3.2.3. Refining Results for M axiiniun W ing Area ... 42
3.2.4. Refining results for motor efficiency considerations... 44
3.3. W ing Plaiforin Trade Analysis... 46
3 .4 . I ternial A rrang e n e t ... 5 1 3.5. Fuselage Design, Testing, aid Selection... 53
3.5.1. Fuselage Design aid Design M atching... 53
3.5.2. Fuselage drag test aid selection of final design... 56
3 .6 . R esu ltin g A irfram e ... 59
Chapter 4: Aerodynamic Testing and Refinement...66
4.1.1. Flight Prototypes ... . ... 66
4.2. W ind Tunnel Testing ... ... ... 68
4.2.1. Custom free-pivot wind tunnel balance... 68
4.2.2. W ind tunnel test results ... 70
4.2.1. Low-Reynolds airfoil nonlinear behavior ... 70
4.3. Airfoil Refinement for M anufacturing Limits... 74
4.3.1. Front W ing Airfoils ... 75
4.3.2. Rear W ing Airfoils... 79
4.4. Perform ance of New Airfoils... 82
4.5. Detailed Stability and Control Analysis... 84
4.5.1. Establishm ent of Regime ... 84
4.5.2. Stability Results ... ... 86
Chapter 5: tU A V D etailed D esign and Construction... 90
5 .1 . F u se la g e S h e ll ... 9 0 5 .1 .1 . S h e lls ... ... 9 1 5.1.2. Front wing fairing... 95
5 .2 . F ro n t W in g s ... 9 6 5 .2 .1 . H in g e D esign ... 9 7 5 .2 .2 . C o n stru ction ... 9 8 5 .3 . R e a r w i ig ... 10 4 5.3.1. Deploym ent mechanism ... 104
5.3.2. Elevon Control M echanism ... 107
5 .3 .3 . C o n stru ction ... 109
5 .4 . M o to r C a g e ... 1 1 2 5 .5 . P o w er S y stem ... 1 16 5 .5 .1 . B a ttery p a ck ... 1 16 5.5.1. Power system and performance...119
5.6. Assem bled Aircraft ... 122
Chapter 6: Protective Case and Deployment Sequence ... 123
6 .1 . C a se d e sign ... 1 2 3 6.2. Case opening mechanism ... 125
6 .3 . L au n ch S im u lation ... 128
Chapter 7: Integration and Testing... 131
7 .1 . S h o c k T e st ... 1 3 2 7.2. Deployment Into Flight ... 134
7.3. Summary and Future of Integration and Testing... ... ... 137
Chapter 8: Conclusion ... 139
Table of Figures
F igure 1: iU A V high-altitude m ission [1]... 15
Figure 2: M ission concept of operations ... 16
Figure 3: Temperature vs. altitude (1976 Standard Atmosphere) ... 18
Figure 4: W ind speed vs. altitude for Edwards AFB [2]... 18
F igure 5: M JU 10/B flare cartridge [4]... . 19
Figure 6: Schem atic of flare cartridge system ... 19
Figure 7: A vailable system envelope ... 20
Figure 8: Required performance vs. survey of current small UAVs ... 21
Figure 9: Aircraft and case stowed (left) and deployed (right)... 23
F igure 10: 4U A V and case package... 24
Figure 11: O verview of iUAV external features... 24
Figure 12: O verview of 4U AV internal features ... 25
Figure 13: M axim um -payload configuration... 26
F igure 14: M IT LL custom autopilot ... 26
Figure 15: 4UAV wing folding...27
Figure 16: Front w ing overlap and flexure ... 27
Figure 17: Rear wing stacking... ... 28
Figure 18: Rear wing folding... 28
Figure 19: Stowed configuration, side projection... 28
Figure 20: Protective case opening... .... 29
Figure 21: Expanded 3-view of 4U A V ... 30
Figure 22: Electrical propulsion system layout ... 32
Figure 23: Ragone plot showing specific energy vs. specific power [16]... 33
Figure 24: Ener1 SPB463048 battery schematic [17]... 34
F igure 25: B attery drain test results ... 34
Figure 26: Energy available per cell vs. Drain rate in C... 35
Figure 27: Energy available vs. discharge power ... 35
Figure 28: Constrained fuselage battery accommodation... 40
Figure 29: Endurance vs. battery weight fraction (baseline case)... 41
Figure 30: Endurance vs. battery cell count (baseline case) ... 41
F igure 31: F light speed vs. cell count... 43
Figure 32: Endurance vs. battery weight fraction, limited by SCL... 43
Figure 33: Endurance vs. battery cell count, limited by SCL ... 44
Figure 34: Efficiency trends for Proton 12-30-4000 motor [19] ... 44
Figure 35: Endurance tim e vs. cell count and voltage ... 45
Figure 36: Front w ing folding geom etry ... 46
Figure 37: R ear w ing folding geom etry ... 47
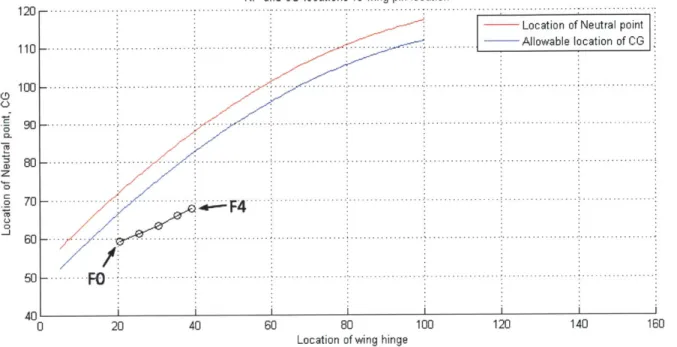
Figure 38: NP, CG, and wing hinge relationship configuration study... 49
Figure 39: Configuration study results - wing L/D vs.CG location ... 50
Figure 40: Packing densities of pUAV com ponents ... 51
F igure 42: Staggered battery pack ... 52
Figure 43: Fuselage with wing hinge placed at best wing L/D location... 53
Figure 44: Fuselage nose packing vertical projection... 54
Figure 45: F am ily of fuselage shapes... 54
Figure 46: Fuselage family with wing hinge, battery pack, and CG ... 55
Figure 47: NP and allowable CG; fuselage MFCG vs. wing hinge location... 56
Figure 48: Fuselage model F1 in the 'x l' open wind tunnel... 57
Figure 49: Fuselage m odel drag results ... 57
Figure 50: L/D of fuselages plus wing... 58
Figure 51: O ptim ized airfram e dim ensions... 59
Figure 52: Stow ed fuselage -side view ... 60
Figure 53: Finlets sized for deployment strikes ... 60
F igure 54: A SV 02 front w ing airfoil ... 61
F igure 55: A SV 10 rear w ing airfoil... 61
Figure 56: XFOIL polars of the ASV02 and ASV1O airfoils ... 62
Figure 57: Screenshot from X FLR 5... 62
Figure 58: XFLR5-predicted iUAV L/D Performance... 63
Figure 59: Predicted aircraft perform ance with altitude... 64
F igure 60: iU A V predicted speeds... 64
Figure 61: Comparison of small electric UAVs by altitude, weight, and endurance... 65
Figure 62: D ouble-scale flight m odel... 66
F ig u re 6 3 : 1X U A V ... 6 7 Figure 64: Free-pivot wind tunnel balance diagram ... 68
Figure 65: iUAV being tested in the wind tunnel... 69
Figure 66: IX iUAV suspended by wire in wind tunnel... 69
Figure 67: M easured perform ance of the [UAV ... 70
Figure 68: A SV 02 vs. inaccurate airfoil... 71
Figure 69: XFOIL investigations of the as-constructed airfoil... 71
Figure 70: Qualitative effect of nonlinear lift curve slopes to trim and performance... 72
Figure 71: ASV1O leadin g edge mill size incompatibility... 74
F igure 72: A SV 02 vs. T LR 2 airfoils ... 75
Figure 73: Leading edge of TLR2 and ASV02 airfoils and ball mill size... 75
Figure 74: TLR2 vs. ASV02 performance at Re=30,000, Ncrit=9... 76
Figure 75: TLR2 vs. ASV02 boundary layer performance at Re=30,000, Ncrit=9 ... 77
Figure 76: Kinematic shape parameter for ASV02 and TLR2 airfoils, Re=30,000, alpha=7.5 ... 77
Figure 77: TLR2 vs. ASV02 performance at Re=80,000, Ncrit=9... 78
Figure 78: TLR2 airfoil showing amplification ratio for Re extrena ... 79
Figure 79: Rear wing airfoils- ASV1O, TLR15, and TLR16... 79
Figure 80: TLR15 and ASV1O performance at Re=30,000, Ncrit=9... 80
Figure 81: TLR15 and ASV1O performance at Re=80,000, Ncrit=9... 80
Figure 82: TLR16 performance at Re=30,000 (dashed) and Re=80,000 (solid)... 81
Figure 83: CL VS. control position for the 1Xb in the wind tunnel... 82
Figure 85: XFLR5 model of 4UAV showing an elevator-up configuration... 84
Figure 86: Cin-alpha-elevator curves for the iUAV ... 85
Figure 87: Cin vs. V with elevator deflection at 30,000 ft ... 86
Figure 88: Longitudinal eigenvalues of 4UAV with varying altitude and elevator deflection... 87
Figure 89: Lateral eigenvalues of 4UAV with varying altitude and elevator deflection... 88
Figure 90: Spiral damping mode vs. speed and altitude ... 89
Figure 91: Fuselage shell features... 90
Figure 92: Front wing - fuselage integration showing forces acting on the fuselage shell... 91
Figure 93: Fuselage shock loading... 92
Figure 94: Fuselage shell fiber directions... 92
Figure 95: Fuselage molding process ... 93
Figure 96: Fuselage top shell mold... 94
Figure 97: Fuselage shell showing carbon fiber front wing mount ... 95
Figure 98: Front wing fairing... 95
Figure 99: Front wing upper features... 96
Figure 100: Front wing lower features... 96
Figure 101: W ing deployment mechanism ... 97
Figure 102: Front wing folding mechanism ... 98
Figure 103: 2-piece aluminum front wing molds... 98
Figure 104: W ing layup layers ... 99
Figure 105: Conceptual fiber direction for wing boss strength...100
Figure 106: Carbon fiber wrapping schem e for front wing fillet boss...100
Figure 107: Comparison of fabric thickness to airfoil leading edge ... 101
Figure 108: M old leading, trailing edge thicknesses...102
Figure 109: Comparison of wing profile to designed airfoil...102
Figure 110: Stacked front wings showing trailing edge deflection...103
Figure 111: Overview of rear wing features...104
Figure 112: Rear wing mechanism ... 105
Figure 113: W ing-fuselage stop features...105
Figure 114: Exploded view of rear wing mechanism ... 106
Figure 115: Cross-section of mechanism ... 107
Figure 116: SRDS control system...107
Figure 117: SRDS servo drive ... 108
Figure 118: Control surface deflection system ... 108
Figure 119: Elevon deflection vs. servo actuation angle ... 109
Figure 120: Layup layers of rear wing...109
Figure 121: Rear wing prototype with showing embedded Kevlar hinge ... 110
Figure 122: Elevon guideplate and wing hinge tubes...111
Figure 123: Full rear wing assembly ... 111
Figure 124: M otor cage with attached components ... 112
Figure 125: M otor cage acceleration loads...112
Figure 126: M otor cage fiber directions...113
Figure 128: Constructed prototype motor cage ... 115
Figure 129: Discharge capacity vs. discharge temperature for a lithium polymer battery [26]..116
Figure 130: Discharge curve of a 1.4 Ahr Lithium ion battery at 0.6 A [27]...117
Figure 131: Battery pack design ... 117
Figure 132: M old diagram of foam shell...118
Figure 133: Constructed propulsion system...119
Figure 134: Propeller limited in size due to envelope ... 120
Figure 135: JavaProp-generated propeller...120
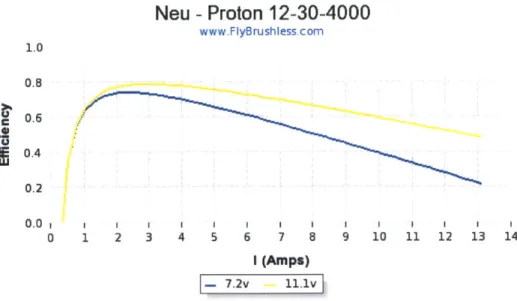
Figure 136: Neu Proton 012-30-4000 efficiency curves and operating point ... 121
Figure 137: Energy available vs. discharge power ... 121
Figure 138: Assembled aircraft in stowed configuration ... 122
Figure 139: Assembled aircraft in deployed configuration ... 122
Figure 140: M ajor protective case components...123
Figure 141: iUAV and case load forces...124
Figure 142: Cross-section of case- iUAV holding strategy ... 124
Figure 143: Protective case opening mechanisms ... 125
Figure 144: Right side locking tongue...125
Figure 145: M illed case end cap ... 126
Figure 146: Fully-assembled protective case, open ... 126
Figure 147: 4UAV inside protective case...127
Figure 148: Predicted 4UAV flight path ... 128
Figure 149: Predicted total speed vs. time...129
Figure 150: Predicted terminal speed ratio vs. time ... 130
Figure 151: Overview of the Integration and Testing Program ... 131
Figure 152: 4UAV package ejection shock test...132
Figure 153: In-lab deployment after ejection shock ... 133
Figure 154: 4UAV aerial deployment test platform ... 134
Figure 155: Composite photograph of deployment test ... 135
Nomenclature
LettersAR aspect ratio, b2/S
b wingspan
c chord
Cd 2-D profile drag coefficient
CD 3-D drag coefficient
CDA equivalent drag area; CDA = Sref CD at CD 1.0
C, 2-D lift coefficient
Cl/Cd 2-D airfoil lift-to-drag ratio CL 3-D lift coefficient
Cm pitching moment referenced to the chord of the main lifting wing, positive nose-lip
D drag
D* displacement thickness
R specific energy of battery
H or Hk shape parameter
LID 3-D lift-to-drag ratio
Ncrit critical boundary layer instability amplification ratio
Re chord Reynolds number
q dynamic pressure
W weight
V air speed
S area of main lifting or front wing St area of tail or rear wing
SM stability margin, as normalized to the front wing chord
t time in seconds
t/c airfoil thickness ratio
x/c normalized airfoil chordwise coordinate
XCG location of the center of gravity
Abbreviations
CG center of gravity
MFCG "maximum-forward CG", the most forward-possible CG location with a given external airframe geometry, found by placing all components as forward as possible
MRCG "maximum-rearward CG", the most rearward CG allowable given a set of stability constraints
OD outer diameter
SRDS sprung rotary drive system, used to control the elevons UAV unmanned aerial vehicle
iUAV micro-unmanned aerial vehicle, the topic of this paper #X aircraft #-scale size
Units
A amps
Ahr amp-hours
C degrees Celsius
C battery charge or discharge rate, as a multiplier of 1/hr to the cell's capacity
ft feet
G acceleration as a multiplier of Earth's gravitational constant, 9.81
-S2
in inches
(
")J joules
KTAS knots true air speed
lbf pounds force in meters mAh milliamp-hours mm millimeters N newtons s seconds V volts Whr watt-hours Symbols a angle of attack
Se elevator deflection, positive trailing-edge down. r7x energetic efficiency of component X
6 momentum thickness
Chapter 1: Introduction
In the past 10 years, the development in lithium-polymer batteries arid miniaturization of electronics hardware has led to the popularization of electric remote-controlled aircraft arid the development of many small unmanned aerial vehicles (UAVs) for recreational, research, aid military use. Small UAVs provide interesting arid powerful capabilities at low costs, but as designers continue to design UAVs to ever smaller envelopes and Reynolds numbers, they move into a design regime in which traditional design assumptions break down, and great care must be taken to balance design elements across multiple disciplines to ensure the creation of an efficient system.
This thesis presents the design, development, production, arid testing of a nicro-UAV
(henceforth referred to simply as the iUAV) system in just such a design space, characterized by the juncture of a highly-constrained envelope, low-Reynolds numbers, arid small scale composite structures.
The iUAV is designed to provide persistent atmospheric sampling capability at high altitudes (up to 30,000 ft) arid deploys from a countermeasure flare cartridge (less than 1.9" x 2.4" x 7.1"). The flare cartridge ejects the 1UAV package with an acceleration of 300G. The 1rUAV deploys
from its protective case mid-freefall arid flies for up to approximately one hour before descent arid disposal. This project started as a design problem in the fall 2010 Flight System
Engineering class, for which the author was the teaching assistant. At the conclusion of the class, the design effort was continued as the work presented in this thesis.
The iUAV was developed through a first-principles-based configuration trade-space analysis combined with the construction arid testing of many flight arid manufacturing prototypes. The result is a design that achieves unprecedented performance by placing arid using system
components to mutual advantage. As best known to the author, this problem is novel arid has never been resolved in the way described here within.
Much of the work presented in this document is the product of multiple iteration cycles. To create a semblance of order, the paper will forgo chronology in favor of thematic consistency.
Chapter 1 presents the mission background arid an analysis arid synthesis of detailed requirements.
Chapter 2 presents the main features of the pUAV, the protective case. Its purpose is to set the context for the following chapters, which describe the development arid detailed design of the system.
Chapter 3 presents the exploration of the configuration trade space arid the analysis that created the external lines of the aircraft wings arid fuselage.
Chapter 4 presents aerodynamic analysis and validation for the design created in Chapter 3. Wind tunnel tests, the development of a set of airfoils for the iUAV, and a second series of wind tunnel tests for the revised airframe are presented.
Chapter 5 presents the detailed design of structures and mechanisms as well as construction techniques.
Chapter 6 presents the design of the protective case and an ejection simulation.
Chapter 7 presents the system integration and testing efforts and results.
1.1. Mission Overview
The 4UAV is designed for a baseline mission that aims to study the atmosphere via multi-point real-time in-situ sampling. To accomplish this, a carrier aircraft ("mothership") ejects multiple 4UAVs (via the MJU-10/B flare cartridge) which would stay aloft as long as possible while collecting data in a predefined flight path. The 1UAV must also be able to station-keep the
winds-aloft. The mission concept is shown in Figure 1 below.
frocmW adWpbo
=-W mitpb
pah atfaw. aW -t-ace moitn am serc pa.mfter
Environwmental sensor
2(o5M
Zt. 5 kq
MT
Unooln-aa
---Figure 1: iUAV high-altitude mission [1]
The data collected is transmitted wirelessly in real-time to either ground station. Multiple 4UAVs are used to span a greater flight persistence, and for simultaneous inultipoint data collection. The recovered after use.
the mothership or a receiving area, to provide longer
UAVs are expendable and not
The baseline payload for the aircraft is an atmospheric sensing package which will measure temperature, pressure, and relative humidity at the iUAV's GPS-located position. The package weighs approximately 5 grams. Aside from the baseline mission, a secondary goal is to design the 4UAV to be compatible with other, larger payloads.
vmwmb
N
Goal: High-Altitude Persistence
1.1.1. Concept of Operations
A concept of operations was developed that splits the atmospheric sampling mission into seven phases, as illustrated in Figure 2 and described below.
Figure 2: Mission concept of operations
Phase 1: Ejection:
The iUAV package is ejected from the mothership by the MJU-10/B flare ejection charge. A switch on the case initiates the deployment timer which will open the case in Phase 3.
Phase 2: Freefall
The 4UAV package is oriented vertically by a drag device which slows the package down to its terminal velocity that is designed to coincide with the 4UAV's deployment speed as limited by the 4UAV's structure.
Phase 3: Deployment
The deployment timer triggers a servomechanism which opens the case from the bottom. The case is spring-loaded and opens to 180* to maximize drag. The case, now shaped like a bucket against the air, pulls away from the lower-drag iUAV, which accelerates downward away from the case. A switch powers on the 4UAV.
1. Ejection 2. Freefall ment 3. Deploy 4. Recovery 6. Descent 5. Data collection _6 7. Landing
The 4UAV may be tumbling due to the dynamic motion caused by interference with the case during opening. The 4UAV's aerodynamic surfaces deploy, and then the 4UAV must dampen out any initial tumble, which leaves the 4UAV pointing downwards.
Phase 4: Recovery
The 4UAV pulls up from its nose-down orientatioi, generating the maximum load factor the wings will experience. Using the oiboard IMU, the 4UAV stabilizes and levels, at which point the motor is activated. The iUAV flies level until the GPS signal is acquired. If a preset
maximum safety time has elapsed without GPS acquisition, the 4UAV will enter a failsafe mode and enter a stall to drop to the ground.
Phase 5: Data Collection
When the 4UAV's GPS location is found, it then flies in its predetermined pattern. The 4UAV samples data using its sensors aiid broadcasts its data to the receiving station on the ground or aboard the mothership via an omnidirectional antenna. In long-distance missions where the receiving station cannot receive data from all the iUAVs, the data may be "daisy-chain" relayed to the receiving station. If the 4UAV loses track of its GPS location or contact from the
receiving station, it will enter the failsafe mode.
Phase 6: Descent
Toward the end of the flight, when the battery voltage reaches its motor-cutoff voltage (approximately 2.5V per cell), the motor will be shut off aid the 4UAV will enter a glide. During this glide phase, the 4UAV continues to sample data aid transmit it back to the receiving station.
Phase 7: Landing
The 4UAV lands and is iot recovered after use.
1.1.2. Driving Requirements:
As described in Section 1.1.1 aid Section 1.1.2 above, there are four main driving requirements for the iUAV design:
1) Endurance - the goal of the jUAV is to maximize flight endurance.
2) High Altitude - the 4UAV must be capable of operating up to an altitude of 30,000 ft. 3) Deployment - the 4UAV system must be compatible with the size aid ejection forces of the
MJU-10/B flare cartridge.
4) Stability - the iUAV must be able to go from an unknown orientation aid rate of gyration into a stable flight configuration.
1.2.
Requirement Details
1.2.1.
High Altitude Environment
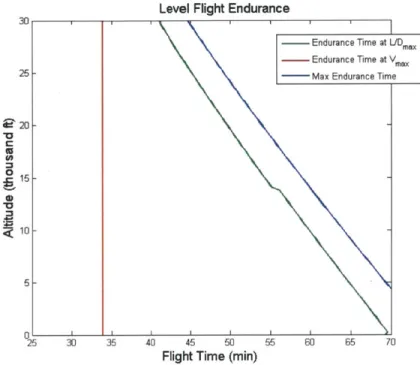
Because of the high altitude the 4UAV is carried and operated at, it must be designed to operate in cold temperatures. As illustrated by the red circle in Figure 3, the 4UAV system must operate at a minimum temperature of from -45'C at 30,000 ft.
3. 2. 1. 0. x 0emperature vs t tu e or a ar mop r 4 3 ... .. .. .. ... . . .. . . .. .. . 5 -... ---... --.-.-.--.-.-.... 5.... 5. -50 -40 -30 -20 Temperature, degrees C -10 0 10 20
Figure 3: Temperature vs. altitude (1976 Standard Atmosphere)
Because the 4UAV must at least be able to station-keep in ambient wind conditions, operating at 30,000 ft also introduces a speed capability requirement. Figure 4 below shows the average NOAA data collected above Edwards AFB for December, the month with the highest average wind speed. For the pUAV to remain useful during windy days, it must be capable of a forward flight speed of at least the mean wind speed shown below.
December Winds at Edwards AFB (NOAA data)
E 30,000 25,000 20,000 15,000 10,000 4 5,000- - -0 0 10 20 30 40 Speed (kts) 50 60 70 80
Figure 4: Wind speed vs. altitude for Edwards AFB [2]
A speed requirement of 58 knots (30 m/s) was selected for medium-cruise at 30,000 ft, where the standard air density is 0.459 kg/m". This cruise speed makes the 4UAV 14% faster than the average wind aloft, which allows the iUAV to recover from course deviations while staying within its efficient cruise range.
1.2.2. MJU-10/B Flare Cartridge
The 4UAV will be stored and ejected from the MJU-10/B flare countermeasure cartridge, which externally measures approximately 2" x 2.5" x8". This type of flare is commonly used on many types of military aircraft such as the C-17 Globemaster III and F-15 Eagle [3] as well as some research aircraft. A drawing and picture is shown in Figure 5 with the internal structure (not to scale) shown in Figure 6.
17 MW
L s
MVJ-(2.11 t~i)
FLARE, iNVRARED
COUNT RiT ASURE S. M-IJ-10/8 75374 *S%&M*.Y
LOI 1 NO
F
(a.09 IN)*1
A
Figure 5: MJU 10/B flare cartridge [4] Piston mchsm BBU-36/B Pyrotechnic cartridge 180 mm Direction of ejection
Figure 6: Schematic of flare cartridge system
As shown in Figure 6 above, the system envelope for the EiUAV (blue) is encased inside the shell (orange). The end is sealed with a cap (purple), crimped at the edges to keep it locked to the
shell. Ejection of the iUAV package is accomplished by the pyrotechnic cartridge (red) which pushes the 4UAV package via the piston mechanism (green).
The forces experienced by the iUAV package during deployment are severe. The compressive force required to open the cap is at minimum 125 lbf, and the acceleration experienced during ejection is approximately 300 G, which yields ar exit speed of approximately 55 mph.
The MJU-10/B flare cartridge also sets the maximum system envelope for the 4UAV package, as shown in Figure 7 below. The maximum dimensions are 48mm x 62mm x 180mm with a 3.175mm corner fillet. R 3.175 mm R 0.125 in 62 mm 2.44 in -48 mm 1.89 in -1
Figure 7: Available system envelope
1.2.3. Stability
The mid-air deployment creates a requirement that the aircraft must be passively stable in pitch and yaw so that it is capable of recovering from an initial tumble.
1.3.
Requirements Compared to Other UAV Systems
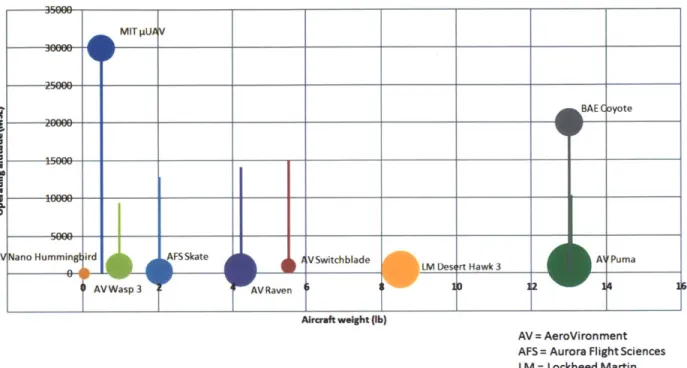
A review was conducted to compare the system requirements of the proposed 4UAV to other current small electric UAVs that are either in development or used in the field [5]. The results
are plotted below in Figure 8. Data is collected from only publically-available specifications and articles, so this review is not expected to be complete.
Survey of small electric UAVs : endurance, altitude range, vs weight
Aircraft weight (Ib)
AV = AeroVironment AFS = Aurora Flight Sciences
LM = Lockheed Martin BAE = BAE Systems
Figure 8: Required performance vs. survey of current small UAVs
In Figure 8 above, each circle represents a UAV system and is plotted by weight and typical mission altitude. The size of the circle represents the endurance of the aircraft, and the line protruding from the dot spans the standard altitude range in which the aircraft can operate. The altitude range lines for the AeroVironment Nano Hummingbird and Lockheed Martin Desert Hawk 3 are obscured by their endurance circles.
As shown in Figure 8, the aircraft with the longest endurance, the AeroVironment (AV) Raven [6] and Puma [7][8] and the Lockheed Martin Desert Hawk 3 [9], typically fly at low altitudes to achieve their long endurance performance. Three aircraft, the AV Nano Hummingbird[10], AV Wasp III [11], and Aurora Flight Sciences Skate [12] are within the weight range specified for the 4UAV. Two of these UAVs, the AV Switchblade [13] and BAE Systems Coyote [14], have folding tandem configurations. The small and folding UAVs have significantly less endurance than the Raven, Puma, and Desert Hawk.
The requirements for the [UAV system cover a traditionally-unexplored portion of the design space due to the combination of high altitude, small package size and weight, and maximum endurance requirements.
Chapter 2:
tUAV System
This chapter describes the major design features of the 4UAV to establish the framework for the. analysis presented in later chapters.
2.1.
Overview
The iUAV system is together in Figure 9.
composed of two components The streamer attached to the
- the aircraft and its protective case, shown back of the protective case is not shown.
Figure 9: Aircraft and case stowed (left) and deployed (right)
The case shown in Figure 10 protects the 4UAV from the compressive burst-force and the high wind-speed forces at ejection. The rear end (hinge plate) part of the case also provides an attachment point for the 1.5-meter long drag streamer, which slows the pUAV to a safe speed before the wings are opened. The case and aircraft together are referred to as the "pUAV package." The 4UAV package is ejected from the flare cartridge with the UAV pointed backwards, as shown in Figure 10.
Direction of ejection
Figure 10: tUAV and case package
The iUAV has a tandem-wing, pusher-propeller configuration. The external features are shown in Figure 11 below.
Figure 11: Overview of tUAV external features
Both front and rear wings are of carbon-fiber composite construction and employ a series of custom airfoils designed for low-Reynolds number. Both wings are spring-loaded; the front wings fold backwards and the rear wings fold forwards the stowed configuration. The rear wing houses the elevon control surfaces inboard and has "finlet" vertical surfaces on the tips for lateral stability. To control the jiUAV's pitch, the elevons are deflected in the same direction, and to control its roll, the elevons are deflected in opposite directions. From the region just outboard of the elevons to the start of the finlets, the wing has a section of slight dihedral.
The fuselage is designed for low-drag and to place the CG (center of gravity) forward and is constructed from a Kevlar-composite shell. Two holes are placed near the nose to provide
total-energy and static sensing ports for the autopilot and atmospheric sensing payload. The section of the fuselage above the front wings is flexible and acts as a fairing.
The internal features of the iUAV are shown in Figure 12.
Autopilot
Propulsion,
hh control system
Payload
Battery pack
Figure 12: Overview of iUAV internal features
As shown in Figure 12, the 4UAV houses a large battery pack, placed toward the front of the fuselage to place the CG forward. The batteries arranged in a staggered stack and encased inl a shock-dampening and insulating foam shell. Nine cells, arranged inl a 3-series, 3-parallel
configuration provide a nominal capacity of 2100 mAh at 11.1 V. At the right-front corner of the fuselage is the atmospheric sensing payload. To either side of the battery pack, the front wing hinge and folding mechanisms are housed. At the rear of the battery pack, inside the foam shell, is the electronic speed controller (ESC).
The autopilot board, which also houses the GPS, IMU, and communications radio, is mounted at the rear-top of the fuselage. Below the autopilot board are the motor and propeller shaft, the control mechanisms, and the rear wing deployment mechanism. The motor is a NeuMotors Proton 12-30-4000, and the control mechanisms employ two Hitec HS-35HD servos. The autopilot, motor, and servos are attached to a central assembly constructed from carbon fiber called the "motor cage" which also reinforces the fuselage shell. The servos drive the elevons through a variant of the "rotary drive system" or RDS control system used on some remote-controlled gliders
1151.
The switch that powers on the 4UAV during deployment is located on the bottom of the fuselage.The iUAV weighs 220 grams and is 168 mm (6.6 in) in length with a wingspan of 301 mm (11.8 in).
2.2.
Extended Payload
By reducing the number of battery cells from 9 to 6, it is possible to use a different packing configuration to greatly increase the available payload volume to approximately 32 mm x 32 mm x 43 mim.
Payload volume
Figure 13: Maximum-payload configuration
Reducing the battery size to 67% of the original size decreases the endurance to approximately 63% due to the increased losses in the power system. For this configuration to be viable, the payload needs to be dense enough to place the CG location at the same point as the standard mission.
2.3.
Autopilot
The small dimensions of the 4UAV fuselage necessitated the development of a custom autopilot system, as no commercial units could provide a processor, GPS, communications radio, and servo controls in a package sufficiently small to fit inside the vehicle while leaving sufficient
room for other aircraft components. The hardware and software development is conducted by MIT Lincoln Laboratory and is not covered in detail in this thesis. The current version of the custom autopilot is shown in Figure 14.
Bottom
2.4.
Folding and Deployment
To fit in the protective case, the 1UAV's wings fold 90 degrees and align with the fuselage.
With the wings folded, the iUAV is referred to be in the "stowed configuration" and with the wings deployed, it is referred to be in the "flight configuration". Both wings are spring-loaded and, without a restraining force, automatically open to the flight configuration.
Stowed, mid-transition, and flight configurations are shown in Figure 15 below. When the aircraft is in the stowed configuration, the fairing on the top deforms and deflects upward so that the wings are stored underneath it.
Figure 15: LUAV wing folding
The front wings fold with some overlap of the trailing edges, as shown in Figure 16. This design feature is due to the fact that low-Reynolds aerodynamics is best negotiated with thin airfoils, and the trailing edges can be made to be flexible. When the front wings enter the stowed configuration, their trailing edges flex and locally stack, generating 10 mm of overlap. This is the maximum amount of overlap possible without adding significantly to the thickness of the wing stack.
Fuselage
Fuselage
Figure 16: Front wing overlap and flexure
Since the leading edges instead of the trailing edges of the rear wings meet together, the rear wings cannot have the same overlap feature; instead, the rear wings share a coaxial hinge and are stacked vertically, as shown in Figure 17. Figure 18 shows the swinging motion of the wings.
The right wing is colored blue and the left wing is colored red for clarity. The finlets fold in front of the nose in the stowed configuration.
Figure 17: Rear wing stacking
Figure 18: Rear wing folding
When the 4UAV's wings are folded, the iUAV fits inside the protective case, sized to fit inside the flare cartridge. A side-view of the stowed 4UAV inside the protective case is shown in
Figure 19 below (some components hidden for clarity). The available vertical space is completely occupied.
Figure 19: Stowed configuration, side projection
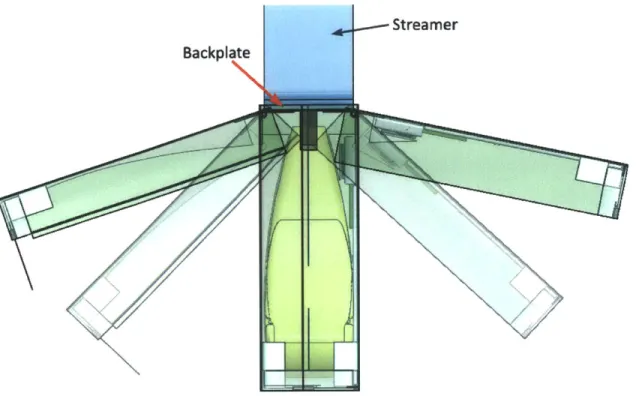
The protective case is composed of three main physical groups: two sides and a backplate. Figure 20 illustrates the geometry of the case opening.
...-
Streamer
Backplate
Figure 20: Protective case opening
Shown in Figure 20, the backplate, which holds onto the tail end of the 4UAV, is also attached to the streamer. The right and left sides are hinged to the backplate and are spring-loaded. The components inside the case are placed to avoid interfering with the iUAV during deployment.
A 3-view of the 4UAV and the protective case is shown in the expanded 3-view in Figure 21 below.
J
Figure 21: Expanded 3-view of LUAV
30/143
Q
K
Chapter 3: Sizing and Configuration Design
This chapter presents the design of the iUAV's wings, fuselage, and basic internal configuration. Designing a inaximumirn-endurance folding aircraft requires the consideration of not only the equations the govern flight energy, power, and stability, but the interactions between the system envelope, the stowed geometry, and the flight geometry. The envelope sets a limit oni maximum component size, and the swinging configuration couples the chordwise and spanwise geometries.
The dimensionally-conrstrained envelope is handled by a four-step process. First, the performance equations are analyzed to optimize the aircraft size and battery configuration for endurance. Second, a continuous configuration-space is mapped by relating the location of possible wing hinge points to the planformn areas. Doing so allows determination of the relationship between wing performance and allowable CG location. Third, a general internal packing scheme is developed to place the CG toward the region of the design space that maximizes performance. Fourth, a series of fuselage candidates are studied to generate a space that links CG location, drag, and available wing hinge location. The final design is created from the intersection of the trends of the wing performance and fuselage performance spaces. This design best-combines wing performance and fuselage geometry into a configuration that yields the best total performance.
To derive the performance equations and to design the configuration, it is first necessary to consider the characteristics of electrical propulsion and their effects on aircraft geometry.
3.1.
Electric Propulsion Design Considerations
Due to the small system size and cold-start requirement, an electrical propulsion system was selected for the tUAV. Electrical propulsion systems are composed of three main components arrange in Figure 22 below) - the battery, the electronic speed control (ESC), and the motor.
Throttle signal
DCcurrent
AC synchronous current
Power
Figure 22: Electrical propulsion system layout
The battery supplies constant DC electrical power to the ESC, which reads the throttle setting provided by the control unit, either an RC receiver or autopilot, in servo encoding. The size of the ESC, motor, and propeller scale directly with the power the system has to output.
Using an electrical propulsion system has several consequences on the way the iUAV must be designed. First, unlike liquid fuel systems, the weight of an electrical propulsion system does not change as energy is depleted. This means that the aircraft must carry the weight of the entire energy system throughout the mission, and increasing energy capacity beyond a certain point becomes detrimental to endurance, as will be discussed in detail in Section 3.2. Another
consequence of constant battery weight is that the batteries may be placed strategically to place the center of gravity (CG) of the aircraft, unlike in liquid-fueled aircraft where the fuel tanks
need to be placed to avoid unfavorable CG shifts throughout the mission.
Second, the volumetric density of batteries is far less than traditional petroleum-based fuels even accounting for the efficiency of the energy delivery system. Therefore, the relation between fuselage drag to energy capacity is far stronger than in liquid-fueled aircraft.
Third, unlike a liquid fuel, battery voltage, capacity, and dimensions are quantized to specific units produced by battery manufacturers, so the design of the power system requires a discrete study of available batteries and physical configurations.
Fourth, a battery's useful capacity decreases the faster it is discharged, or can be discharged. There are two components to this correlation. First, in operation, a reduction in useful capacity is due to the battery's internal resistance - higher current through the battery will cause more energy to be lost as heat via Ohm's law. Second, designing a higher-current battery reduces the
amount of energy it can hold as there is a trade-off between specific power and specific energy. This relationship can be summed in a Ragone plot, as shown in Figure 23 below.
100 il
10
10 10 10 3 10
Specific Power (W/kg)
Figure 23: Ragone plot showing specific energy vs. specific power [161
The curves in Figure 23 show that the trade-off between specific energy and specific power is monotonically negative. Using a battery with higher specific power will always entail losing specific energy. As practical examples, batteries created for remote-controlled airplanes or cars sacrifice energy density for higher power density, and batteries in smart phones tend toward the opposite, yielding batteries that perform poorly if drawn at high rates, but have high specific energies at low draw rates. As a result of the internal resistance and the Ragone trend, it is desirable to match the power output of the battery to the requirements of the vehicle, and to not design in any more power capacity as is necessary, such that the highest energy density can
be achieved, yielding the greatest flight time.
Figure 23 also shows the reason lithium-ion (or polymer) batteries are the best choice for aircraft performance, as it has the best specific energy and specific power in the region of interest, above the 0.1h oblique line.
The Eneri Korea SPB463048 lithium polymer battery was selected for the IUAV for its high volumetric and gravimetric energy density, at 391 Whr/L and 192 Whr/kg, and for its dimensions, which allows an efficient packing scheme. The nominal voltage and capacity are 3.7V and 700 mAh, respectively, yielding a nominal capacity of 2.59 Whr. The rated maximum draw rate is 2C, or 30 minutes. [171 A schematic of the battery is presented in Figure 24.
4.0±0.1
-H 0
4.0±0.1
Figure 24: Ener1 SPB463048 battery schematic [17]
Battery testing was conducted to verify the cell's performance at room temperature. Using a battery tester, the cell was discharged at a constant draw rate of 0.5C to 2C and the voltage was measured until the voltage cutoff was reached at 2.8 V. Data from a typical cell is shown in Figure 25 below. 0.5 C: 3.7V, 2.62 Whr 1.0 C : 3.6V, 2.49 Whr 4,0 1.5 C : 3.5V, 2.40 Whr 2.0 C : 3.4V, 2.22 Whr 3.40 3.30 y 3,20-310 3.00 2.90 2.70 2.60 2.50 240 2.30 2.20 210 2.00 1.90 120 2.60@~
Figure 25: Battery drain test results
0-1±0.01
The data in Figure 25 shows that at a low draw rate (0.5 C), the battery performance matches the claimed specification, with an average voltage of 3.7 V and an energy capacity of 2.62 Whr. As the draw rate is increased, the energy-available drops linearly, as shown in Figure 26, which plots the energy available per cell against the drain rate in C.
Energy available per cell vs drain rate
2.65 2.6 2.55 2.5 2.4 2.35 2.25 2.2 2.15 0 0 1 1rt 2 5 Drain rate (C)
Figure 26: Energy available per cell vs. Drain rate in C The energy-available
below.
can also be plotted against the discharge power, which produces Figure 27
Figure 27: Energy available vs. discharge power
Energy vs discharge power
27 2.65 2.6 2 5y= -0.1275x+ 2 798Jb 2.45 R2 =0 9663
8,24
~2.35
23 2.25 22 --2.15 0 0.5 1 1.5 2 2.5 3 3.5 4 4.5 5 Power (W)3.2.
Endurance-Performance Relations
In this section, the equations of flight forces and energy are analyzed to synthesize an equation that relates aircraft endurance to its geometric and aerodynamic qualities. By making reasonable assumptions about these qualities, insight is gained into the aircraft configuration design space, aid the battery size is selected.
3.2.1.
Endurance Equation Formulation
The endurance derivation starts with the governing equations of flight forces and energy. The dynamic pressure (Eq. 3.1), lift (Eq. 3.2) aid drag (Eq. 3.3) equations for steady level flight are defined below.
q = pV2 Eq. 3.1
W = L = qSCL Eq. 3.2
T = D = qSCD Eq. 3.3
The drag equation (Eq. 3.3) is broken down into four main contributions - the CDA, or
equivalent drag area of the fuselage, the area, S, and drag coefficient, CD, of the main wing and tail, aid the induced drag in producing lift. The expression for induced drag assumes that the front wing is providing nearly all the lift, and the induced drag of the tail is negligible in
comparison. In a tandem configuration, the front wing is the main wing and the rear wing is the tail, even though both are producing lift. The resulting equation Eq. 3.4 is shown below.
D = q(CDA + SCdw + StCdt) + qS e L Eq. 3.4
rreAREq3.
By substituting the lift coefficient relation (Eq. 3.5) and definition of aspect ratio (Eq. 3.6) into the drag equation (Eq. 3.4), the induced drag is expressed as the result of the square of the span loading of the main lifting wing (Eq. 3.7).
CL 2W Eq. 3.5
pV2S
AR = Eq. 3.6
S
D = q(CDA + SCdw + StCdt) + W 2 Eq. 3.7
Using a rough scaling relationship, Kt (defined in Eq. 3.8), it is possible to approximate the relative drag sizes between the rear and front aerodynamic surfaces in Eq. 3.9. As
approximations, Kt = 0.3 for a conventional aircraft, and Kt = 1 for a tandem-wing configuration.
Kt= CdtSt Eq. 3.8
D = q(CDA+ SCd,(1+ K,)) + " Eq. 3.9 The product of the flight drag with the speed is the power-required for steady level flight, as shown in Eq. 3.10.
Pf light = DV = (q(CDA + SCdw(1 + Kt)) + w V Eq. 3.10 The propulsive power can be related to the power required from the battery via power system efficiencies in Eq. 3.11. Setting the propulsive power equal to the flight power (Eq. 3.12), the battery power is related to the variables that compose flight power (Eq. 3.13).
Ppropulsive = nESC?motor?propeller Pbattery Eq. 3.11
Ppropulsive = Pflight Eq. 3.12
Pbattery = q(CDA + SCd (1 + Kt)) + W2 V Eq. 3.13
77ESC7motor~lprop G~ieb2
The battery's energy can be related to its weight by the battery's specific energy, here denoted as E, shown in Eq. 3.14. When operating at a temperature that would reduce battery
performance, it is necessary to reduce R to account for the loss in capacity. At room
temperature, a typical P value for average lithium-polymer batteries is 16.5 Whr/N or 59,400
J/N.
Ebattery = WbatteryE Eq. 3.14
The available energy divided by draw rate is the endurance of the vehicle in Eq. 3.15:
tendurance - Ebattery WbatteryE Eq. 3.15
Pbattery 7 ESCvmotorvprop q(CDA+SCv,(1+KtB+
eb2 E
To relate the weight of the battery with the weight of the aircraft, the weight of the aircraft is broken into four categories based on its role in the system: the payload, the power throughput components (motor, ESC, and propeller), the airframe, and the battery (Eq. 3.16). The autopilot board is considered part of the payload.
W = Wpayload + WmotorESCprop + Wairframe + Wbattery Eq. 3.16
By dividing each component weight by the total aircraft weight (Eq. 3.17), the aircraft is broken into weight fractions (Eq. 3.18). The weight of the battery (Eq. 3.19) and payload (Eq. 3.20) are thus related to the aircraft weight.
= Wpayload + WmotorESCprop +Wairframe 4 Wbattery Eq. 3.17
W W W W W
Wbattery = fbatteryW
W = Wpayload/fpayload Eq. 3.20
Weight fractions (Eq. 3.20 and Eq. 3.19) and the lift equation (Eq. 3.2) are substituted into Eq. 3.15, which is then inverted to group the variables. The result is Eq. 3.21, shown below. To maximize endurance, the expression on the right side of the equation should be minimized.
1
tendurance
V (Cdw (1+Kt) + qCDA Wpayload Eq. 3.21
?7ESC?7motor7propellerE kCL fbattery Wbattery qb 2 efbatteryfpayload/
Eq. 3.21 reveals the relations between various aircraft characteristics and the effects they have on the aircraft performance.
The first grouping V/(ESCTImotor7Ipropeller-) has units of 1/seconds, and the three terms inside
the parentheses are nondimensional. This first group scales endurance to the characteristics of the power system. To maximize endurance, the iUAV should fly as slowly as the mission requirements allow and should use the most efficient propulsion system available. The iUAV should also maximize the specific energy of the battery.
The first term in the parentheses of Eq. 3.21 is effectively the endurance as related to the profile drag of the wings. Assuming the 2-D lift coefficient is roughly equal to the 3-D lift coefficient, the term can be rewritten as Eq. 3.22 below. This relationship shows that, to maximize
endurance, the airfoil glide ratio at the cruise point should be maximized. This term also shows that ideally, the tail should be small and the battery weight fraction should be maximized.
Cdw (1+Kt) (Ci\j' (1+Kt) Eq. 3.22
CL fbattery Cd fbattery
The second parenthetical term of Eq. 3.21 describes the energetic loss due to the fuselage's drag on endurance, normalized by the weight of the battery. All three variables, q, CDA, and
Wbattery, and the way they interact must be considered such that adding more battery does not reduce performance through large fuselage drag and/or higher flight speed which can easily outweigh the increased battery energy.
The third parenthetical term of Eq. 3.21 describes the induced drag and is affected by the span of the main lifting surface squared. To maximize endurance, the span loading should be
minimized. This term also serves the purpose of linking the aircraft size to the payload size. While the first parenthetical term describes the wing performance and its relation to battery weight fraction and the second parenthetical term describes the ratio between fuselage drag and the contained-volume, it is only the third parenthetical term that links the size of the aircraft to the weight of the payload and thus sizes the aircraft for the mission.
Endurance Maximization Baseline
To quantitatively explore these relations, Eq. 3.21 is plotted (in Figure 29 and Figure 30) with the following assumptions and inputs. The following assumptions and equation parameters makes up the "baseline" case:
1) Because the mission goal is mainly high-altitude flight, p is set to be standard density at 30,000 ft.
2) As set by the mission requirements (Sectioil.2.1), the aircraft flies at 30 rn/s.
3) The mass of the payload (sensor package and autopilot combined) is assumed to be 20 grams.
4) The mass of the power delivery system (motor, ESC, and propeller) is assumed to be 25 grams.
5) The mass of the airframe (including servos and internal structure) is assumed to be 80 grams.
6) Each battery cell is assumed to weigh 13.5 grams (the weight of the Ener1 SPB463048 cell). 7) From a battery discharge test conducted at -20'C, it is found that the useful battery
capacity drops to approximately 75% of the nominal specification [2]. The SPB463048 (with a nominal specific energy of 70,404 J/N) is therefore discounted to 52,803 J/N.
8) The efficiency of the ESC, 7ESC, is assumed to be 90% .This is true for when throttle is above 50% [18].
9) The efficiency of the motor is rimotor = 75% [19]
10) The efficiency of the propeller is assuried to be riprop = 70% [20]. 11) The wingspan of the main lifting surface is 0.3rn.
12) The airfoil is assumed to perform with Cl/Cd = 30. This 2-D glide ratio is achieved at Ci = 1.0.
13) The aircraft configuration is assumed to be a tandem wing, resulting in Kt = 1. 3.2.2.
14) A rough empirical fit to an initial set of wind tunnel tests for rectangular-cross-section fuselages at approximately 50 angle of attack was used to determine the relationship between
CDA and Wbattery. The drag of the fuselage, rather than rising linearly with cross-sectional
area, rises with the square due to the constrained fuselage length, which disallows a minimum-drag pressure recovery profile. Figure 28 below shows the vertical projection shapes for a family of fuselages, sized to contain the required number of batteries as indicated by color.
15 cells 9 cells
6-cell battery pack 6 cells
Figure 28: Constrained fuselage battery accommodation
This relation fitted to the wind tunnel tests is shown in Eq. 3.23 below with CDA in m2 and
Wbattery in N.
CDA = 0.0003 + 0.00015 * W2attery Eq. 3.23
The relationship generates a CD from 0.1 (zero batteries) to 0.2 (when the fuselage is filled with 15 cells) with reference to the cross-sectional area of the envelope (62 mm x 48 mm).
The analysis is conducted by varying the number of battery cells under the assumptions listed above. Initially, the cell configuration (series and parallel cell arrangement) is neglected. The results for this baseline case are presented below with endurance vs. battery weight fraction in Figure 29 and endurance vs. battery cell count in Figure 30. Because the number of battery cells is quantized, each node represents a possible solution with a whole number of battery cells.