Delinking Economic Development and Mass Incarceration: Imagining New
Futures for Rural Communities
by
Insiyah Mohammad Bergeron Bachelor of Arts, Bennington College (VT)
Submitted to the Department of Urban Studies and Planning in partial fulfillment of the requirements for the degree of
Master in City Planning at the
MASSACHUSETTS INSTITUTE OF TECHNOLOGY June 2017
© 2017 Insiyah Mohammad Bergeron. All rights reserved.
The author hereby grants to MIT permission to reproduce and to distribute publicly paper and electronic copies of this thesis document in whole or in
part in any medium now known or hereafter created.
Author_______________________________________________________________________ Insiyah Mohammad Bergeron Department of Urban Studies and Planning May 18, 2016 Certified by___________________________________________________________________ Karl Seidman Senior Lecturer Thesis Supervisor Accepted by__________________________________________________________________ P. Christopher Zegras Associate Professor Chair, MCP Committee
Delinking Economic Development and Mass Incarceration: Imagining New
Futures for Rural Communities
By
Insiyah Mohammad Bergeron
Submitted to the Department of Urban Studies and Planning on May 24, 2017, in partial fulfillment of the
requirements for the degree of Master in City Planning
Abstract:
Until recently, prisons were considered an economic development strategy particularly in rural communities struggling with the loss of manufacturing jobs. However, many studies have shown that prisons often have weak linkages to the host community, and sometimes have negligible or even negative impacts on rural economies. A combination of factors including changing
sentencing laws, inadequate conditions in older facilities, fiscal conservatism, and increasing reliance on community based alternatives to incarceration are now leading to prison closures all around the country. In this changing context, this thesis explores: (i) What are the real and
perceived impacts of prison closures on local economies in small rural counties?; and (ii) Where communities are redeveloping old prisons to boost their economies, how are local needs, politics, and project constraints (related to design and finance) shaping the transformation of these sites? By focusing on two cases where former prisons are being reused for community
and economic development, this thesis explores how rural communities might transition to new ways of employing people and generating wealth after a local prison closes.
Thesis Advisor: Karl Seidman Reader: Justin Steil
Acknowledgements
The last two years have been spectacular. I came to DUSP overwhelmed by the all the new things that I found myself navigating at once: a new marriage, a new city, and a new
professional field. I feel so lucky to have built a community at DUSP that has supported me in this beautiful, fulfilling, and at times, chaotic journey.
Thank you to members of my thesis committee, who I endlessly respect and admire. Karl Seidman, I have been so grateful to have you as a mentor. This work is so much stronger because of your thorough and thoughtful feedback. Thank you for providing clarity and honesty whenever I have felt stuck or muddled. Justin Steil, thank you for encouraging me to pursue this idea early on and for your supportive feedback as I got closer to the finish line.
Thank you to my collaborators in the field: Noran Sanford and Jim Mraz. You have been wonderful hosts and thought-partners. Thank you for helping me with this academic exercise, and for introducing me to your brilliant partners and supporters. I wish you so much success as you take on these challenging and rewarding projects.
Thank you to my DUSP family. Rachel, Kelly, Alaa, Sonja, and Fay, I am so honored to have been in a thesis group with you. Your love, support and kindness kept me going in the difficult times. Anna and Elaine, thank you for helping me work through my ideas. I have immensely enjoyed learning about your projects and finding the connections in our work.
Thank you Mama, Abu, Asad and Farah. Your trust and support mean the world to me. You keep me honest, sane and grounded.
And, finally, thank you Tom, for pushing me to apply to graduate school and encouraging me to make the most of my time here. You are my favorite person to brainstorm and construct big ideas with. I am excited for our next chapter.
Contents
1. Introduction………5 1.1 Seeing prison closures through an economic development lens
1.2 Literature review: The link between economic development and mass incarceration
2. Understanding Two Contexts: Fulton County, NY and Scotland County, NC…………..12 3. Impact of Prison Closure on Rural Communities……….18
3.1 Fulton County, NY
3.1.1 Prison construction and closure in New York 3.1.2 The troubling history of Tryon
3.1.3 Contextualizing prison jobs in Fulton County
3.1.4 Impact of prison closure on Fulton County’s economy 3.2 Scotland County, NC
3.2.1 Prison construction and closures in North Carolina 3.2.2 Contextualizing prison jobs in Scotland County
3.2.3 One closes, another opens: Impact of prisons on Scotland County’s economy
4. Prison Redevelopment……….37 4.1 Tryon Technology Park, NY
4.2 GrowingChange, NC 4.3 Comparing the two cases
5. Imagining New Futures for Rural Communities With Closed Prisons………65 References………...………...………..71
CHAPTER 1: Introduction
1.1 Seeing Prison Closures Through an Economic Development Lens
Since the early 1970s, more than six hundred prisons have been built in the U.S. “Three strikes" laws1 and mandatory minimum sentences for drug offenses flooded incarceration facilities with people, prompting states to build more to avoid overcrowding. While mass incarceration in the United States continues to be a critical issue, some communities are now, sometimes
simultaneously, grappling with a new kind of problem: prison closures.
A variety of factors, often in combination, are influencing these closures including changing laws around sentencing, inadequate conditions in facilities, states downsizing corrections funding and increasing reliance on community based alternatives to incarceration. According to a report by the Sentencing Project, seventeen states announced the closures of seventy prisons around the country between 2011 and 2013. In New York State alone, sixteen adult prisons and thirty juvenile prisons have been closed since 2009. North Carolina similarly has at least twenty-five decommissioned incarceration facilities scattered throughout the state.
Prison closures have been getting some attention recently, particularly since there is a perception that many rural economies with these facilities are heavily dependent on them for local jobs. However there is also emerging evidence that prisons have not contributed as much to local economies as was hoped, suggesting that these closures, especially in isolation, may not have the devastating impacts that are often publicized.
Since many prison campuses are currently vacant around the country, and more facilities are expected to close as criminal justice reform increasingly becomes a bipartisan issue, this thesis explores the following questions: (i) What are the real and perceived impacts of prison closures
on local economies in small rural counties?; (ii) Where communities are redeveloping old prisons to boost their economies, how are local needs, politics, and project constraints (related to design and finance) shaping the transformation of these sites.
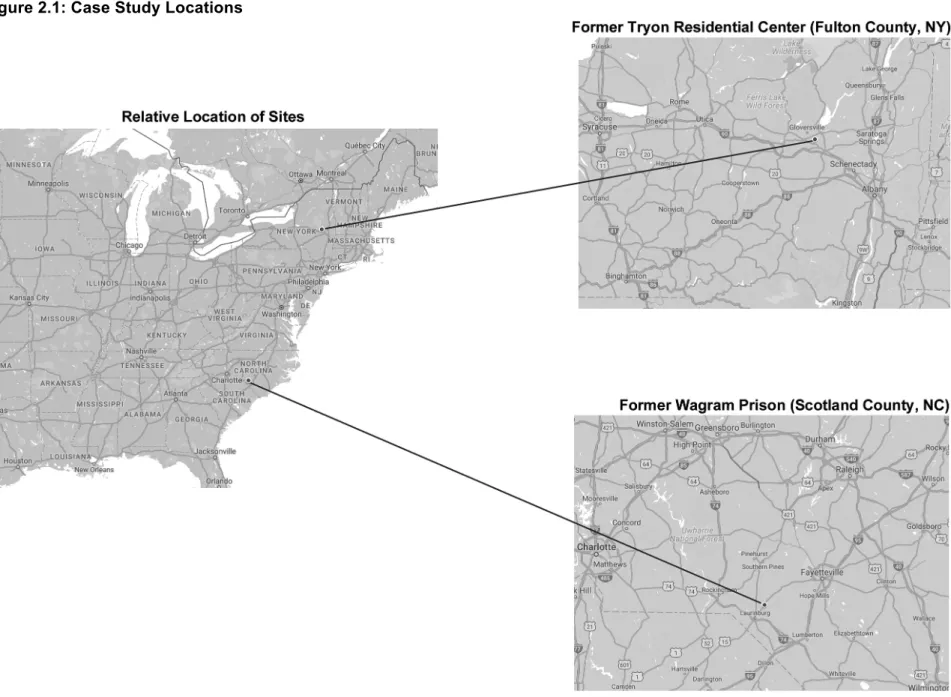
I used a comparative case study approach to research the above questions in two communities: Fulton County, NY and Scotland County, NC. Both places have experienced a correctional
1 These laws, enacted on the state and federal levels, limited judicial discretion by mandating life sentences for anyone convicted for a serious violent crime (including drug offenses) with two or more prior convictions.
facility closure since the year 2000, and are using different approaches to utilizing local physical, financial and community assets to redevelop the former prison sites.
I chose to compare the two projects in Scotland County and Fulton County because they are both in predominantly rural communities, a factor that places constraints on redevelopment. However, the two communities are different in ways that are also important to consider.
Scotland County, NC has a poverty rate of 29.0%, which is the highest in the state (the national poverty rate is 13.5% for comparison). The median income in the area is $30,958, compared to $53,889 nationally. Fulton County, NY is comparatively a wealthier rural community with a median household income of $46,969 and a poverty rate of 17.9%. The two communities also have very different racial compositions. While 95.2% of the population in Fulton County
identifies as ‘white alone’, only 46.1% of the population falls in this category in Scotland County.
In addition to these basic demographic differences, the two communities are also taking
radically different approaches to redeveloping their former prison sites. In Scotland County, NC, a grassroots organization, GrowingChange—which consists of formerly incarcerated youth, farming enthusiasts, criminal justice stakeholders, and military veterans—is leading
redevelopment. The site plans include spaces for farming, sound design, museum exhibits, climbing walls, and vocational training. The state’s Department of Public Safety is an important partner in this work, and nearby educational institutions are providing technical assistance with site redesign and youth programming.
In contrast, the redevelopment in Fulton County is being led by local and regional economic development stakeholders, with some financial assistance from the state government. In New York, state funding has been earmarked to assist local communities that have experienced a prison closure. For instance, $32 million was allocated to assist four communities that
experienced a prison closure in 2014, through the state’s Economic Transformation Program which aims to “create or retain jobs, prevent, reduce or eliminate unemployment or
underemployment, or increase business activity in an Economic Transformation Area” (Economic Transformation Program Fact Sheet, 2014). In Fulton County, local economic development stakeholders were able to appropriate over $2 million in state funds to transform the former prison into a technology park, where one of the first occupants is a company that manufactures medical cannabis products.
Through conducting twenty-three interviews with local stakeholders, and exploring newspaper articles, historical archives, and economic and demographic data, I attempted to gauge the real and perceived economic impacts of prison closures on these two counties. I also used these resources to understand how redevelopment of the former prison sites is taking place in these two contexts. Specifically, I was interested in the goals of the stakeholders who are supporting these projects, and the assets and challenges shaping redevelopment in each context.
Ultimately I was curious to know if, and how, communities can disentangle the complex relationship between economic development and mass incarceration, and transition to other ways of employing people and generating wealth after a local prison closes.
1.2 Literature Review: The Link Between Economic Development and Mass
Incarceration
At the beginning of the twenty first century there were 1,023 prisons nationwide, almost double the number that had existed in 1974 (Glasmeier and Farrigan, 2007). Enforcement of harsh sentencing laws led to sharp increases in state prison populations, and many towns, particularly in rural areas, saw this as an economic development opportunity. Communities that had few prospects for economic growth otherwise strove to make themselves attractive for the siting of a prison. This included offering incentives like infrastructure subsidies and land free of cost. Some communities even expended precious tax dollars to construct prisons themselves (Glasmeier and Farrigan, 2007). For instance, in Abilene, Texas, the town offered the state an incentive package of over $4 million, which included a 316 acre site and more than 1,100 acres of farmland adjacent to the site that could produce $500,000 worth of cotton a year. The town government also offered to build roads to the facility, provide housing for staff, allow access to a private plane and hangar for state officials, and upgrade communications and public
infrastructure connected to the facility (Campbell & Samoza, 1992).
Many rural communities jumped at the opportunity to ‘host’ a prison to spur local economic growth, and reduce unemployment and poverty. However, the evidence on whether these goals have been realized is inconclusive at best. Glasmeier and Farrigan (2007) compared fifty-five rural counties with prisons constructed between 1985 and 1995 to a control group of similar counties without prisons. Their study found little evidence of prisons fostering economic growth especially in persistently poor communities. Hooks et al. (2010), studying the effects of a new or existing prison on local employment, found that prisons have not played a significant role in economic growth in rural counties. The same study found that in areas experiencing relatively
low growth in higher educational attainment, prisons actually seem to be obstructing employment growth.
King, Mauer and Huling (2003) compared unemployment rates and per capita incomes for rural counties with and without adult prisons in New York State over 25 years, controlling for historical trends and county specific factors. Their model demonstrated no significant difference between the unemployment rates of rural counties that had built prisons since 1982 and those that have not (Figure 1.1). Further, this study found virtually no difference in per capita income of counties with prisons and those without (Figure 1.2).
Figure 1.1: New York State Unemployment Rates
Figure 1.2: New York State Per Capita Income (1976-2000)
Source: King, Mauer & Huling (2003), p.10
One of the explanations that King et al. give for these trends is the hiring policy for correctional officers in New York State. The system depends on long waiting lists and seniority levels. New correctional officers cannot choose a facility and are instead assigned to one that does not have a pre-existing reassignment list. This usually means that new officers are assigned to a less desirable facility like Sing Sing downstate, where working conditions are extremely difficult and staff apply to transfer out as soon as possible. Correctional staff are transferred from one facility to another and there is a massive backlog for people who want to work in their local
communities in rural upstate New York. Because of this system, many correctional officers do not live and spend money in the local community. According to King et al., “The job creation effect of a prison in a community is largely artificial in nature and amounts to an employment transplant” (King et al, 2003).
In a recent article for the Marshall Project, Meager and Thompson (2016) discuss a number of reasons why a prison siting is not a ticket to economic development. Consistent with the King et al. research, this article states that many prison employees are not hired from the host
community and do not spend their wages or pay taxes locally. Moreover, prisons often do not attract other types of businesses that could boost the reputation of the area. Hooks et al. (2010) discuss that big box stores like Walmart and fast food restaurants are often the only employers that follow prisons into communities. These employers bring low wage jobs and lead to the demise of small local businesses that cannot compete with these chains.
Additionally, local businesses are often not in a position to offer goods and services to prisons because they have to compete with large companies that are based elsewhere. Examining contracts for prison building and maintenance in New York State, King et al. found that much of the money for these jobs leaks out of the host counties. For instance, for the Upstate Maximum Security Correctional Facility that opened in Franklin County in 1999, the $21 million
construction contract went to a firm in Syracuse, the $8.2 million heating and ventilation contract went to a firm in Albany, and the $2.1 plumbing contract also went to firm in Syracuse. No Franklin County firms won contracts in the competitive bidding process.
Given that prisons often have weak linkages to the host community to begin with, and
sometimes have negligible or even negative impacts on rural economies, what can we expect when a local prison closes? This is a difficult question to answer since the trend of prison closures is relatively new and has not been studied extensively through an economic lens. There is often much news coverage when a closure is imminent, discussing the devastating economic impacts that a closure is expected to have. The big focus of these articles is often the number of jobs lost, without any nuanced analysis of who might be occupying those jobs. Moreover, these news articles rarely discuss opportunities that could emerge as a result of a closure.
Since academic literature on the impact of prison closures is sparse, it is helpful to consider changes in other industries to understand how a prison closure might impact the community around it. Military bases are particularly useful for comparison because of how similar they are to prisons in terms of local economic linkages (or lack thereof). Supplies for military bases are often not procured from local businesses. Military workers and retirees tend to be “unusual economic agents” since they do not spend a significant portion of their earnings at local
businesses (Hooker and Knetter, 2001). Bases have commissaries and healthcare facilities on site that cater to their basic needs. And when military bases close, most military personnel are transferred to other locations, which also seems to be the case for corrections staff.
Studies have shown that base closures have not had the devastating impacts on local economies that were expected. While jobs are lost locally as a direct result of closures, most military personnel are transferred to a different base. Bradshaw (1999) studying a closure in Merced County, CA, found that employment remained stable because as military workers moved out of the county, and the jobs vacated by their spouses became available to people not previously in the labor force. Moreover, Hooker and Knetter’s study on the local impact of fifty-seven closed bases found no evidence of closures being associated with indirect job losses in the community. Instead, closures were associated with a creation of indirect jobs since retired military personnel actually began spending money in the community instead of at base
commissaries and health facilities.
Hooker and Knetter argue that advocacy against base closures overlooks the opportunity cost of the resources that bases occupy. Closures could benefit communities if the land, buildings, and workers associated with bases are successfully transitioned to other, possibly more
productive sectors. The experience of communities with base closures leads us to consider that prison closures may be associated with new economic opportunities. These opportunities could be realized through careful planning that considers the skills and needs of the people in these communities, and the potential of former prison sites to serve a different set of economic goals.
CHAPTER 2
Understanding Two Contexts: Fulton County, NY and Scotland County, NC
This chapter gives an overview of the locations and demographics of the counties where my two case studies are located: Fulton County, NY and Scotland County, NC. Both counties
experienced a prison closure since the year 2000, and are in the process of redeveloping their former prison sites. The information in this chapter will provide context for later sections that explore the industrial histories of each place, the impact of the prison closure on the local economies, and the goals and constraints that are driving redevelopment in each place.
Table 2.1: Population and Density at a Glance Fulton County, New York Scotland County, North Carolina Total population 53,992 35,509 Number of households, 2011-2015 22,281 12,996 Population/square mile, 2010 112.1 113.4 Land area in square miles, 2010 495.47 318.85
Source: ACS 2015 five-year estimates, Decennial Census 2010
Fulton County, compared to Scotland County, has a larger population though both places have similar population densities. The two countries diverge on a number of important demographic characteristics that are highlighted below.
Age
Fulton County has a median age of 42.8 years and a higher proportion of people who are 45 years or older, compared to people in the U.S. and Scotland County. Scotland County has a younger population, with a median age of 39.1 years, which is closer to the national median age of 37.6 years.
Figure 2.2: Age Distribution by Location
Race
Fulton County has a very high percentage (95.2%) of people who identify as “white alone”. In comparison, Scotland County has a much more racially diverse population. Forty six percent of the population identifies as “white alone”, and 38.5% identifies as “black or African American alone”. Also notable is the high percentage of people who identify as “American Indian” in Scotland County (10.4% in Scotland County, vs. 1.2% in North Carolina, and 0.8% in the U.S.).
Figure 2.3: Race by Location
Source: ACS 2015 five-year estimates Income
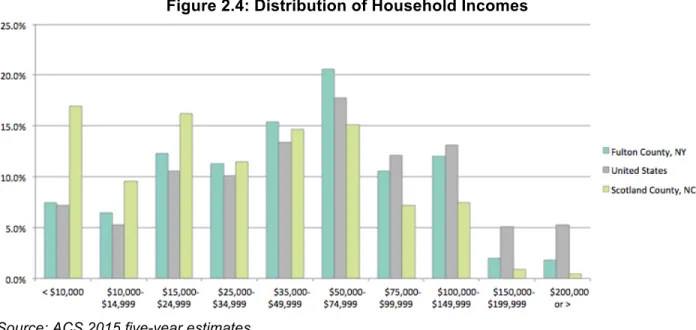
Scotland County, NC is a much poorer community compared to Fulton County, NY. The median household income in Scotland County is $30,958 compared to $46,969 in Fulton County and $53,889 nationally. 16.9% of the households in Scotland County make less than $10,000 annually, and this is the income bracket with the highest proportion of households in the county (see Figure 2.4). In contrast the most common income bracket for households in Fulton County is $50,000 to $74,999. The persons in poverty rate for Scotland County is 29.0%, compared to 13.5% nationally, and 17.9% in Fulton County.
Figure 2.4: Distribution of Household Incomes
Source: ACS 2015 five-year estimates Educational Attainment
Scotland County has a high percentage of people over the age of 25 who do not have a high school diploma or equivalent qualification (21.3%). Generally the population in Scotland County seems to be much less educated compared to Fulton County and the nation. Fulton County has a higher percentage of people with high school degrees compared to Scotland County, but a lower percentage of people with Bachelor’s and Master’s degrees compared to the nation (see Figure 2.5).
Figure 2.5: Educational Attainment for Population 25 Years and Over
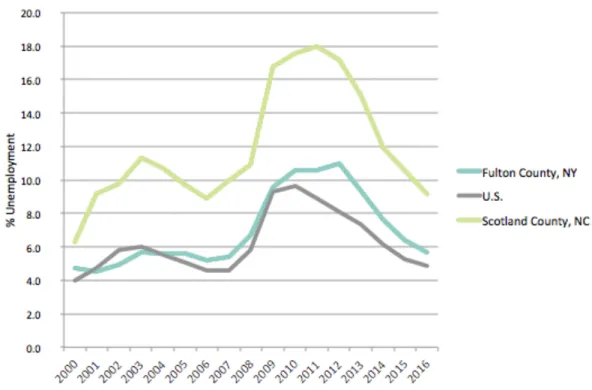
Unemployment Rates
The unemployment rate in both Scotland County, NC and Fulton County, NY has generally been higher than in the U.S. as a whole from 2000 to 2016 but this difference is much more exaggerated in Scotland County. The rate of unemployment in Scotland County peaked in 2011 when it was 18%. Since then the rate of unemployment has improved and is currently at 9.2%. Fulton County’s unemployment rate peaked in 2012 when it was 11%, and is currently at 5.7%.
Figure 2.6: Unemployment Rates (2000 - 2016)
Source: Bureau of Labor Statistics- CPS and LAUS (2016)
Summary
This chapter provided an overview of the types of community level factors that stakeholders have to consider when thinking about a new redevelopment project or transitioning an existing workforce to a new industry. These factors will come up again in chapter 4 which discusses the motivations behind the two redevelopment projects in Fulton County and Scotland County. In general, stakeholders in Scotland County are planning for a population that is young, poor and racially diverse, with low educational attainment numbers. In contrast Fulton County is grappling with an older population, in an area where there is a high proportion of middle class white families. While high school attainment is high in Fulton County, only a small fraction of the population has advanced degrees, which is another consideration for economic development planning.
CHAPTER 3: Impact of Prison Closure on Rural Communities
This chapter provides background information about when and why prisons proliferated in New York and North Carolina. It also explores the significance of prison jobs in Scotland County and Fulton County compared to jobs in other industries. Finally, with the backdrop of historic and recent economic conditions in these two counties, it reflects on the likely impact of lost prison jobs in the two places and strategies for thinking about transitioning local workers and physical assets to serve different sets of economic goals that are not linked with mass incarceration.
3.1. Fulton County, NY
3.1.1 Prison Construction and Closure in New York State
In the early 1970s, fewer than 200,000 people were incarcerated in state and federal facilities nationwide. By the year 2000, this number rose to 1.5 million, with 7 million people under some kind of state supervision (probation, parole, prison, jail). New York state mirrored these national trends, and saw a huge boom in its prison population from the late 1970s to the early 2000s. By the end of the century, 73,000 were incarcerated in the state, compared to 14,000 in 1970. New York was one of the first states to impose harsh sentencing laws related to drug crimes, which had a huge impact on the size of the prison population.
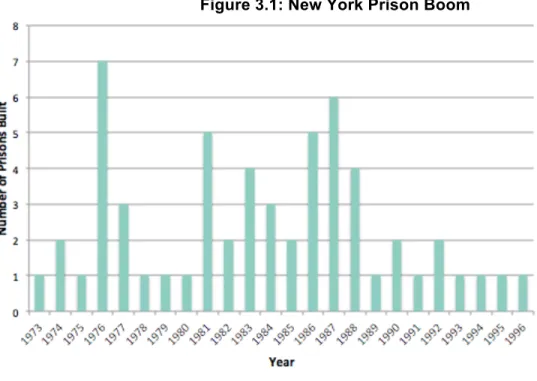
New York was also one of the first states to boost the construction of prisons starting in the mid-1970s, trailing only Texas and Florida (Martin, Eason and Gonzales, 2016). Many new prisons were constructed in rural areas in clusters (Figure 3.1). The town of Malone (near the Canadian border), for instance, has three prisons, while another seventeen localities have two prisons each. These prisons also happen to be located in overwhelmingly conservative political districts. In 2003, ninety eight percent of the state’s prison population was housed in Republican Senate districts. The average prison in New York state housed about 900 people at an annual cost of $60,000 per person, and employed almost 400 people.
Figure 3.1: New York Prison Boom
Source: Martin, Eason & Gonzalez (2016), p.18
The demographics of the towns where these ‘new’ prisons were constructed are also interesting to note. Martin, Eason and Gonzales (2016) state that the type of town where prisons were sited began to shift in the 1980s. Compared to towns where prisons were built in the 1970s, towns where prisons were constructed in the 1980s and 1990s had significantly smaller populations and higher percentages of people of color. The towns that were chosen for prison construction in the 1980s and 1990s also showed greater signs of economic distress with higher levels of poverty and unemployment.
As in other parts of the country, the prison boom in New York state was followed by a bust. A combination of fiscal conservatism and advocacy around criminal justice reform seems to be driving expectations for a smaller system, with fewer people being incarcerated for nonviolent offenses. Sixteen adult prisons have been closed since 2009. Additionally, thirty juvenile facilities, including ‘placement’ and ‘detention’ facilities (youth equivalents of prisons and jails respectively), have been closed including the Tryon Residential Center in Fulton County.
According to Martin, Eason and Gonzales (2016), the decision-making around which prisons should be closed did not involve any public process or input from city officials. The decision was made by the Governor’s office, and while cost savings and efficiency were often cited as criteria, the final results seem to not necessarily match up with these factors. Older facilities built in the
nineteenth or early twentieth century (e.g. Attica, Auburn and Sing Sing) stayed open while some newer facilities were closed down. Prisons in remote locations that appear to be more expensive to run remained open. Martin, Eason and Gonzales (2016) observe that many (though not all) of the prisons that closed were in or close to urban centers. They also note that small towns with little political leverage were particularly vulnerable to closures. In the case of Tryon, a federal investigation on human rights violations within the facility was part of the decision-making around the closure, as will be discussed in the following sections.
3.1.2 The Troubling History of Tryon
The Tryon School for Boys2 is known to be the place where Mike Tyson first learned boxing.
When the facility opened in 1966, it was a very different place than what it was in 2011 when it closed. There was initially no fence wrapping around the facility and the youth were allowed to leave to go to the movies or rollerskate in the community. The youth were treated more like residents than prisoners, but this culture was short lived. Tyron started to become a more punitive environment in the 1970s, when a former warden of Shawangunk prison took over as the deputy director of rehabilitative services:
It didn’t take long before New York’s juvenile facilities began to feel not all that different from Attica or Sing Sing or Shawangunk. Boys in uniforms marching around. No more home visits. No more field trips. No more staff playing basketball with the kids. If a kid had to go off campus—for a doctor’s visit or to court—he had to wear shackles and handcuffs. Employees who had come to Tryon because they wanted to help kids suddenly found themselves cast in the role of prison guard (Gonnerman, 2010, p.3). This was the reality of Tryon when Commissioner Gladys Carrión of the Office of Children and Family Services, charged with running facilities like this one, pushed for its closure. Kids who came to Tryon, some as young as 12, did not have access to a decent education; the school at the facility was not accredited. The U.S. Department of Justice had threatened to take over facilities for young people in New York state after investigating three facilities including Tryon and finding a number of instances where the constitutional rights of youth had been violated. Many kids had concussions and broken teeth and bones from being forcefully restrained by employees. In November 2006, fifteen year old Darryl Thompson lost his life while being pinned to the ground with extreme force by correctional staff. The death was ruled a homicide but no staff members were indicted.
2 The facility was, at first, only open to boys. It was later renamed the “Tryon Residential Center”. A girls wing was added in 1987.
Tryon’s closure seems to have been a perfect storm of social justice and fiscal factors. Besides being under pressure for a host of human rights violations, the Tryon facility was costing
taxpayers $210,000 per youth per year. And investment in facilities like Tryon in New York State was not yielding much success in terms of keeping communities safe and rehabilitating young people. Eighty nine percent of the boys who were being incarcerated in New York State prisons were rearrested before they turned 28 years old. Instead of being the model for rehabilitation that it was designed to be initially, Tryon became part of a punitive system that trapped many young people in a lifelong struggle with criminal justice and incarceration.
3.1.3 Contextualizing Prison Jobs in Fulton County
To understand the impact of the Tryon’s closure on the local economy, it is important to consider the history of jobs in the region as well as the current local and regional industrial landscape.
Fulton County’s two ‘major’ cities are Johnstown and Gloversville. Though Tyron is technically located in the town of Perth, which is more rural, it has a Johnstown address. Fulton County until the 1970s was considered the ‘glove making capital of the world’, and produced 90% of men’s gloves sold in the United States. A website called Glovers and Tanners traces the fascinating history of the area:
Johnstown and Gloversville were not only the center of the glove industry, but these were the first places in the United States where gloves were manufactured.
The settlers had learned the crude process of tanning deer skin from their fathers and the Indians. The tanned skins were placed on basswood boards, and on them were traced the outlines of gloves, mittens and moccasins.
The skins were then cut around the outlines with sharp sheep shears, and sewed with a three edge needle and homespun hempen thread. Nearly every home became a
miniature glove factory. Some of the people became peddlers and in sleighs and wagons carried their gloves to distant points. From such simple beginnings came the great glove industry of Gloversville and Johnstown. (Glovers and Tanners, n.d.) Companies in Gloversville (which got its name from this industry) and Johnstown employed thousands of people in leather tanning and finishing, and glove manufacturing. Tanneries used abundant local hemlock to process leather for gloves that were shipped around the U.S. and abroad. The glove industry had an impact on many households in these cities. Traditionally the
men would cut gloves from leather in the factories and women would sew them by hand at home, though with the invention of the sewing machine, many women moved to work in factories. Many ancillary businesses developed around this industry. The Glove Theatre, a prominent performing arts venue that opened in 1904 in Gloversville, was named after the region’s biggest industry.
The decline of the glove industry came in the 1970s. According to Ron Peters, President and CEO of the Fulton County Center for Regional Growth, this decline was associated with the introduction of EPA regulations which required companies to treat wastewater and other
industrial by-products. Many companies moved abroad to avoid the costs associated with these regulations and employ cheaper labor, leaving vacant factory space and environmental
contamination in Johnstown and Gloversville. According to an article in the Times Union, the Cayadutta Creek, that winds through Johnstown and Gloversville “changed colors day to day based on the dyes dumped in the water; suds reaching heights of 10 feet floated on top of the creek, which was barren of fish and other aquatic life for decades” (Snyder, 2016). Since then the cities have worked hard on remediation; the Creek has been repopulated with fish but some parts of it are still contaminated with sediment.
Besides glove manufacturing, dairy farming which was an important sector locally also seems to be on shaky grounds. Between 2002 and 2007, the number of dairy farms in Fulton County decreased from 44 to 28. According to The Leader Herald, “costs, profit margins, dairy pricing and lack of interest in farming among younger generations” are some of the factors driving this shift (The Leader Herald, 2016). The demand for milk to make yogurt has increased in the area with the Chobani and FAGE plants which have opened up in recent years, but selling to these industries is not proving to be as profitable for small dairy farmers. Greg Fagan, the Supervisor of the Town of Perth who worked on his family’s dairy farm in Fulton County close to the Tryon site, shared:
Fulton County only has a handful of dairy farms left. On Route 20, which is the state route between Johnstown and Perth, there were eleven dairy farms in a 5 or 6 mile stretch when I was a kid. Now there are none. Over the past 20 to 30 years it’s really changed. You’re getting more dairy farming maybe in the western part of the county. But by us in the three towns—Perth, Broadalbin and Mayfield—I can only think of 4 or 5 dairy farms left.
Current Private Employment
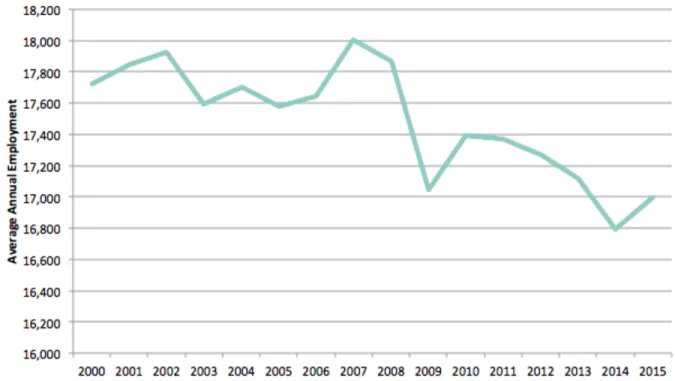
BLS data from 20153, show that Fulton County had an annual average employment of 16,998. These jobs were associated with 1,202 employers in the county. Figure 3.2 shows how
employment has changed in Fulton County over time. The overall number of jobs in the county has declined since 2000; there was an especially steep decline right after the 2008 financial crisis and the economy has recovered slowly, but not fully since.
Figure 3.2: Average Annual Employment- Fulton County, NY
Source: Quarterly Census of Employment and Wages - Bureau of Labor Statistics (2000- 2015)
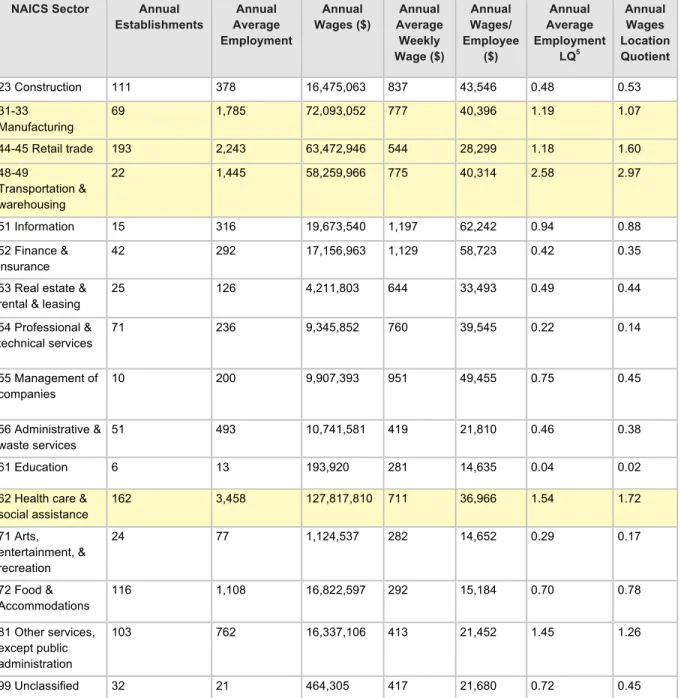
Table 3.1 shows the distribution of workers by industry in Fulton County4, as well as the location quotients indicating which industries are dominant in the region. Based on the location quotients and number of jobs, it seems that Fulton County is dominant in the following four sectors: manufacturing, retail trade, transportation and warehousing, and health care and social assistance. Data are not available for NAICS sector 11—Agriculture, forestry, fishing and hunting— because there are only ten employers in this category in Fulton County.
3 Most recent year for which BLS data is available on the county level.
Table 3.1: Private Sector Employment by NAICS Sectors, Fulton County, New York (2015)
NAICS Sector Annual
Establishments Annual Average Employment Annual Wages ($) Annual Average Weekly Wage ($) Annual Wages/ Employee ($) Annual Average Employment LQ5 Annual Wages Location Quotient 23 Construction 111 378 16,475,063 837 43,546 0.48 0.53 31-33 Manufacturing 69 1,785 72,093,052 777 40,396 1.19 1.07 44-45 Retail trade 193 2,243 63,472,946 544 28,299 1.18 1.60 48-49 Transportation & warehousing 22 1,445 58,259,966 775 40,314 2.58 2.97 51 Information 15 316 19,673,540 1,197 62,242 0.94 0.88 52 Finance & insurance 42 292 17,156,963 1,129 58,723 0.42 0.35
53 Real estate & rental & leasing
25 126 4,211,803 644 33,493 0.49 0.44 54 Professional & technical services 71 236 9,345,852 760 39,545 0.22 0.14 55 Management of companies 10 200 9,907,393 951 49,455 0.75 0.45 56 Administrative & waste services 51 493 10,741,581 419 21,810 0.46 0.38 61 Education 6 13 193,920 281 14,635 0.04 0.02
62 Health care & social assistance 162 3,458 127,817,810 711 36,966 1.54 1.72 71 Arts, entertainment, & recreation 24 77 1,124,537 282 14,652 0.29 0.17 72 Food & Accommodations 116 1,108 16,822,597 292 15,184 0.70 0.78 81 Other services, except public administration 103 762 16,337,106 413 21,452 1.45 1.26 99 Unclassified 32 21 464,305 417 21,680 0.72 0.45
Source: Quarterly Census of Employment and Wages - Bureau of Labor Statistics (2015)
Figure 3.3 shows trends over time in the four industries that are important to Fulton County: manufacturing, retail trade, transportation and warehousing, and healthcare and social assistance. Of these four sectors, transportation and warehousing, and healthcare and social assistance have been on the rise. Retail trade appears to have declined slightly in the last fifteen years, and manufacturing has seen a significant decline since the year 2000.
Figure 3.3: Fulton County Private Employment by Sector, 2000-2015
Source: Quarterly Census of Employment and Wages - Bureau of Labor Statistics (2000- 2015)
Despite the overall decline in manufacturing, there are some positive recent developments within this industry that are worth noting. Drilling down to the three digit NAICS codes, it appears that food manufacturing is an important sector in Fulton County, employing about 423 people with a location quotient of 2.30.This data seems to be consistent with anecdotal information from county officials, who emphasize the importance of the following companies which have recently located to the county: FAGE USA Dairy’s yogurt manufacturing facility, Euphrates Inc.’s feta cheese plant, CG Roxane’s bottling and shipping facility (for Crystal Geyser® Alpine Spring water), and Pata Negra’s speciality sausage facility.
While manufacturing related to leather products does not dominate the economy in Fulton County as it used to in the past, there is still some concentration of leather and textile manufacturing, providing over six hundred jobs in the area (Table 3.2).
Table 3.2: Fulton County Leather and Textile Manufacturing Jobs in 2015
NAICS Sub-Sector Annual
Establishments Annual Average Employment Annual Wages ($) Annual Average Weekly Wage ($) Annual Wages/ Employee ($) Annual Average Employment LQ Annual Wages Location Quotient 313 Textile mills 5 107 3,045,858 546 28,378 7.52 6.94 314 Textile product mills 6 134 4,535,986 652 33,914 9.52 11.77 315 Apparel manufacturing 7 64 1,320,055 397 20,626 3.88 2.98
316 Leather and allied product manufacturing
16 333 13,572,796 783 40,708 94.81 123.67
Source: Quarterly Census of Employment and Wages - Bureau of Labor Statistics (2015)
As noted above, health care and social assistance is also a dominant sector in Fulton County that has been growing in recent years, especially with regard to services for the elderly (Table 3.3).
Table 3.3: Fulton County Healthcare and Social Assistance Jobs in 2015
NAICS Sub-Sector Annual
Establishments Annual Average Employment Annual Wages ($) Annual Average Weekly Wage ($) Annual Wages/ Employee ($) Annual Average Employment LQ Annual Wages Location Quotient 621 Ambulatory health care services 67 911 35,342,597 746 38,778 1.09 1.02 623 Nursing and residential care facilities
58 1,035 28,758,541 534 27,782 2.59 3.47
Source: Quarterly Census of Employment and Wages - Bureau of Labor Statistics (2015)
The large employment numbers in the transportation and warehousing sector in Fulton County include employment at Walmart’s Regional Return Center (which opened in 1995) and
Northeast Regional Food Distribution Center (which opened in 2000). Walmart’s operations in Fulton County employ more than a thousand people.
State Government Employment
Table 3.4 highlights employment in state government in Fulton County. NAICS sector 92 includes employment in correctional institutions under the 6 digit code 922140. Data is not available for employment specifically in corrections for Fulton County since there is currently only one employer in that category.
Table 3.4: Fulton County State Government Jobs by NAICS Sectors in 2015
NAICS Sector Annual
Establishments Annual Average Employment Annual Wages ($) Annual Average Weekly Wage ($) Annual Wages/ Employee ($) Annual Average Employment LQ Annual Wages Location Quotient 92 Public administration 17 355 23,976,707 1,300 67,619 1.63 2.80 922110 Courts 5 50 3,818,036 1,476 76,744 4.14 7.26
924110 Air, water, and waste program administration
5 62 2,881,223 901 46,849 12.14 11.95
Source: Quarterly Census of Employment and Wages - Bureau of Labor Statistics (2015 Annual Averages). Only non suppressed categories shown.
3.1.4 Impact of Prison Closure on Fulton County’s Economy
Whenever a prison closes, the data point that gets the most attention in local media and among government officials is the number of jobs lost. In the case of Tryon, 325 jobs were lost when the facility closed in 2011, and this number was circulated widely in news stories about the closure. But putting this number in context, if Tryon was open today its jobs would constitute only 1.9% of the total employment in the county (if we assume that the number of jobs would have stayed the same). In terms of total jobs, this percentage does not seem very significant. It could, however, be considered significant in the context of local government jobs since currently there are only 355 jobs in public administration in the county.
But measuring the impact of a closure is, and should be, more nuanced than counting the total number of jobs lost. It is critical to understand who the workers were that filled these positions and what happened to them after the facility closed. From reading news articles and
interviewing local economic development stakeholders, I was unable to get a clear answer on how many of the 325 employees at Tryon lived in the local community. I received conflicting information on this point, sometimes even within the same conversation. One local government stakeholder said that he knew at least twenty local people who worked at Tryon, but later also mentioned that he was aware of people driving an hour and a half to get to the facility to work. This implies that some percentage of workers lived outside Fulton County since the county itself is small geographically, but the magnitude of this issue was difficult for me to determine.
The question of where workers lived is important to unpack when looking to understand the impact of a prison closure because it can give a sense of what percentage of the payroll was spent in the local community and had multiplier effects that benefited other local industries. Many of my interviewees talked about Tryon employees spending money in Johnstown and
Gloversville on supplies like coffee and gas. But they were not certain about the magnitude of these sales and the impact that local businesses felt when the facility closed. Knowing where workers lived is also important to help estimate what percentage of employees contributed to the local government’s revenue through paying property taxes.
Economic development stakeholders in Fulton County hypothesize that a combination of these three things happened to the Tryon workers when the facility closed: some were laid off, some were transferred to other state correctional institutions, and the remaining employees likely retired early. If many of Tryon’s workers lived in Fulton County and were laid off, this would have bigger ripple effects on the economy than if most workers commuted to Tryon and were
transferred elsewhere.
The facility’s procurement practices could be another area of investigation for understanding the impact of a closure. One interviewee mentioned that the local hardware store received business from Tryon because constructions crews for the site would buy supplies locally. In contrast, King et al. (2006) found that small retailers in rural counties often do not carry supplies needed for prison construction, and construction and maintenance labor contracts for prisons in New York state often go to large companies that are not based in the host community.
Future research should look to investigate, in greater depth, how procurement works at closing prisons and the various ways in which state money might be leaking to other communities besides the host. Further research should also include interviews with local business owners to understand the loss in revenue when a local prison closes. This information could help expose whether there is a difference between the real and perceived impacts of a prison closure, and the magnitude of this difference.
3.2 Scotland County, NC
3.2.1 Prison Construction and Closures in North Carolina
In 1931, the North Carolina General Assembly enacted the Conner Bill, which enabled the state to take over control of all prisons and inmates. The condition of prison facilities and the need for inmate labor for highway construction led the General Assembly to consolidate the State
“Road camps” were constructed throughout the state to provide prison labor for building highways. Road camps were designed to house 100 inmates or less. These minimum-security camps were located throughout the state, primarily for the convenience of road building and repair.
This relationship between the State Highway Commission and the State Prison Department continued for more than 25 years until 1957 when the General Assembly finally voted to separate the two departments. As part of this change, the Council of State recommended consolidation of prison operations, resulting in the closures in Ashe, Beaufort, Brunswick, Chatham, Cherokee, Craven, Edgecombe, Hertford, Jackson, Macon, Perquimans, Pitt, Surry, Transylvania and Wilson counties. But many small prisons continued to operate. In 1992, North Carolina had 91 prisons that housed less than 110 inmates, much more than any other state (other states had an average of 24.5 such units).
In 1992 the Government Performance Audit Committee made a number of recommendations to cut costs. One of these recommendations was the closure of thirty small facilities, including the Wagram prison6 in Scotland County. At the time, NC had the largest number of prisons
compared to all other states. Small facilities, such as the one in Scotland County, had high staffing levels and were much more expensive to run than larger facilities. According to the audit report, North Carolina had the eighth highest corrections staffing level in the nation and low prison efficiency as measured by inmates per correctional officer compared to states in the southeast. Based on this audit, it was decided that the Wagram facility in Scotland County be closed to save money. The process was completed in 2001 when the Wagram prison finally closed its doors.
Since then closures have continued, even as some large prisons have been constructed to reorganize the prison population in the state for efficiency. For instance, two years after the Wagram prison closed in Scotland County, the Scotland Correctional Institution opened less than ten miles from it, with a capacity of 1,756 beds (more than ten times the size of the old facility).
6 I refer to the closed prison in Scotland County as the “Wagram prison” (it is in the town of Wagram). Its official name was the Scotland Correctional Center. I avoid calling it by its official name because less than ten miles away is a facility that opened up two years after this one closed, called the “Scotland
In 2013, Governor Pat McCroy announced five more closures to save money, including one in Robeson County that neighbors Scotland County. All five prisons required expensive
renovations and repairs, and are no longer needed, given that the state’s prison population has been shrinking. The N.C. Sentencing and Policy Advisory Commission attributes this decline in the prison population to 1) the decrease in population growth in the state (especially for males ages 16-24, the group most likely to be arrested), 2) continued nationwide declines in crime trends, and 3) policy changes like the state’s Justice Reinvestment Act (2011) that aim to reduce dependence on incarceration and reinvest in community based alternatives.
In general, the story of the last decade in NC corrections has been as much about consolidation and reorganization of facilities as decarceration. Efficiency and cost savings for the state seem to have important motivators in the total reduction of prison beds and the reorganization of the prison population in favor of fewer, larger facilities.
3.2.2 Contextualizing Prison Jobs in Scotland County
Downtown Laurinburg, less than ten miles from the Wagram prison site is the historic center of Scotland County. The downtown was first developed during the Civil War when railroad shops were relocated here from Wilmington, NC. Since a great deal of war action was centered around Fort Fisher on the coast, the shops were moved inland to Scotland County to be in a safer location. However, this relocation of shops by railroad officials was only meant to be temporary, feeding a constant sense of economic uncertainty for locals. According to a quote by a local, Mr. Maxey John, on the Scotland County official website, "During all these years the fear of disaster should the shops move, was so apparent that even those who were able to build largely and permanently refused to do so.”
The railroad, which became operational in Laurinburg in 1861, continued to be an important asset to the community. It allowed hundreds of loads of watermelons and cantaloupes to be transported from Laurinburg and neighboring communities. In the early twentieth century, Laurinburg called itself “The Capital of the Cantaloupe World.”
The railroad shops that were central to the development of Laurinburg eventually left in 1984, but the void was filled by textile manufacturing. But manufacturing in Scotland County expanded beyond textiles especially in the 1960s when companies like Campbell Soup and Abbott
Laboratories located operations there. Products like mobile homes, hospital equipment, cabinet accessories, golf club grips and transportation equipment were made in the county.
Employment in manufacturing peaked in 1996; at that point nearly half of all the jobs in the county were in this sector. Since then manufacturing jobs have been on a steep decline (Figure 3.4). Scotland County lost more than 5,400 jobs in manufacturing between 2001 and 2014. While the state lost manufacturing jobs as a whole during that time, the percentage loss in Scotland County was much higher (Figure 3.5). This loss is apparent as you drive around the county; many spaces previously occupied by manufacturing are now vacant.
Figure 3.4: Manufacturing vs. Non-Manufacturing Jobs in Scotland County (1990-2012)
Source: Report by Labor & Economic Analysis Division of NC Dept. of Commerce (2015)
Figure 3.5: Manufacturing Job Losses (2001-2015) (Scotland County suffered deeper losses than NC or the U.S.)
Current Private Employment
BLS data from 20157, show that Scotland County had an annual average employment of
11,779. These jobs were associated with 636 employers in the county. Table 3.5 shows that the most dominant sectors in the economy, which provide significant employment, are
manufacturing, retail trade, and healthcare and social assistance.
Table 3.5: Private Sector Employment by NAICS Sectors, Scotland County, NC (2015)
NAICS Sector Annual
Establishments Annual Average Employment Annual Wages ($) Annual Average Weekly Wage ($) Annual Wages/ Employee ($) Annual Average Employment LQ Annual Wages Location Quotient 11 Agriculture,
forestry, fishing & hunting 12 73 $2,096,591 $550 $28,622 0.69 0.94 23 Construction 35 344 13,481,228 755 39,247 0.63 0.66 31-33 Manufacturing 37 2,149 101,656,029 910 47,304 2.07 2.30 44-45 Retail trade 125 1,635 35,370,777 416 21,628 1.24 1.36 48-49 Transportation & warehousing 14 321 14,870,322 892 46,385 0.83 1.16 51 Information 7 63 3,301,017 1,005 52,259 0.27 0.23 52 Finance & insurance 34 229 10,569,665 888 46,156 0.47 0.33
53 Real estate & rental & leasing
23 71 2,331,744 628 32,650 0.40 0.37 54 Professional & technical services 26 115 4,899,524 822 42,728 0.16 0.11 55 Management of companies & enterprises 3 39 1,706,754 853 44,331 0.21 0.12 56 Administrative & waste services 31 664 16,749,525 485 25,244 0.89 0.91 61 Educational services 7 259 8,148,189 605 31,470 1.13 1.12
62 Health care & social assistance 103 2,030 85,461,233 810 42,099 1.31 1.76 71 Arts, entertainment, & recreation 11 56 1,148,438 393 20,447 0.31 0.26 72 Accommodation & food services 60 1,121 14,110,078 242 12,582 1.03 1.00 81 Other services, except public administration 40 150 3,264,785 420 21,838 0.41 0.39
Source: Quarterly Census of Employment and Wages - Bureau of Labor Statistics (2015 Annual Averages). Only non-suppressed categories shown.
Drilling down to three digit NAICS codes, we see that there is a high concentration of jobs in transportation and equipment manufacturing in Scotland County, with 893 employees and location quotient of 6.59 (Table 3.6). This subsector alone makes up more than 40% of the manufacturing jobs in Scotland County.
Table 3.6: Scotland County NAICS Sector 33 (Manufacturing) in 2015
NAICS Sub-Sector Annual Establishments Annual Average Employment Annual Wages ($) Annual Average Weekly Wage ($) Annual Wages/ Employee ($) Annual Average Employment LQ Annual Wages Location Quotient 332 Fabricated metal product manufacturing 6 115 7,302,874 1,219 63,366 0.94 1.67 336 Transportation equipment manufacturing 6 893 43,262,658 931 48,433 6.59 6.68
Source: Quarterly Census of Employment and Wages - Bureau of Labor Statistics (2015 Annual Averages).
A large number of people are also employed in retail; a significant percentage of those people work in stores related to construction and home furnishing (Table 3.7).
Table 3.7: Scotland County Retail Subsectors in 2015
NAICS Sub-Sector Annual Establishments Annual Average Employment Annual Wages ($) Annual Average Weekly Wage ($) Annual Wages/ Employee ($) Annual Average Employment LQ Annual Wages Location Quotient 442 Furniture & home furnishings stores 7 258 5,892,328 439 22,831 6.54 6.51 444 Building material & garden supply stores 11 181 4,377,077 466 24,216 1.73 1.95
Source: Quarterly Census of Employment and Wages - Bureau of Labor Statistics (2015 Annual Averages)
Healthcare and social assistance is also a dominant sector, with 76 employers falling within this category in the county (Table 3.8).
Table 3.8: Scotland County Healthcare and Social Assistance Jobs in 2015
NAICS Sector Annual
Establishments Annual Average Employment Annual Wages ($) Annual Average Weekly Wage ($) Annual Wages/ Employee ($) Annual Average Employment LQ Annual Wages Location Quotient 621 Ambulatory health care services 70 583 34,637,34 8 1,142 59,370 1.01 1.53 623 Nursing and residential care facility 6 393 9,421,257 462 24,003 1.42 1.73
Source: Quarterly Census of Employment and Wages - Bureau of Labor Statistics (2015 Annual Averages)
Unfortunately it is not possible to obtain Bureau of Labor Statistics data on state government employment for Scotland County as it was for Fulton County. Data are suppressed for this category since there are only ten employers that fall within NAICS sector 92 in Scotland County, which includes jobs in public administration.
3.2.3 One Closes, Another Opens: Impact of Prisons on Scotland County’s Economy When the Wagram facility closed in 2001, locals estimate that there were only 50 or 60 jobs that were lost. According to Director Bill Stovall at the Department of Public Safety in North Carolina (which handles state corrections), those who worked at the facility were offered jobs at a
different facility within ‘reasonable commuting distance’, which is loosely defined as no more than sixty miles away.
Some correctional officers who lost their jobs at the Wagram prison were offered jobs at the Scotland Correctional Institution (SCI), which opened in 2003, just a few miles away from the old Wagram prison. It has capacity for over 1,700 beds, and employs close to five hundred people. In this case, even though there was some lag time between the old facility closing and the new one opening, there was a large net gain in correctional jobs in the county since this prison employed ten times as many people. According to Director Stovall:
Our last three governors emphasized that these new facilities be sited in counties that were economically depressed recognizing that a lot of our manufacturing jobs and base had left the state, and here was an opportunity to bring in near recession proof jobs with decent benefits to very poor areas of our state.
In this recent round of constructing large prisons, North Carolina’s siting strategy was to go where local counties invited the state in, as opposed to siting prisons based on convenience for road construction and repair (which was the case in the 1930s). The state built these prisons in communities like Scotland County, where the county provided the land and necessary utilities free of cost in exchange for what are described as “recession proof jobs.”
The 505 jobs currently at SCI constitute about 4.3% of the total employment in the county. But only 138 of these 505 jobs (27%) are held by Scotland County locals. According to county leaders, SCI does not have a preference for local hiring. One county official remarked that all kinds of professionals are needed to run prisons beyond correctional officers, including
electricians, plumbers, doctors, nurses etc. However, there is a sense locally that when a new prison opens, many staff are hired from other facilities and from within other parts of the system, and that superintendents “bring in their staff...like the president.” Director Stovall remarked that it can be difficult to find local candidates to fill positions that require more specialization and education. However, based on the current number of local employees, it seems that even correctional officers—and not just highly educated professionals (e.g. doctors)—are being hired from outside the county (since those are the majority of jobs in a prison, likely more than the 138 local hires).
Summary
In many rural communities in the U.S. where manufacturing jobs were on the decline, prisons were seen as a way to save the economy and plug the vacuum. In the case of both Fulton County and Scotland County, however, the presence of a prison was not enough to mitigate the decline of the economy overall. While prisons certainly provide some jobs, they constituted a small portion of the total number of local jobs in both cases. The Tryon facility in Fulton County, if open today, would have only provided 1.9% of the jobs in the county. In Scotland County, the small Wagram prison from the 1930s would have provided 0.5% of the local jobs and the newer Scotland Correctional Institution currently provides 4.3% of jobs in the county.
The presence of these positions is even less significant for the local economy if county residents do not fill them. In both places, there is evidence to suggest that locals did not fill many of the jobs at the facilities. The extent of this problem was difficult to ascertain in Fulton County, but in the new newer facility in Scotland County we know that only 27% of the 505 facility jobs are
filled by locals. This means that a significant portion of the salaries made by corrections staff are spent outside the host community, with limited multiplier effects for the local economy.
Through this study I was unable to explore, in depth, the current procurement practices for facilities in New York and North Carolina. Other literature suggests that in order to cut costs, prisons often contract with large companies for goods and services that are not based in the host communities. This is another possible way in which wealth associated with prisons may be seeping out of the host county, and not delivering the results that are often promised during a prison siting negotiation.
Both Fulton County and Scotland County have been struggling with the loss of jobs in the last few decades, particularly in manufacturing, which has been an important sector in these localities. When Tryon closed in Fulton County in 2011, the county was already experiencing a downward employment trend (Figure 3.2). In Scotland County, the opening of the Scotland Correctional Institute barely made a dent in the unemployment rate over the long term (Figure 2.8). It is time we reconsidered prison building as a viable economic development strategy and think about long term, sustainable solutions for stabilizing economies that have been rattled by deindustrialization in the last few decades.
CHAPTER 4: Prison Redevelopment
This chapter explores two case studies—in Fulton County, NY and Scotland County, NC— where former prison sites are being reused to serve different goals for community and economic development. It discusses the perspectives of the lead redevelopment agencies as well as other project supporters and stakeholders. It also sheds light on the political, financial, logistical and design constraints that are shaping redevelopment in each case. And finally, this chapter discusses the challenges with prison adaptive reuse and ideas that could facilitate these transformations more quickly and efficiently on other sites in the future.
4.1 Tryon Technology Park, NY
The following section describes the process by which the Tryon Residential Center—a youth placement center in Fulton County, NY—was converted into a technology park with ‘shovel ready sites’ available for sale to private companies. The project was spearheaded by the Fulton County Industrial Development Agency (IDA). The IDA worked with the state government to get site control and financing for infrastructure improvements, and is currently in the process of recruiting companies for the technology park.
Figure 4.1: Former Tryon Residential Center, Now Home to Tryon Technology Park
Date of Prison Closure: 2011 Date Redevelopment Began: 2011 Total Size: 515 acres
Site History
In 2009, the Department of Justice found that the constitutional rights of youth at Tryon and three other juvenile justice facilities were being violated. According to the investigation:
Staff at the facilities consistently and excessively used a disproportionate degree of force to gain control of youths in nearly every type of situation, leading to concussions, broken or knocked out teeth, spiral fractures, and other injuries. Further, staff at the facilities overused restraints often causing severe injury to youths, including initiating facedown restraints through "hooking and tripping," a process where staff grab a youth’s arms and trip his or her feet from underneath, causing the youth to fall face-first on the ground. Additionally, the facilities consistently failed to investigate uses of force and failed to properly discipline staff found to have used excessive force. (Department of Justice, 2010)
In addition to this extreme and unconstitutional use of force, the investigation found that the facilities failed to provide adequate support for addiction and mental health issues. Psychotropic medications were being prescribed to youth without appropriate monitoring for dangerous side effects.
The then reform-minded Commissioner of the Office of Children and Family Services, Gladys Carrión, responded by closing Tryon and a number of other juvenile justice facilities in New York State. Commissioner Carrión had been deeply disturbed by the conditions in facilities like Tryon, and believed that a radical transformation of the juvenile justice system was necessary. She was reported to say, “I am not running the Economic Development Agency for upstate New York… I will no longer export black and brown kids to finance the upstate economy” (Dwoskin, 2010).
State law required that a one year notice be given to employees before the closure of a facility like Tryon. Despite this buffer, local economic development stakeholders seemed to have been blindsided by the decision to close the prison. The decision was especially shocking because major capital improvements were being made on the site as the closure was being
implemented. A two million dollar renovation was made to the school building’s air conditioning system right before Tryon closed. It seems that there was little public participation involved in the decision to close the facility and the buildings were left without much consideration for their immediate or long-term future.
Gaining Site Control for Redevelopment
After closure of the prison, Fulton County quickly decided to capitalize on this opportunity and replicate a model at Tryon that had been successful on other large vacant sites in the county. Because the county had been heavily reliant on the leather and glove industries in the early twentieth century, the decline of these industries left the economy extremely vulnerable. To prevent history from repeating itself, local economic development stakeholders made a commitment to diversifying the economy, and this led to the development of two industrial parks
—
Crossroads Industrial Park in the late 1980s (55 acres) and Johnstown Industrial Park (300 acres) in the early 1990s. The inventory of small and large sites in these two parks led Fulton County to attract companies like Walmart, Benjamin Moore Paints, FAGE (yogurt manufacturing) and Euphrates (feta cheese manufacturing). But by 2011, when Tryon closed, the county was running out of its inventory of ‘shovel ready sites’8 for new companies. Tyron’sclosure presented an opportunity to attract new companies to the county and further diversify the local economy.
In August 2011, only three months after the closure, Fulton County submitted a proposal requesting that the state deed the property over to the Fulton County Industrial Development Agency (IDA). The IDA is a public benefit corporation that was created in 1970 and is closely affiliated with the Fulton County Planning Department. The IDA has a board of seven members who are appointed by the County Board of Supervisors. The current Executive Director of the IDA, Jim Mraz, is also the Director of the Fulton County Planning Department. The request for transfer of the site to the IDA was strategic. Because of local laws, if the property was
transferred either to the town or the county, any land that was sold within the site would have to go through a public auction and be sold to the highest bidder. The transfer to the IDA allowed the county to court specific companies for the site, and not worry about those companies being outbid by other potential buyers. The county wanted redevelopment on the site to be controlled, intentional and focused towards a cohesive vision. Based on the location of the site, its
proximity to other manufacturing and technology centers in Syracuse and Utica, and Fulton County’s successful track record with industrial parks, Fulton County Government and the IDA jointly decided to repurpose the Tryon site into a technology park.
8 These sites are connected to important utilities like water, gas, sewer and electricity, and are appropriately zoned for development.