ORIGINAL ARTICLE
Absolute and regional cerebral perfusion assessment feasibility in head-down position
with arterial spin-labeling magnetic resonance on healthy subjects. Preliminary report.
Aude Pavilla
1,2, MSc, Alessandro Arrigo
1, MD,PhD, Sylvie Colombani
1, MD, Mehdi
Mejdoubi
1, MD, PhD
1
Department of Neuroradiology, Pierre-Zobda-Quitman Hospital, University Hospital of Martinique, French West Indies, France; 2 LTSI, INSERM UMR 1099, Université de Rennes 1,Rennes, F-35000, France.
Correspondence: Aude Pavilla, Department of Neuroradiology, Pierre-Zobda-Quitman Hospital, University Hospital of Martinique, French West Indies. Tel: +596 596 55 21 81; Fax: +596 596 75 16 68; E-mail: aude.pavilla@gmail.com
ORIGINAL ARTICLE
Absolute and regional cerebral perfusion assessment feasibility in head-down position
with arterial spin-labeling magnetic resonance.A preliminary report on healthy
subjects.
Purpose: HD-positioning, used in some stroke centers during early ischemic stroke management, is empirical but supported by some physiological findings.It has been shown by non-MR methods that this position can increase cerebral perfusion. This study aimed to investigate magnetic resonance imaging (MRI) ability to measure the response to head down tilt (HDT) challenge in healthy volunteers. Cerebral blood flow (CBF) was assessed with arterial spin labeling (ASL)in supine and HD (–15°) positions.
Methods: Cerebral perfusion was measured in supine and HD positions in seven healthy subjects at 1.5 T with a large magnet bore (70 cm) MR device. 3D-pseudo–continuous arterial spin-labeling (pCASL) sequences were acquired in both positions and cerebral blood-flow (CBF) maps were reconstructed. Regions of interest were: subcortical grey matter structures (Accumbens nuclei, Amygdala, Caudate nucleus, Hippocampus, Pallidum, Putamen and Thalamus), whole cortical grey matter andwhole white matter.
Results:White matter and subcortical gray matter structures CBF, averaged over the volunteers’ sample, remained stable from supine to HD position. Accumbens nuclei and cortical grey matter CBF decreased by 11.5% (P= 0.013) and 11.4% (P=0.018) when head position was changed from flat to -15°.
Conclusions: RegionalCBF assessment especially in HDT is challenging with most perfusion techniques because of ionizing radiations, inherent limitations and logistical considerations. This preliminary report presents a non-invasive technique assessing regional and absolute cerebral blood flow changesin response to posture change. It can lead to further clinical investigations for a better understanding of cerebral perfusion.
INTRODUCTION
CBF quantification is challenging. Different techniques have been used to assess cerebral perfusion directly or indirectly withthe gold standard being15O-PET1, 2 (positron emission tomography). However, because of radiation exposure and its high cost, the availability of this modality is limited.
The most common noninvasive technique for CBF indirect assessment is transcranialDoppler3,
4
(TCD), which provides a good temporal resolution. With TCD, blood-flow velocity can be continuously monitored in the main supply arteries, usually the middle cerebral artery (MCA). The vessel cross-sectional area is the proportionality coefficient between flow and velocity. However, TCD can only assess relative and hemispheric CBF changes. Moreover velocity is measured only in the MCA trunk while microvascular blood flow in deep cerebral parenchyma is poorly assessed. Near infrared spectroscopy (NIRS) 5 and more recently diffuse correlation spectroscopy6 are also noninvasive and allow continuous monitoring of deoxyhemoglobin and oxyhemoglobinin cortical regions. Like TCD, NIRS anddiffuse correlation spectroscopycan assess cerebral perfusion during position changes but, again, it only estimates relative changes.Imaging techniques like single photon-emission computed tomography(SPECT), positron-emission tomography (PET)7 and perfusion computed tomography(CT) 8 can evaluate CBF, but continuous CBF measurement or repeated assessments within brief intervals (<24 hours) are not possible, because of contrast-agent persistence or potential side effects.
Magnetic resonance (MR)-perfusion techniques visualize global or regional absolute CBF and correlate positively with TCD and 15O-PET1, 9.
However, due to small-bores, MRI was so far restricted to supine position anddid not allow position changes.Moreover, the first MR-perfusion assessment technique was done through dynamic susceptibility contrast (DSC) 11, requiring an intravenous contrast agent based on gadolinium chelates.Gadolinium persistence in vessels prevents repeated CBF assessments at brief intervals. Arterialspin-labeling (ASL) is an MR technique providing images of absolute regional CBF without contrast-agent injection, used in perfusion assessment12-13.
HD-positioning, used in some stroke centers during early ischemic stroke management, is empirical but supported by some physiological findings. In acute ischemic stroke patients, this position may be used to increase cerebral perfusion6,10. Most studies dealing with posture influence on cerebral perfusion usually
investigate global effect on perfusion and assess relative cortical perfusion6,10. The aim of this preliminary study was to assess the feasibility ofregional and global CBF changes measurements with ASL MRI in head down (HD) position.
MATERIALS AND METHODS
Subjects
Seven healthy subjects (2 women, 5 men) were enrolled. Mean age was 33.4±7.7 (range 26–42) years. They all underwent a physical examination and gave their informed consent. All were nonsmokers, normotensive, without diabetes and none was on medication. No caffeine or alcohol intake was allowed the day of the MRI and, for women of procreation age, the test was performed soon after their menstrual periods. The protocol was approved by the local ethics committee and received institutional review board agreement. Our procedures were in accordance with the Helsinki Declaration of 1975 (and as revised in 1983).
Head Down Tilt Protocol
Angles of 0° and -15° were sequentially evaluated. Measurements at 0° (supine) were considered as the baseline against which HD position (-15°) angle was compared. Supine position was carried out before HD position. To achieve the HD position, the subject was carefully positioned on a customized foam mattress (with 40° angulation over 20 cm at one end; Figure 1), avoiding neck extension or compression of jugular veins or carotid arteries, with a mean –15° angle between the upper thorax and head. The head was approximately 20 cm below the heart, whereas the lower body remained flat. In each position, a 3D-ASL sequence was obtained after 4 minutes of equilibration.
Cerebral Blood Flow Measurement
MRI measurements were obtained with a large bore (70 cm) 1.5-T MR magnet (MR450w, GE, Milwaukee, WI, USA). We used a standard head–neck–spine array (8-channel head coil).
Axial T1 weighted images were acquired using a 3D gradient echo (GRE) sequence for segmentation purpose. 3DT1 images were acquired in supine position. Acquisition parameters were set as following:
repetition time (TR) / echo time (TE):10.796 ms/ 4.4 ms , inversion time (TI): 500 ms, Bandwidth: ± 88,79 kHz , field of view (FOV) : 240 x 240 mm², matrix size was 256x 288, in plane resolution: 0.94x0.83 mm² and slice thickness 1.4 mm for a total acquisition time of 2 minutes.
3D-FSE (fast spin echo) pseudo-continuous ASL (pCASL)sequences were obtained in both positions with following parameters: flip angle, 155°; TR/TE, 4554 ms/10.7ms; labeling time, 1525 ms; post-labeling delay, 1525 ms; Distance between labeling and image plane: ~ 10 cm , FOV, 240x240 mm²; matrix, 512 points x 8 arms (spiral acquisition); slice thickness, 4 mm; no gap; 60 images (30 control and 30 labeled), 4 mm3 isotropic resolution, NEX=3, for a total acquisition time of 4 min and 28s. The image acquisition plane was the same in both positions.
Post-processing
For pCASL processing, subtracted raw images were post-processed using GE Readyview software on an Advantage Windows 4.6 workstation (GE Medical Systems), generating CBF maps in units of milliliters per 100 grams per minute.CBF quantification was calculated as follows using a conventional single compartment model as previously described12.
For each subject, T1 skull-stripped images were generated by running the FSL Brain Extraction Tool software (BET, http://www.fmrib.ox.ac.uk/fsl/bet2/index.html) on the high resolution T1 images. 3DT1 sequence was performed only in supine position and was then coregistered with ASL raw data in both supine and HD positions (after proper reorientation).
T1 images were segmented into three tissue classes (Figure 2) in its original resolution using FMRIB's Automated Segmentation Tool (FAST, http://www.fmrib.ox.ac.uk/fsl).
Grey matter (GM) and white matter (WM) binary masks (with a 0.9 threshold) were obtained for further quantitative analyzes on CBF maps thus limiting partial volume effects. Deep subcortical grey matter (scGM) structures segmentation was performed with FSL FIRST (FMRIB's Integrated Registration and Segmentation Tool). Accumbens nuclei, Amygdala, Caudate nucleus, Hippocampus, Pallidum, Putamen and Thalamus volumes of interest (VOIs) were obtained (Figure 2) and converted into binary masks for coregistation with CBF maps in supine position. A whole cortical GM (cGM) mask was also computed from those structures. The same processing protocol was applied for CBF maps in HD position.
Statistical Analysis
Non normal data distribution was assumed and not tested owing to the low number of data. CBF changes were analyzed using nonparametric Wilcoxon rank tests with Statview software (SAS Institute v5.0, Cary, NC, USA). Following T1 images segmentation and coregistration with ASL, mean right-and-left subcortical GM (scGM), whole WM and whole cortical GM (cGM) VOIs were obtained.
Corresponding absoluteregional CBF valueswere compared between supine and HD positions. P<0.05 defined significance for all tests.
RESULTS
The HD position was clinically well-tolerated by all subjects.
In supine position, CBF was higher in cortical GM (cGM) than in subcortical GM (scGM) and WM (respectively P=0.028 and P=0.018). CBF in scGM was significantly higher than in WM (P=0.018).
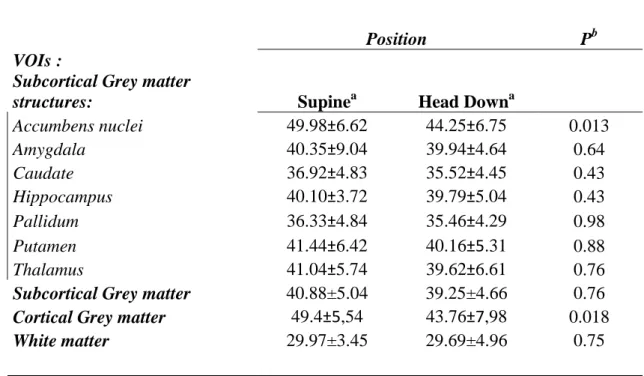
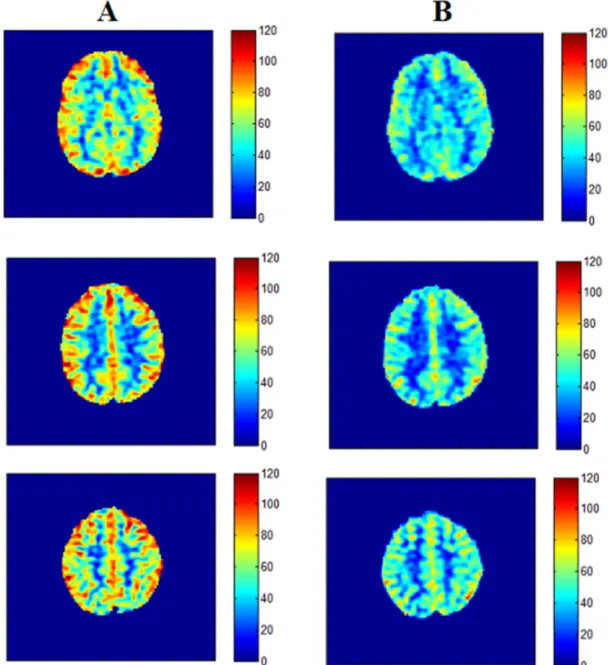
From supine to HD position (Table 1), CBF declined significantly by 11.4±0.3 %in cGM (P=0.018) and 11.5±0.3% in accumbens nuclei (P=0.013). CBF values remained stable in all other subcortical GM structures and WM. Among subcortical GM, pallidum had the lowest CBF values. Figure 3 illustrates significant cortical CBF variations in one subject.
DISCUSSION
ASL technique is a noninvasive tool to assess absolute and regional CBF. In supine position, CBF in WM was very low compared to other ROIs, but it is known that CBF varies among WM regions, from 33 to 45 mL/100 g/minute according to Tarumi et al14. Higher CBF values were observed in cortical GM in comparison to subcortical GM regions as reported elsewhere in literature15. The lowest GM perfusion was found in pallidum as reported elsewhere due to its high concentration of iron shortening the local T115.
Recently, Favilla and al.6 measured with diffuse correlation spectroscopy an increase in cortical CBF associated with lower head of bed angle in acute ischemic stroke patients. It is generally assumed that this position may increase CBF6, 10, 16.
feasible with ASL MRI. From supine to HD position, CBF remained steady in white matter and in most subcortical GM regions while simultaneously decreasing significantly in cortical GM (–(11.4±0.3) %) and accumbens nuclei (-(11.5±0.3)%) when averaged across healthy volunteers. Decreased perfusion in accumbens nuclei may be explained by anxiety accompanying the exam. It is welldocumented that those nuclei are involved in emotional and key-reward processing regions17.
This diminished CBF was also observed by Lucas etal5, who measured a lowercortical oxygenationafter pharmacologically inducedchanges in mean blood pressure.
Unchanged perfusion in subcortical GM structures and white matterwith posture change can be explained by cerebral auto regulation processes as suggested in Gelinas et a1.study18. In this study, 21 healthy volunteers were randomly exposed to 90° HD and 90° head-up positions. Theyobserved that MCA blood flow velocity remained stable, while mean arterial pressure increased significantly. They concludedthat perfusion was remarkably well-maintained.
Two quite recent MRI technological advances enabled the design of our study. First, ASL MR perfusionallows noninvasive repeated (but not continuous) cerebral perfusion measurements with regional, absolute and reproducible CBF quantification. Second, a large 70-cm magnet bore, available in commercial MR devices since 2005, allows moderate changes of the subject’s position. HD positioning, despite minor discomfort, was well-tolerated by all subjects and we were able to acquire MR images.
Our pCASL sequence employed adiabatic labeling and background suppression pulses, a fast spin echo (FSE) acquisition, and a quantification approach based on a separate reference image to minimize, non-uniformities of the radiofrequency transmit and receive fields and the static magnetic field contribution.
Caution was made to place labeling plane orthogonally to large tagged arteries direction for similar labeling efficiency in both positions. Influence of head tilt on labeling efficiency could beinterestingly studied in future investigations.
Ourstudy is nevertheless only a preliminary report that should be completed on several axes. First, cerebral perfusion was evaluated only few minutes after HD-positioning, corresponding to an early cerebral autoregulation stage. Moreover, we studied here a rather small sample while CBF can be modified by other parameters such as age or sex.Supine position was systematically carried out before HD position which may represent a bias. This study may be completed by larger series considering individual variability and would
also benefit from cerebrovascular reactivity co-investigation19 to establish correlations with CBF regional changes. Concerning regions of interest, we studied the overall cortical GM perfusion with HD positioning. Cortical segmentation, in order to distinguish each cortical territory specific response would be a further interesting topic.
CONCLUSION
We present a preliminary study that reports the feasibility of measuring CBF changes with HD positionbyMRI. White matter and subcortical gray matter structures perfusion remained unchanged with HD positioning whereas accumbens nuclei and cortical grey matter perfusion decreased significantly. The present study represents an initial step to explore regional and absolute cerebral blood flow changes in response to posture change with ASL. It could be of great interest for a better understanding of cerebral perfusion in physiologic and pathologic conditions.
Disclosure of interest
REFERENCES
1. Carroll TJ, Teneggi V, Jobin M, Squassante L, Treyer V, Hany TF et al. Absolute quantification of cerebral blood flow with magnetic resonance, reproducibility of the method, and comparison with H2 15
O positron emission tomography. J Cereb Blood Flow Metab 2002; 22: 1149–1156.
2. Grüner JM, Paamand R, Højgaard L, Law I. Brain perfusion CT compared with 15O-H2O-PET in
healthy subjects. EJNMMI Res 2011; 1: 28.
3. Aries MJ, Bakker DC, Stewart RE, De Keyser J, Elting JW, Thien T et al. Exaggerated postural blood pressure rise is related to a favorable outcome in patients with acute ischemic stroke. Stroke 2012; 43: 92–96.
4. Saeed NP, Horsfield MA, Panerai RB, Mistri AK, Robinson TG. Measurement of cerebral blood flow responses to the thigh cuff maneuver: a comparison of TCD with a novel MRI method. J Cereb Blood Flow Metab 2011; 31: 1302–1310.
5. Lucas SJ, Tzeng YC, Galvin SD, Thomas KN, Ogoh S, Ainslie PN. Influence of changes in blood pressure on cerebral perfusion and oxygenation. Hypertension 2010; 55: 698–705.
6. Favilla C, Mesquita R, Mullen M, Durduran T, Kim M, Minkoff D, Kasner S, Joel G, Yodh A and DetreJ ,Optical Bedside Monitoring of Cerebral Blood Flow in Acute Ischemic Stroke Patients During Head-of-Bed Manipulation,Stroke. 2014 ;45(5):1269-74.
7. Ito H, Kanno I, Takahashi K, Ibaraki M, Miura S. Regional distribution of human cerebral vascular mean transit time measured by positron emission tomography. Neuroimage 2003; 19: 1163–1169. 8. Mejdoubi M, Calviere L, Dumas H. Value of CT perfusion for the diagnosis of early middle cerebral
artery stroke. J Radiol 2010; 91: 555–660.
9. Sorond FA, Hollenberg NK, Panych LP, Fisher NDL. Brainbloodflow and velocity: correlations between magnetic resonance imaging and transcranial Doppler sonography. J Ultrasound Med 2010; 29: 1017–1022.
10. Schwarz, S., Georgiadis, D., Aschoff, A., & Schwab, S. Effects of body position on intracranial pressure and cerebral perfusion in patients with large hemispheric stroke. Stroke, 33(2), 497-501, 2002.
11. Knutsson L, Ståhlberg F, Wirestam R., Absolute quantification of perfusion using dynamic susceptibility contrast MRI: pitfalls and possibilities, Magma. 2010 Feb;23(1):1-21.
12. Detre JA, Alsop DC.Perfusion magnetic resonance imaging with continuous arterial spin labeling: methods and clinical applications in the central nervous system. Eur J Radiol. 1999 May;30(2):115-24.
13. Labriffe, M., TerMinassian, A., Pasco-Papon, A., N’Guyen, S., Aubé, C. (2015). Feasibility and validity of monitoring subarachnoid hemorrhage by a noninvasive MRI imaging perfusion technique: Pulsed Arterial Spin Labeling (PASL). Journal of Neuroradiology.
14. Tarumi T, Shah F, Tanaka H, Haley AP. Association between central elastic artery stiffness and cerebral perfusion in deep subcortical gray and white matter. Am J Hypertens 2011; 24: 1108–1113.
15. Pfefferbaum A, Chanraud S, Pitel AL, Shankaranarayanan A, Alsop DC, Rohlfing T et al. Volumetric cerebral perfusion imaging in healthy adults: regional distribution, laterality, and repeatability of pulsed continuous arterial spin labeling (PCASL). Psychiatry Res 2010; 182: 266–273.
16. Nagatani K, Nawashiro H, Takeuchi S, Otani N, Wada K, Shima K. Effects of a head-down tilt on cerebral blood flow in mice during bilateral common carotid artery occlusion. Asian J Neurosurg 2012; 7: 171–173.
17. Wolf Dh, Pinkham AE, Satterthwaite TD, Ruparel K, Elliot MA, Valdez J, Smith MA , Detre JA , Gur RC, GurRE. Oral alprazolam acutely increases nucleus accumbens perfusion, Mol Psychiatry. 2013; 18(9): 960–961.
18. Gelinas JC, Marsden KR, Tzeng YC, Smirl JD, Smith KJ, Willie CK et al. Influence of posture on the regulation of cerebral perfusion. Aviat Space Environ Med 2012; 83: 751–757.
19. Boudiaf N, Attyé A, Warnking JM, Troprès I, Lamalle L, Pietras J, Krainik A. BOLD fMRI of cerebrovascular reactivity in the middle cerebral artery territory: A 100 volunteers’ study. Journal of Neuroradiology, 2015.
Table 1 Regional cerebral blood flows (in mL/100 g/min) in supine and head-down positions
Position Pb
VOIs :
Subcortical Grey matter
structures: Supinea Head Downa
Accumbens nuclei 49.98±6.62 44.25±6.75 0.013 Amygdala 40.35±9.04 39.94±4.64 0.64 Caudate 36.92±4.83 35.52±4.45 0.43 Hippocampus 40.10±3.72 39.79±5.04 0.43 Pallidum 36.33±4.84 35.46±4.29 0.98 Putamen 41.44±6.42 40.16±5.31 0.88 Thalamus 41.04±5.74 39.62±6.61 0.76
Subcortical Grey matter 40.88±5.04 39.25±4.66 0.76 Cortical Grey matter 49.4±5,54 43.76±7,98 0.018
White matter 29.97±3.45 29.69±4.96 0.75
a
All values are means ± s.d. of left-and-right sides. b
Titles and legends to figures
Figure 1. Subject on the MRI table in a supine position (A) and after adding the customized foam mattress to raise the body and obtain a –15° head-down position (B).
Figure 2. Binary masks derived for coregistration with CBF maps (A) WM ; (B) subcortical GM structures (clear blue: caudate; blue: pallidum; pink: putamen; green : thalamus); (C) cGM in native T1’s space subject. Figure 3. Example of cerebral blood-flow variations between supine position (A) and head-down re-aligned to supine position (B) positions in a 26-year-old female subject.
Figure 1. Subject on the MRI table in a supine position (A) and after adding the customized foam mattress
to raise the body and obtain a –15° head-down position (B).
Figure 2. Binary masks derived for coregistration with CBF maps (A) WM ; (B) subcortical GM structures
Figure 3. Example of cerebral blood-flow variations between supine position (A) and head-down re-aligned to supine position (B) positions in a 26-year-old female subject.
ANNEXE
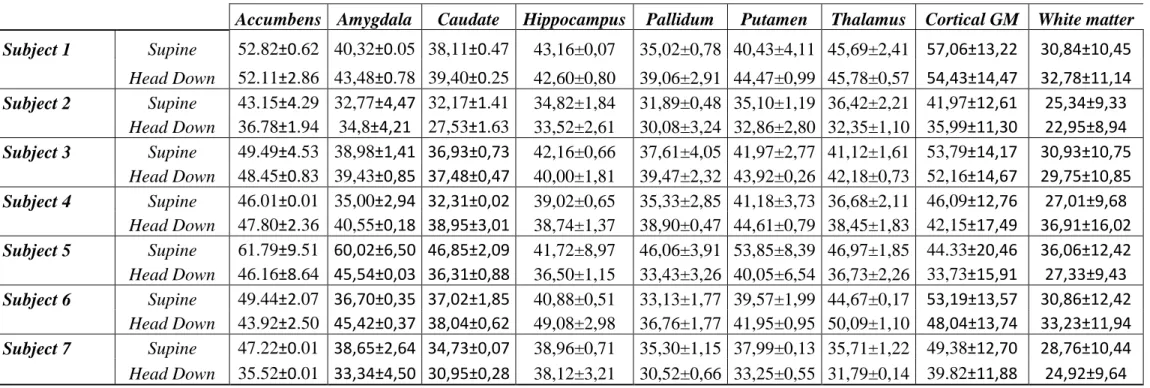
Table 2 Individual results for each VOI expressed in mean±standard deviation (sd) CBF (in mL/100g/min) in both supine and HD positions.
Accumbens Amygdala Caudate Hippocampus Pallidum Putamen Thalamus Cortical GM White matter
Subject 1 Supine 52.82±0.62 40,32±0.05 38,11±0.47 43,16±0,07 35,02±0,78 40,43±4,11 45,69±2,41 57,06±13,22 30,84±10,45 Head Down 52.11±2.86 43,48±0.78 39,40±0.25 42,60±0,80 39,06±2,91 44,47±0,99 45,78±0,57 54,43±14,47 32,78±11,14 Subject 2 Supine 43.15±4.29 32,77±4,47 32,17±1.41 34,82±1,84 31,89±0,48 35,10±1,19 36,42±2,21 41,97±12,61 25,34±9,33 Head Down 36.78±1.94 34,8±4,21 27,53±1.63 33,52±2,61 30,08±3,24 32,86±2,80 32,35±1,10 35,99±11,30 22,95±8,94 Subject 3 Supine 49.49±4.53 38,98±1,41 36,93±0,73 42,16±0,66 37,61±4,05 41,97±2,77 41,12±1,61 53,79±14,17 30,93±10,75 Head Down 48.45±0.83 39,43±0,85 37,48±0,47 40,00±1,81 39,47±2,32 43,92±0,26 42,18±0,73 52,16±14,67 29,75±10,85 Subject 4 Supine 46.01±0.01 35,00±2,94 32,31±0,02 39,02±0,65 35,33±2,85 41,18±3,73 36,68±2,11 46,09±12,76 27,01±9,68 Head Down 47.80±2.36 40,55±0,18 38,95±3,01 38,74±1,37 38,90±0,47 44,61±0,79 38,45±1,83 42,15±17,49 36,91±16,02 Subject 5 Supine 61.79±9.51 60,02±6,50 46,85±2,09 41,72±8,97 46,06±3,91 53,85±8,39 46,97±1,85 44.33±20,46 36,06±12,42 Head Down 46.16±8.64 45,54±0,03 36,31±0,88 36,50±1,15 33,43±3,26 40,05±6,54 36,73±2,26 33,73±15,91 27,33±9,43 Subject 6 Supine 49.44±2.07 36,70±0,35 37,02±1,85 40,88±0,51 33,13±1,77 39,57±1,99 44,67±0,17 53,19±13,57 30,86±12,42 Head Down 43.92±2.50 45,42±0,37 38,04±0,62 49,08±2,98 36,76±1,77 41,95±0,95 50,09±1,10 48,04±13,74 33,23±11,94 Subject 7 Supine 47.22±0.01 38,65±2,64 34,73±0,07 38,96±0,71 35,30±1,15 37,99±0,13 35,71±1,22 49,38±12,70 28,76±10,44 Head Down 35.52±0.01 33,34±4,50 30,95±0,28 38,12±3,21 30,52±0,66 33,25±0,55 31,79±0,14 39.82±11,88 24,92±9,64