HAL Id: hal-03216000
https://hal.archives-ouvertes.fr/hal-03216000
Submitted on 3 May 2021
HAL is a multi-disciplinary open access
archive for the deposit and dissemination of
sci-entific research documents, whether they are
pub-lished or not. The documents may come from
teaching and research institutions in France or
abroad, or from public or private research centers.
L’archive ouverte pluridisciplinaire HAL, est
destinée au dépôt et à la diffusion de documents
scientifiques de niveau recherche, publiés ou non,
émanant des établissements d’enseignement et de
recherche français ou étrangers, des laboratoires
publics ou privés.
Reinforcement in Polypropylene and Polyethylene
Biocomposite Materials: A New Perspective for the
Valorization of This Agricultural By-Product
Gabriela Espadas-Aldana, Priscila Guaygua-amaguaña, Claire Vialle,
Jean-Pierre Belaud, Philippe Evon, Caroline Sablayrolles
To cite this version:
Gabriela Espadas-Aldana, Priscila Guaygua-amaguaña, Claire Vialle, Jean-Pierre Belaud, Philippe
Evon, et al.. Life Cycle Assessment of Olive Pomace as a Reinforcement in Polypropylene and
Polyethylene Biocomposite Materials: A New Perspective for the Valorization of This Agricultural
By-Product. Coatings, MDPI, 2021, 11 (5), pp.525. �10.3390/coatings11050525�. �hal-03216000�
OATAO is an open access repository that collects the work of Toulouse
researchers and makes it freely available over the web where possible
Any correspondence concerning this service should be sent
to the repository administrator:
tech-oatao@listes-diff.inp-toulouse.fr
This is a publisher’s version published in:
https://oatao.univ-toulouse.fr/27784
To cite this version:
Espadas-Aldana, Gabriela and Guaygua‐Amaguaña, Priscila
and Vialle, Claire and Belaud, Jean-Pierre and Evon,
Philippe and Sablayrolles, Caroline Life Cycle Assessment of
Olive Pomace as a Reinforcement in Polypropylene and
Polyethylene Biocomposite Materials: A New Perspective for the
Valorization of This Agricultural By‐Product. (2021) Coatings, 11
(5). 525. ISSN 2079-6412
Official URL :
Article
Life Cycle Assessment of Olive Pomace as a Reinforcement in
Polypropylene and Polyethylene Biocomposite Materials: A
New Perspective for the Valorization of This Agricultural
By‐Product
Gabriela Espadas‐Aldana 1,*, Priscila Guaygua‐Amaguaña 2, Claire Vialle 1, Jean‐Pierre Belaud 2, Philippe Evon 1
and Caroline Sablayrolles 1 1 Laboratoire de Chimie Agro‐industrielle, Université de Toulouse, INRA, ENSIACET, 4 Allée Emile Monso, CS 44362, 31030 Toulouse, France; claire.vialle@inp‐toulouse.fr (C.V.); philippe.evon@inp‐toulouse.fr (P.E.); caroline.sablayrolles@inp‐toulouse.fr (C.S.) 2 Laboratoire de Génie Chimique, Université de Toulouse, CNRS, ENSIACET, 4 Allée Emile Monso, CS 84234, 31432 Toulouse, France; priscila.guayguaamaguana@etu.toulouse‐inp.fr (P.G.‐A.); jeanpierre.belaud@inp‐toulouse.fr (J.‐P.B.) * Correspondence: gabriela.espadasaldana@inp‐toulouse.fr Abstract: The main environmental impact of olive oil production is the disposal of residues such as pomace and water vegetation. During the olive oil extraction process, the olive stone is milled and discharged within the olive pomace. However, olive stone flour can be valorized as filler for poly‐ meric composites. A life cycle assessment of the olive pomace valorization was carried out by fo‐ cusing on the manufacturing process of a biocomposite made of two different thermoplastic matri‐ ces, i.e., polyethylene and polypropylene. The functional unit is the production of 1 m2 of a lath
made of an olive pomace‐based biocomposite. The analysis was carried out with the SimaPro PhD 9.1.1.1 software, and the database used for the modeling was Ecoinvent 3.6. The obtained results reveal that the hotspot of the whole process is the twin‐screw compounding of the olive stone frac‐ tion, with the polymeric matrix and coupling agent, and that human health is the most affected damage category. It represents 89% for both scenarios studied: olive stone fraction/polypropylene (OSF/PP) and olive stone fraction/polyethylene (OSF/PE). Further research directions include the use of biosourced polymer matrices, which could reduce the impact of olive pomace‐based compo‐ site manufacturing. Keywords: olive stone; biocomposite; LCA; circular economy; filler 1. Introduction Olive oil is one of the main agricultural products in the Mediterranean countries. The organoleptic and healthy properties of olive oil associated with its high consumption level have made the cultivation of olive trees expand worldwide, along with its consumption trends. The production of olive oil includes several phases. First, the olives are washed in order to remove the impurities collected during the harvesting (e.g., leaves, twigs, stones, etc.). After washing, the olives are crushed to facilitate the release of the oil from the vac‐ uoles. Then, the crushed olives are subjected to a malaxation process, where the paste is mixed, allowing small oil droplets to combine into bigger ones. The last step is the sepa‐ ration of the oil from the rest of the olive components. The oil can be extracted by mechan‐ ical pressing (i.e., a discontinuous process) or centrifugation (i.e., a continuous process) [1,2]. Citation: Espadas‐Aldana, G.; Guaygua‐Amaguaña, P.; Vialle, C.; Belaud, J.‐P.; Evon, P.; Sablayrolles, C. Life Cycle Assessment of Olive Pomace as a Reinforcement in Polypropylene and Polyethylene Biocomposite Materials: A New Perspective for the Valorization of This Agricultural By‐Product. Coatings 2021, 11, 525. https://doi.org/10.3390/ coatings11050525 Academic Editor: Devis Bellucci Received: 21 April 2021 Accepted: 28 April 2021 Published: 29 April 2021
Publisher’s Note: MDPI stays neu‐ tral with regard to jurisdictional claims in published maps and institu‐ tional affiliations. Copyright: © 2021 by the authors. Licensee MDPI, Basel, Switzerland. This article is an open access article distributed under the terms and con‐ ditions of the Creative Commons At‐ tribution (CC BY) license (http://cre‐ ativecommons.org/licenses/by/4.0/).
It is worth noting that the pressing method is the oldest system for olive oil extrac‐ tion, known as the traditional method. Nevertheless, it is still used in some small mills and has a processing extraction yield of around 86%–90% [3]. The centrifugation method covers the need for a continuous extraction process. This method works on the basis of centrifugal force, where the less dense liquid phase forms a concentric inner layer, whereas the denser solid particles are pushed against the wall of the rotating bowl [3]. This extraction process presents two operation alternatives: the three‐phase and the two‐phase horizontal centrifugation methods. The difference between the two‐phase and three‐phase horizontal centrifugation is not whether or not water is added, as it is often mistaken. The difference lies in the number of output streams that the decanter has: On the one hand, the three‐phase centrifuge has as an output for olive oil, vegetable water, also known as olive mill wastewater (OMW) (alpechin in Spanish) and pom‐ ace (orujo in Spanish). On the other hand, the two‐phase centrifuge has as an output for olive oil, and other for wet pomace (alperujo, contraction of alpechin and orujo in Spanish). It should be noted that the two‐phase decanter requires a minimum moisture content of the olive paste (about 50%) to facilitate the separation process. If the olive paste is too dry before being introduced into the decanter, it will be necessary to incorporate a certain amount of water until the moisture level required for a proper operation of the decanter is reached [4]. For this reason, water can be added to the two‐phase centrifuge system as well. Compared to the traditional method, the three‐phase centrifugation device increases water utilization (from 1.25 to 1.75 times more) [3]. Moreover, valuable components, es‐ pecially natural antioxidants, can be lost in the water phase (OMW), thus reducing the olive oil quality. The rising popularity of olive oil has increased the generation of its by‐products: the olive pomace (OP), a general term used to refer to the pomace obtained from all the dif‐ ferent olive oil extraction processes, and an effluent known as OMW, derived from tradi‐ tional pressing and from the three‐phase system, as mentioned before [5,6]. This OP is a mixture of residual skin, pulp, and fragments of the crushed olive stone [7]. The main components of this solid residue are cellulose, hemicelluloses, and lignins. Residual fat and proteins are also present in noteworthy quantities. The moisture content of the solid residues is 22%–25% for traditional pressed olive pomace, 65%–74% for pom‐ ace from a two‐phase system, and 40%–50% for that from a three‐phase one [1,5]. On the other hand, OMW is a red‐to‐black colored acidic liquid, with 83%–92% content of water, its main components being phenolic compounds, sugars, and organic acids. OMW also reveals an important quantity of potassium [5]. On average, olive fruit contains 20 wt.% of oil, and the remaining 80 wt.% together with the added water form OP [8]. Olive oil processing is considered inefficient due to the high volume of waste generated [9]. This particular industry has a seasonal production, which generates a high amount of waste in a short period of time. The olive oil industry causes many environmental impacts in terms of resource depletion, land degradation, air emissions, and waste generation. Moreover, the management of olive oil residues is an economic burden to producers [10–14]. In Europe, the production of OP reaches approxi‐ mately 6.8 million tons per year [15].
Currently, olive oil by‐products are discharged on agricultural land by controlled spreading [5,10,16]. Due to its high content in phenolic and lipidic constituents, organic acids, low pH, and salinity, OP should not be used as agricultural spreading [17]. Moreo‐ ver, OP is resistant to bacterial degradation, which makes it a significant source of envi‐ ronmental pollution [17]. Another use of OP has been in animal nutrition. As an example, it is used in Tunisia in mixture with bran or even cactus to feed dromedaries or sheep. In countries such as Italy and Greece, cows are fed with OP. However, it can cause digestive problems in animals due to its high degree of lignification [18]. On the other hand, OP has
also been used for composting, or to produce a non‐phytotoxic product through biological conversion (bioremediation), which can be used as a fertilizer [5,19,20].
Over the years, many other methods have been proposed for olive oil waste disposal and valorization. These techniques include thermo‐chemical processes, anaerobic diges‐ tion, fermentation, blending, and chemical extraction of bioactive compounds [1,21–23]. Valorization routes also include the production of activated carbons, cosmetic applica‐ tions, the production of polyols, and the improvement of the thermal properties of cement mortar [24–26].
In the most recent years, research has focused on the valorization of OP on the bio‐ composite field [7,17,23,27–33]. Due to their natural richness in lignocellulosic fibers, this sector uses agricultural wastes (or by‐products) as renewable fillers for polymeric matri‐ ces. The obtained results from olive stone flour have confirmed its viability as a cheap reinforcing filler for the polypropylene matrix, thus opening new perspectives for the use of this by‐product [32]. The developed composites could find applications in buildings, in the automotive industry, and as outdoor products, e.g., deck floors, furniture, park benches, etc. Specific examples of this application are those from the GO‐OLIVA project (Spain), which developed Olipast, a new sustainable packaging material from olive pits [34], and from the Biolive company, which commercializes the Bio‐Pura product, used for the manufacture of television components (Turkey). The Biolive company is also working to produce shrink wrap for beer can from this material; and other end products for various applications, including consumer electronic casings, automotive interiors, toys, and pack‐ aging. Approximately 3.5 tons of bioplastics can be transformed from 5 tons of locally sourced olive seeds [35,36]. Since 2015, French authorities have developed “the Energy Transition Law for Green Growth”. This law has focused on waste management as an essential pillar to ensure the transition to a circular economy model [37]. Moreover, the use of the circular economy is becoming increasingly important, especially in the field of agriculture, one of the main suppliers of waste. In particular, much research is being carried out to transform agricul‐ tural residues by sustainable processes. For all these reasons, it is crucial to solve the waste management issues generated by OP and to explore the alternatives to convert this by‐product into a co‐product. Previous publications, like the one by Espadas‐Aldana et al. [12] compiled the studies of environ‐ mental life cycle assessment of olive oil and some waste management techniques. Several authors have focused on the life cycle assessment of olive oil extraction waste treatment [23,38–42]. Here, the current case study is on the valorization of the olive pomace and its life cycle assessment, focusing on the manufacturing process of a biocomposite. To the authors’ knowledge, this is the first environmental life cycle assessment study made on biocomposites from olive pomace in order to innovate on the by‐product valorization from olive oil production. The aim of this article is to evaluate the environmental performance of a biocompo‐ site composed of olive pomace reinforcement and a polymeric matrix. Data for the com‐ pounding process come from a pilot scale experiment to produce lath for terraces. Two scenarios were investigated which are differentiated by the polymeric matrix used: i.e., one made from polyethylene and the other from polypropylene. 2. Materials and Methods Life cycle assessment (LCA) is defined as “a tool to assess the potential environmen‐ tal impacts and resources used throughout a product’s life cycle” [43]. The ISO 14040 [44] standard states that the LCA framework includes four phases: Goal and scope definition, Inventory analysis, Impact assessment, and Interpretation.
2.1. Goal and Scope of the Study The following LCA focuses on the manufacturing process of a biocomposite made of olive stone fraction (OSF), which is part of the olive pomace (OP), and two different pol‐ ymeric matrices: polypropylene (PP) and polyethylene (PE). The goal of this LCA is to analyze and compare the environmental impacts of the different scenarios and to identify the unit process with the strongest environmental im‐ pacts, in order to improve the current valorization of olive pomace. 2.1.1. Functional Unit In order to build the production inventory and set the scope of the study, the func‐ tional unit is defined. Based on similar works [45–47] and EN 15804 [48], the functional unit chosen is the production of 1 m2 of lath (used as building material) made from the olive pomace‐based composite. Figure 1a,b show a diagram of the lath and its dimensions. (a) (b) Figure 1. (a) Profile section of the lath made from the olive pomace‐based composite. (b) Overview of the lath made from the olive pomace‐based composite (measurements are in centimeters). 2.1.2. System Boundary
The ISO 14044 [49] states that the system boundary is a “set of criteria specifying which unit processes are part of a product system”. In order to focus on the impacts re‐ lated to the development of a new biocomposite made from OP as filler, and PP or PE, respectively, as thermoplastic matrix, a “cradle‐to‐gate” approach life cycle assessment
was carried out. This study is centered on the generation of the raw materials and manu‐ facturing of the biocomposites. In Figure 2, system A shows the completed life cycle of the biocomposite; system B comprehends the generation of the raw materials, and the manu‐ facturing process of the composite; system C1 shows the production of the raw materials used in the process; system C2 shows the manufacturing process of the product and the necessary pretreatment (i.e., drying, milling, etc.) to prepare the OP fraction. Finally, sys‐ tem C3 includes the use and end of life of the product. It is important to mention that system B comprehends the complete system boundary of the LCA herein. Namely, the system studied takes into account the production of all the raw materials needed (i.e., OP, PP, PE, and the coupling agents added to the compound to reinforce the matrix/filler in‐ terface), and the production of both composites. Figure 2. System boundary of the study. Several hypotheses must be considered in the actual approach in order to avoid over‐ laps in the decision‐making process: The necessary infrastructure is not taken into account, consequently excluding their manufacture as well as their dismantling, The electricity is considered to come from the mixed French energy supply, The cleaning of the devices used in the process is neglected, The transportation of the olive pomace is not taken into account. The current study presents two different scenarios, which correspond to the mixture of the olive stone and the two different polymeric matrices (Table 1). The polymeric ma‐ trices studied are PP and PE. The OSF acts as a filler in the polymeric matrix [27,28]. Table 1. Scenarios studied.
Filler Polymeric Matrix Scenario
Olive stone fraction Polypropylene OSF/PP
Olive stone fraction Polyethylene OSF/PE
2.2. Life Cycle Inventory Analysis
The life cycle inventory (LCI) collects and compiles all data on elementary flows from all processes in the studied product system(s) drawing on a combination of different sources. The output is a compiled inventory of elementary flows that is used as the basis of the subsequent life cycle impact assessment phase.
2.2.1. Process Tree
Based on the analysis of various publications [7,17,28,30–32,50], all the manufactur‐ ing processes of olive pomace‐based composites presented similar unit operations. First, crude olive pomace is dried in an oven at 60 °C for 24 h. Then, crude olive pomace is milled in a ball mill device at ambient temperature, 86 rpm for 30 min [7].
The powder passes into an electric sieving machine (RITEC, model 400, Signes, France) through a 1.25 mm mesh for 10 min. Two fractions are obtained, the fine fraction corresponds to the pulp‐rich fraction (PF) and is recovered at the bottom of the sieve; whereas, the coarse fraction is retained in the sieve [31].
The coarse fraction is further ground in a knife mill (SM 300, Retch, Haan, Germany), with a speed of 1500 rpm and a grid size of 1 mm [7]. Then, the ground powder is sieved through a 0.4 mm mesh to separate the OSF from the intermediate fraction [7]. Polymer granules and the OP‐based filler were then blended into a twin‐screw extrusion com‐ pounding device. The coupling agents used are PE‐g‐MA (polyethylene‐grafted‐maleic anhydride) and PP‐g‐MA (polypropylene‐grafted‐maleic anhydride) agents, for the PE and PP thermoplastic matrices, respectively.
The presence of dust during the grinding process is very common. The main particle size present is PM10 (particles with the size smaller than 10 μm); nevertheless there are also particles with smaller size, such as PM2.5 (particles with the size smaller than 2.5 μm). Regardless of the milling method, organic dust is always produced when lignocellulosic materials are ground [51]. Dust is harmful to the working environment. Therefore, the particulate matter (i.e., the smallest particles) have to be recovered by a cyclone, and the content conveyed to a dry storage bin [52]. The equipment used for grinding includes a cyclone that recovers all the particulates, and collects them directly on a container [53]. The development of the biobased lath is part of a confidential work carried out by the Laboratoire de Chimie Agro‐industrielle (Université de Toulouse, Toulouse, France) on behalf of a biosourced plastics industrialist [54]. Composites had been produced by mixing the OP (60% filler) in two polymeric matrices: PE and PP. The addition of a cou‐ pling agent has also been carried out to reinforce the matrix/fiber interface. As a result, adding OP to the polymeric matrices showed a mechanical reinforcement of the material, which was illustrated by the increase of the elastic modulus simultaneously with the de‐ crease of the elongation at break, both in tensile and in bending. Figure 3 itemizes the process tree of the manufacturing of the olive stone composite, with the different stages of the process and their flows. 2.2.2. Data Collection Inputs: Raw materials Olive pomace OP is a mixture of different fractions, the pulp‐rich fraction (PF), stone‐rich fraction (OSF) and intermediate fraction, whose percentage weights are 31.3, 56.4, and 11.7%, re‐ spectively [7]. The moisture of the crude olive pomace considered for the process is 53%, which is close to a three‐phase system pomace. The moisture of the material is then de‐ creased to 9% thanks to a drying process [7]. The energy consumption linked to the dry‐ ing, crushing, and sieving of the olive pomace comes from the technical data of the ma‐ chinery used and literature data [53,55–57]. The grinding of the olive husk gave 80% of the weight of the sample [58]. This value was used in the milling of the coarse fraction due to missing data. For the modeling of “Crude olive pomace 53% moisture”, the olive pom‐ ace dataset was adapted from the AGRIBALYSE v3.0 database according to Avadí [59].
Figure 3. Process tree of the olive pomace‐based composite. The above‐mentioned database considers that the impact of olive cultivation is at‐ tributed only to olive oil. Nevertheless, a part of the impact of olive oil production is at‐ tributed to the virgin olive pomace at an economic allocation of 2.32%. These characteris‐ tics belong to the “Olive pomace” file presented in Table 2. Then, this virgin olive pomace follows a new extraction process to obtain pomace oil and de‐oiled pomace. There again, a part of the impact is attributed to the de‐oiled pomace with an economic allocation of 9.47%, named “Olive pomace, processed” (Table 2). Table 2. Background data for the modeling of olive pomace, processed. Adapted from [59]
Process Input/Output Amount Comment
Olive pomace Input ‐ ‐ Substrate 4 kg No impacts from olive agricultural production were included (empty process) Water 0.16 kg Economic allocation key for wet pomace (70% mois‐ ture) by the PEFCR*: 2.32% Energy 0.005 kW∙h Output ‐ ‐ Olive pomace 1.60 kg Virgin olive pomace Olive pomace, pro‐ cessed Input ‐ ‐ Substrate 2.00 kg “Olive pomace” (previous process) Water 0 kg Economic allocation key for dry pomace by the PEFCR*: 9.47% Energy 0.01 kW∙h Energy 0.70 MJ Output ‐ ‐ Olive pomace, processed 0.93 kg De‐oiled olive pomace Water 1.07 kg Calculate by mass difference * PEFCR: Product Environmental Footprint Category Rules for olive oil [60].
Polymeric matrices The word “composite” indicates that two or more separate materials are combined on a macroscopic scale to form a structural unit for various engineering applications. The composite is constituted by the reinforcement (olive stone) and the matrix. Polymers with thermoplastic behavior are usually used as matrix materials in composites [61]. In the present study, the polymers considered for the matrices are PP and PE, as they are very common thermoplastic polymers used for many applications. Being able to orig‐ inate from petrol just as from renewable resources, PE is produced through radical polymerization, anionic polymerization, and cationic polymerization, while PP is ob‐ tained from high temperature cracking of petroleum hydrocarbons and propane. The properties of PP are almost similar to those of PE. However, PP does not present stress‐ cracking problems, and it offers electrical and chemical resistance at high temperatures. Besides, it has a little lower density, and its structure is hard and more rigid [62]. The product studied is 1 m2 of lath made of olive pomace‐based composite. The di‐ mensions of the profile are 10 cm × 3 cm on the outside, and 1.72 cm × 1.8 cm for the 4 interior spaces, and 1 m in length, as shown in Figures 1 and 2. For a superficial area of 1 m2, the total quantity of profiles used is 10. The total area is 0.0174 m2, and the volume of 1 m2 of lath (building material) is 0.0174 m3. For the latter calculation, the hypothesis of lath contiguous (no space between them) was supposed. Table 3 shows the density of each composite and the mass needed for the production of 1 m2 of lath. The density of the composites was taken from the extrapolation of the
results of Uitterhaegen et al. [54].
Table 3. Density and mass for the production of 1 m2 of lath made of olive pomace‐based compo‐
site. Adapted from [54]
Composite Density (kg/m3) Mass (kg)
OSF/PP 1060.9 18.458 OSF/PE 1068.0 18.584 Coupling agents The coupling agent improves the compatibility between the natural fiber and the pol‐ ymeric matrix. The main incompatibility cause of natural fibers and polymer inside com‐ posites is due to the hydrophilic properties of natural fibers and the hydrophobic ones of the thermoplastic matrices. To improve the reinforcement effect of the filler, and especially to ensure efficient load transfer from the matrix to the filler, some authors [27,28,32] used a polymer‐based coupling agent to improve the mechanical properties, especially the maximal strengths, of lignocellulosic‐plastic composites. In the present study, polypropylene‐grafted‐maleic anhydride (PP‐g‐MA) and poly‐ ethylene‐grafted‐maleic anhydride (PE‐g‐MA) were used as coupling agents. The percent‐ age used in the formulation of the composite was 6 wt.% Table 4 shows the data used in the modelling of the coupling agents. In particular, the percentages of maleic anhydride of each compound were taken from the formulation of the commercial compound.
Table 4. Data for the modeling of the coupling agents (PP‐g‐MA, PE‐g‐MA).
Process Input/Output Amount Comment Ref.
PP‐g‐MA Input ‐ ‐ ‐ Maleic anhydride 0.09 kg 8‐10%wt, an average between the two values was taken as reference. [63] Polypropylene 0.91 kg ‐ ‐ Output ‐ ‐ ‐ PP‐g‐MA 1.00 kg The data considered for the modeling is the formulation of the commercial compound. ‐ PE‐g‐MA Input ‐ ‐ ‐ Maleic anhydride 0.005 kg ~0.5 wt.% [64] Polyethylene 0.995 kg ‐ ‐ Output ‐ ‐ ‐ PE‐g‐MA 1.00 kg The data considered for the modeling is the formulation of the commercial compound. ‐ Outputs: By‐products of the olive stone composite manufacturing The by‐products obtained during the processing of the composite (Figure 3), such as olive stone dust and intermediate and fine fractions, can be used as biofuels. The most common waste management approach for the by‐products is incineration [28]. As with other fuels, the heating value depends on the moisture content and ranges from around 17 MJ/kg (moisture 10%) to 20 MJ/kg (moisture 6%) [65]. Incineration of natural fibers results in recovery of energy and carbon credits [66]. Another common waste manage‐ ment approach is composting [23,40].
Boiler combustion of olive stone dust
Olive mills used combustion to obtain thermal or electric energy, due to the high calorific power of the dried olive husk (4000 kcal/kg) [67]. However, the energy obtained by combustion is used for dryness of the fresh two‐phase olive waste mill, which de‐ creases the total energy recovery [10,68]. Wood lower heating values (LHVs) range between 10.5 MJ/kg for wet wood and 18.6 MJ/kg for dry wood [69]. The properties of the olive pomace present more advantages than other biomass. In‐ deed, it has a low sulfur content between 0.12% and 0.26%, and an LHV in the range of 16.4–18.6 MJ/kg [10]. Moreover, the LHV of olive stone presents similar values in the range of 16.2–19.2 MJ/kg. Table 5 shows some LHVs of olive stone found in the literature. It is worth mentioning that olive pit is another term used to refer to the olive stone. Table 5. Lower heating value of olive stone. Type of Waste Lower Heating Value (MJ/kg) Reference Olive pit 19.0 [70] Olive pit 16.2 [71] Olive pit 17.3 [72] Olive pit 19.2 [73] Olive stone 16.3 [74] Olive stone 17.0 [75] For the modeling of the “boiler combustion” on SimaPro (PhD 9.1.1.1, PRé Sustaina‐ bility, Amersfoort, The Netherlands), the combustion of natural wood chips from forest (Heat production, untreated waste wood, at a furnace 1000–5000 kW CH) was chosen as
process reference. Included activities start from the delivery of waste wood to the com‐ bustion of untreated waste wood chips. It comprises the infrastructure (dust collector, fur‐ nace), the wood requirements (LHV), the emissions to air, the electricity needed for its operation, and the disposal of the ashes. The LHV of wood used in the file was 14.0 MJ/kg. On the other hand, the LHV of olive stone is bigger than that of wood. Therefore, a corrective factor between the olive stone and wood was used in order to adjust the mod‐ eling. The following data were used for comparing the olive stone per kg of wood. The LHV of wood is 14.0 MJ/kg and the average LHV of an olive pit is 17.5 MJ/kg. After comparing these values, the amount of olive pit that would replace the wood in the boiler is 0.80 kg olive pit per kg of wood. An example is the milling process, where the quantity of olive pit dust produced is 0.20 kg. This value was replaced by 0.25 kg of wood as a factor of 0.80 kg olive pit/kg wood was used for this calculation. Composting of pulp‐rich fraction The main by‐product of the “Sieving 1” process is the olive pulp. For the treatment of this waste, the industrial composting of biowaste process was chosen (Biowaste {CH}|treatment of biowaste, industrial composting| Cut‐off, U). The composting treat‐ ment is a process of controlled decomposition and humidification of biodegradable mate‐ rials under managed conditions, which is aerobic and which allows the development of temperatures suitable for mesophilic and thermophilic bacteria as a result of biologically produced heat. The inventory refers to 1 kg of fresh weight of biogenic waste. The activities of the process include energy demand for operating a compost plant as well as process emissions, infrastructure of the compost plant, and transports related to the collection of the biogenic waste. 2.2.3. Inventory Tables Pretreatment data were obtained from the literature. Pre‐industrial scale trials carried out in the Laboratoire de Chimie Agro‐industrielle (Université de Toulouse, Toulouse, France) have provided the data of the compounding process [54]. The tables below show the data used for the completed modeling of the process. Ta‐ ble 6 shows the Global LCI data corresponding to the foreground system for the produc‐ tion of the olive pomace‐based composite. The data of each process are reported per 1 kg of output. Table 7 shows the description of the main background processes from Ecoin‐ vent 3.6 considered in this study, and Table 8 shows the LCI data corresponding to the production of an olive pomace‐based composite reported per functional unit.
Table 6. Global life cycle inventory data corresponding to the foreground system for the production of the olive‐based
composite. Data of each process are reported per 1 kg of output.
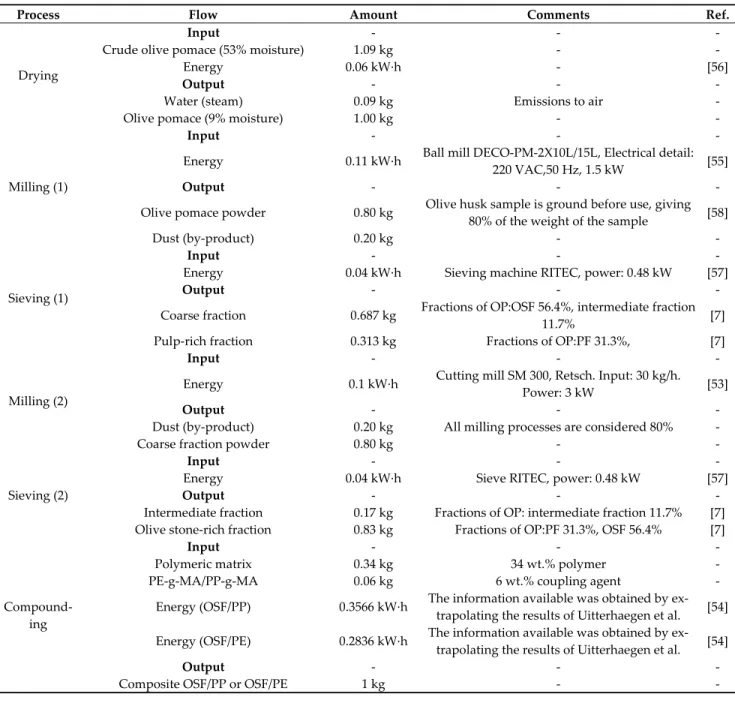
Process Flow Amount Comments Ref.
Drying Input ‐ ‐ ‐ Crude olive pomace (53% moisture) 1.09 kg ‐ ‐ Energy 0.06 kW∙h ‐ [56] Output ‐ ‐ ‐ Water (steam) 0.09 kg Emissions to air ‐ Olive pomace (9% moisture) 1.00 kg ‐ ‐ Milling (1) Input ‐ ‐ ‐ Energy 0.11 kW∙h Ball mill DECO‐PM‐2X10L/15L, Electrical detail: 220 VAC,50 Hz, 1.5 kW [55] Output ‐ ‐ ‐ Olive pomace powder 0.80 kg Olive husk sample is ground before use, giving 80% of the weight of the sample [58] Dust (by‐product) 0.20 kg ‐ ‐ Sieving (1) Input ‐ ‐ ‐ Energy 0.04 kW∙h Sieving machine RITEC, power: 0.48 kW [57] Output ‐ ‐ ‐ Coarse fraction 0.687 kg Fractions of OP:OSF 56.4%, intermediate fraction 11.7% [7] Pulp‐rich fraction 0.313 kg Fractions of OP:PF 31.3%, [7] Milling (2) Input ‐ ‐ ‐ Energy 0.1 kW∙h Cutting mill SM 300, Retsch. Input: 30 kg/h. Power: 3 kW [53] Output ‐ ‐ ‐ Dust (by‐product) 0.20 kg All milling processes are considered 80% ‐ Coarse fraction powder 0.80 kg ‐ ‐ Sieving (2) Input ‐ ‐ ‐ Energy 0.04 kW∙h Sieve RITEC, power: 0.48 kW [57] Output ‐ ‐ ‐ Intermediate fraction 0.17 kg Fractions of OP: intermediate fraction 11.7% [7] Olive stone‐rich fraction 0.83 kg Fractions of OP:PF 31.3%, OSF 56.4% [7] Compound‐ ing Input ‐ ‐ ‐ Polymeric matrix 0.34 kg 34 wt.% polymer ‐ PE‐g‐MA/PP‐g‐MA 0.06 kg 6 wt.% coupling agent ‐ Energy (OSF/PP) 0.3566 kW∙h The information available was obtained by ex‐ trapolating the results of Uitterhaegen et al. [54] Energy (OSF/PE) 0.2836 kW∙h The information available was obtained by ex‐ trapolating the results of Uitterhaegen et al. [54] Output ‐ ‐ ‐ Composite OSF/PP or OSF/PE 1 kg ‐ ‐ Table 7. Description of the main Ecoinvent 3.6 database processes considered in this study for the background processes. Input Ecoinvent Database v.3.6 Combustion of dust Waste wood, untreated {CH}| heat production, untreated waste wood, at furnace 1000–5000 kW | Cut‐off, U Composting Biowaste {CH}|treatment of biowaste, industrial composting| Cut‐off, U Energy Electricity, medium voltage {FR}|market for| Cut‐off, U Maleic anhydride Maleic anhydride {GLO}|market for maleic anhydride | Cut‐off, U Polyethylene Polyethylene, high density, granulate {GLO}|market for | Cut‐off, U Polypropylene Polypropylene, granulate {GLO}|market for | Cut‐off, U Steam Water (Emissions to air)
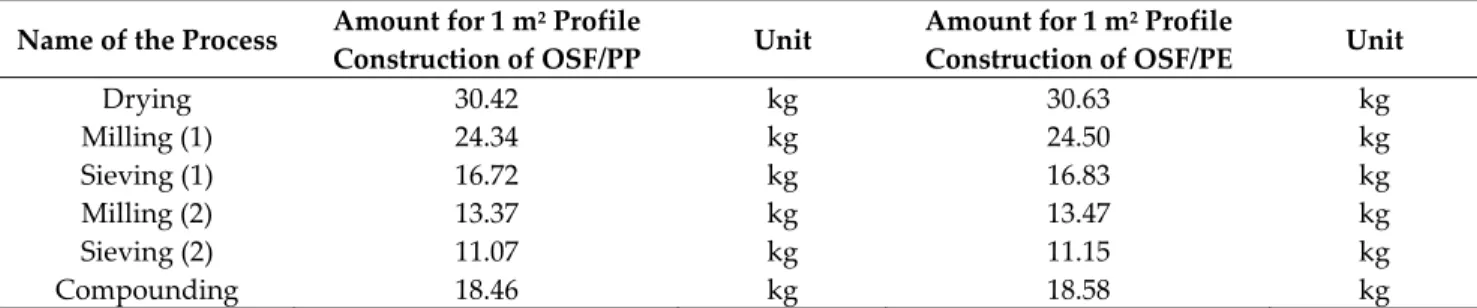
Table 8. LCI data corresponding to production of the olive pomace‐based composite. Data are reported per functional
unit.
Name of the Process Amount for 1 m2 Profile
Construction of OSF/PP Unit Amount for 1 m2 Profile Construction of OSF/PE Unit Drying 30.42 kg 30.63 kg Milling (1) 24.34 kg 24.50 kg Sieving (1) 16.72 kg 16.83 kg Milling (2) 13.37 kg 13.47 kg Sieving (2) 11.07 kg 11.15 kg Compounding 18.46 kg 18.58 kg 2.3. Life Cycle Impact Assessment The system scenarios were developed and analyzed with SimaPro PhD 9.1.1.1 soft‐ ware (PRé Sustainability, Amersfoort, The Netherlands). The life cycle impact assessment (LCIA) results were assessed by the ReCiPe 2016 Endpoint v1.04 (Hierarchist; H) method, normalized and weighted based on an average world environmental impact for the year 2000 (Word ReCiPe H/A,2000). The methodology takes into account the midpoint indica‐ tors from CML, and the endpoint indicators from Ecoindicator [76]. The database used for the modeling was Ecoinvent 3.6. Modeling elements are used to link midpoint indicators to one or more endpoint in‐ dicators, which are representative of different topics or “areas of protection” (AoP) that “defend” our interests as a society with regards to human health, ecosystems or ecosystem services and resources [43]. The ReCiPe 2016 methodology includes 18 midpoint impact categories, and three areas of protection or endpoints [77]. The different midpoint indica‐ tors contribute to a small set of endpoint indicators as can be observed in Figure 4. Figure 4. Summary of the impact categories that are covered in the ReCiPe 2016 method and their relation to the areas of protection (endpoint). The dotted line means that there is no constant mid‐to‐endpoint factor for fossil resources. Adapted from Huijbregts et al. [77].
3. Results
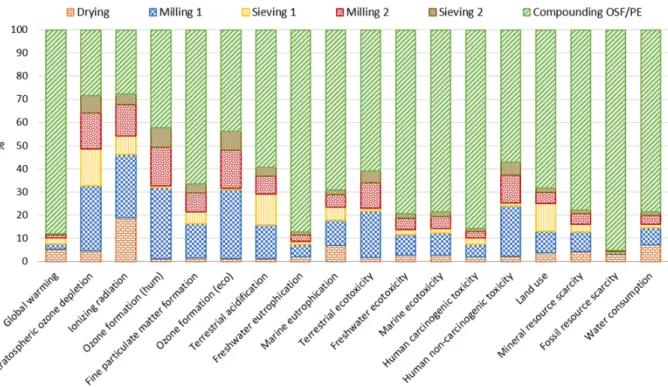
Figures 5 and 6 show the result of the LCA of 1 m2 of lath (building material) made
of OSF/PE and OSF/PP composites, respectively. As we can observe in both production processes, the main hotspot is the compounding process, which affects all the impact cat‐ egories, the most affected ones being global warming (88%), freshwater eutrophication (87%), and fossil resource scarcity (95%). Inside the compounding process, the main hotspot is the production of PE and PP. Fossil resource scarcity is the most affected mid‐ point indicator, due to the production of ethylene and propylene (in the petrochemical industry). Another impact category that is highly affected by compounding is human car‐ cinogenic toxicity, which reaches values of 86% and 82% for OSF/PE and OSF/PP compo‐ sites, respectively.
Figure 7 shows the pie chart of the OSF/PE and OSF/PP compounding processes. From the three damage categories, the most influenced is human health, with a value of 88%, follow by ecosystems and resources availability, with 6% in both categories. In the human health category, the main contributor is the polymeric matrix (PE and PP) (83%), whereas the coupling agent (PP‐g‐MA and PE‐g‐MA) contributed 15% of the impact in the mentioned category of each scenario. The electricity need for the process has the low‐ est contribution, i.e., only 2%. Figure 5. Contribution of each process to the potential environmental impact of the OSF/PE scenario. Characterization, ReCiPe 2016 Midpoint (H).
Figure 6. Contribution of each process to the potential environmental impact of the OSF/PP scenario. Characterization, ReCiPe 2016 Midpoint (H). Figure 7. Contribution of endpoint indicators for the compounding process of OSF/PE and OSF/PP. ReCiPe 2016 Endpoint (H).
From Tables 9 and 10, it is possible to observe the main input and substance that contribute to the pollution of each process. The contribution percentages of each input are expressed based on 100% of each midpoint indicator. The substance percentages are first calculated from the total of all substances of each process, and the percentage expressed in the table is the percentage that corresponds only to the input mentioned (e.g., in the drying process, 85% of the global warming is due to the input of ʺOlive pomace, pro‐ cessed” and the remaining 15% is due to ʺElectricityʺ). A total of 92% of the substances are from ʺCarbon dioxide, fossilʺ and this breaks down to 79% from ʺOlive pomace, pro‐ cessed” and 13% from ʺElectricityʺ. Table 9 details the pollutants corresponding to drying,
milling and sieving processes, which are similar for both scenarios. Table 10 details the pollutants corresponding to the compounding process in both scenarios.
As mentioned before, freshwater eutrophication is highly impacted by the com‐ pounding process. This indicator shows that along the process the main impacts are pro‐ duced by consumption of energy (electricity) from the machines, the combustion and composting process of the waste, and the impacts coming from the polymeric matrices (PP, PE) in both cases. Tables 9 and 10 show that the main pollutant in human carcinogenic toxicity is Chromium VI in water. The values of this midpoint indicator were 721 g 1,4‐ DCB for the OSF/PE composite, and 574 g 1,4‐DCB for the OSF/PP one. Terrestrial ecotox‐ icity is one of the main contributors to pollution in the case study. The production of 1 FU of the OSF/PE composite released 61.4 kg 1,4‐DCB, while the production of the OSF/PP one released 58.8 kg 1,4‐DCB. The two main metals emitted during the life cycle of the product were zinc and copper, which generated damages on the ecosystems, especially the soil [78]. The results show that fossil resource scarcity indicator is similar in both cases, with 13.2 kg oil eq for the OSF/PE composite and 13.3 kg oil eq for the OSF/PP one. The mineral resources scarcity indicator (Table 10) shows that the polymeric matrices (PE and PP) depleted the environment with different substances: the OSF/PE composite mostly drains gold, while the OSF/PP one mainly drains titanium. All the results for each impact category for both biocomposites are presented in Table 11.
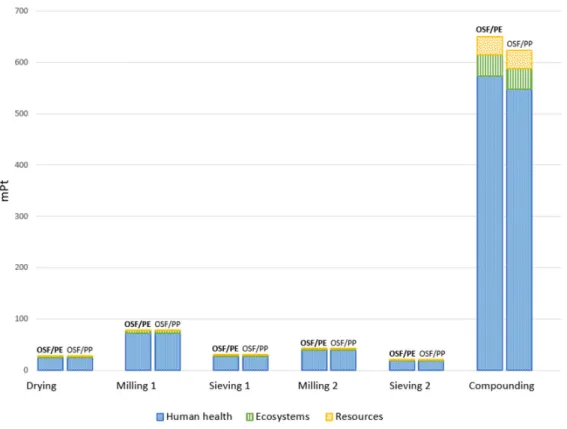
Figure 8 represents the single score result of the LCA production of 1 m2 of the
OSF/PE and OSF/PP laths, respectively. It is worth mentioning that the score used in the charts is called eco‐points (Pt). One eco‐point can be interpreted as one thousandth of the annual environmental load of one average European inhabitant [79].
In both scenarios, the most impactful process was compounding, where human health was the more affected area of protection. The results show similar values for the compounding of OSF/PE and OSF/PP composites, 574 and 548 mPt, respectively. The hu‐ man health category repeated along the different processes. Therefore, it can be identified as an area of concern. The contribution for this endpoint category was 89% for both sce‐ narios. Ecosystems and resources availability had a small impact in comparison with hu‐ man health, their total values being 53.7 mPt (6%) and 36.5 mPt (4%), respectively, for the OSF/PE composite, and 52.5 (6%) mPt and 37.1 mPt (5%), respectively, for the OSF/PP composite. As mention before, the main contributor to these damage categories was the compounding process. For ecosystems, the contribution of this process to the total damage category was 76% for both scenarios, while compounding represented 96% of the re‐ sources availability category.
Figure 8. Single score results of OSF/PE and OSF/PP scenarios. ReCiPe 2016 Endpoint (H).
Table 9. Midpoint indicators and their main pollutants of the analysis of 1 FU of the composites production with the
ReCiPe 2016 (H) method.
Midpoint indicator
Drying Milling 1 Sieving 1 Milling 2 Sieving 2 Input Substance Input Substance Input Substance Input Substance Input Substance
Global warning Olive pomace, processed (85%) Carbon dioxide, fossil (79%) Electricity (58%) Carbon dioxide, fossil (52%) Biowaste, composting (84%) Methane, biogenic (50.3%) Electricity (56%) Carbon dioxide, fossil (50%) Heat production, waste wood (55%) Carbon dioxide, fossil (40%) Stratospheric ozone depletion Olive pomace, processed (66%) Dinitrogen monoxide (33%) Heat production (Waste wood) (90%) Dinitrogen monoxide (90%) Biowaste, composting (95%) Dinitrogen monoxide (94%) Heat production (Waste wood) (91%) Dinitrogen monoxide (91%) Heat production, waste wood (94%) Dinitrogen monoxide (94%) Ionizing radiation Electricity (74%) Radon‐222 (73%) Electricity (94%) Radon‐222 (92%) Electricity (96%) Radon‐222 (94%) Electricity (94%) Radon‐222 (91%) Electricity (90%) Radon‐222 (88%) Ozone formation, Human health Olive pomace, processed (76%) Nitrogen oxides (73%) Heat production (Waste wood) (98%) Nitrogen oxides (97%) Biowaste, composting (73%) Nitrogen oxides (70%) Heat production (Waste wood) (98%) Nitrogen oxides (98%) Heat production, waste wood (99%) Nitrogen oxides (98%) Fine particulate matter formation Olive pomace, processed (58%) Sulfur dioxide (23%) Heat production (Waste wood) (92%) Nitrogen oxides (68%) Biowaste, composting (94%) Ammonia (83%) Heat production (Waste wood) (93%) Nitrogen oxides (69%) Heat production, waste wood (95%) Nitrogen oxides (70%) Ozone formation, Terrestrial ecosystems Olive pomace, processed (76%) Nitrogen oxides (71%) Heat production (Waste wood) (98%) Nitrogen oxides (97%) Biowaste, composting (74%) Nitrogen oxides (68%) Heat production (Waste wood) (98%) Nitrogen oxides (97%) Heat production, waste wood (99%) Nitrogen oxides (98%)
Terrestrial acidification Olive pomace (61%) Sulfur dioxide (31%) Heat production (Waste wood) (93%) Nitrogen oxides (83%) Biowaste, composting (98%) Ammonia (95%) Heat production (Waste wood) (94%) Nitrogen oxides (83%) Heat production, waste wood (96%) Nitrogen oxides (85%) Freshwater eutrophicatio n Electricity (63%) Phosphate, water (63%) Heat production (Waste wood) (58%) Phosphate, water (42%) Biowaste, composting (51%) Phosphate, water (51%) Heat production, waste wood (61%) Phosphate, water (43%) Heat production, waste wood (71%) Phosphate, water (50%) Marine eutrophicatio n Electricity (73%) Nitrate (70%) Electricity (85%) Nitrate (81%) Biowaste, composting (51%) Nitrate (47%) Electricity (83%) Nitrate (80%) Electricity (76%) Nitrate (73%) Terrestrial ecotoxicity Electricity (65%) Copper (44%) Heat production (Waste wood) (90%) Zinc (48%) Biowaste, composting (59%) Copper (38%) Heat production (Waste wood) (91%) Zinc (49%) Heat production, waste wood (94%) Zinc (51%) Freshwater ecotoxicity Electricity (75%) Copper (58%) Heat production (Waste wood) (59%) Copper (30%) Electricity (55%) Copper (43%) Heat production, waste wood (62%) Copper (31%) Heat production, waste wood (71%) Copper (36%) Marine ecotoxicity Electricity (69%) Copper (51%) Heat production (Waste wood) (63%) Copper (25%) Electricity (54%) Copper (40%) Heat production, waste wood (65%) Copper (26%) Heat production, waste wood (74%) Copper (30%) Human carcinogenic toxicity Electricity (54%) Chromium VI, water (38%) Heat production (Waste wood) (64%) Chromium VI, water (49%) Biowaste, composting (81%) Chromium VI, water (77%) Heat production (Waste wood) (66%) Chromium VI, water (51%) Heat production, waste wood (75%) Chromium VI, water (58%) Human non‐ carcinogenic toxicity Electricity (62%) Arsenic, water (29%) Heat production (Waste wood) (89%) Zinc, soil (56%) Electricity (57%) Zinc (20%) Heat production (Waste wood) (90%) Zinc, soil (57%) Heat production, waste wood (93%) Zinc, soil (59%) Land use Electricity (78%) Occupation, forest, intensive (65%) Electricity (60%) Occupation, forest, intensive (50%) Biowaste, composting (87%) Occupation, forest, intensive (68%) Electricity (58%) Occupation, forest, intensive (48%) Heat production, waste wood (53%) Occupation, forest, intensive (15%) Mineral resource scarcity Electricity (63%) Uranium (42%) Electricity (59%) Uranium (39%) Biowaste, composting (55%) Iron (30%) Electricity (56%) Uranium (38%) Heat production, waste wood (55%) Uranium (3%) Fossil resource scarcity Olive pomace, processed (89%) Gas, natural/m3 (86%) Electricity (77%) Gas, natural/m3 (49%) Biowaste, composting (64%) Oil, crude (51%) Electricity (76%) Gas, natural/m3 (48%) Electricity (67%) Gas, natural/m3 (42%) Water consumption Olive pomace, processed (63%) Water, turbine use, unspecified natural origin, FR (25%) Electricity (64%) Water, turbine use, unspecified natural origin, FR (80%) Electricity (88%) Water, turbine use, unspecified natural origin, FR (88%) Electricity (62%) Water, turbine use, unspecified natural origin, FR (78%) Electricity (51%) Water, turbine use, unspecified natural origin, FR (70%)
Table 10. Midpoint indicators and their main pollutants in the analysis of 1 FU on the compounding process of the com‐
posites with the ReCiPe 2016 (H) method.
Midpoint indicator Compounding OSF/PE Compounding OSF/PP
Input Substance Input Substance
Global warning Polyethylene, high density (84%) Carbon dioxide, fossil (67%) Polypropylene (83%) Carbon dioxide, fossil (66%) Stratospheric ozone depletion Polyethylene, high density (78%) Dinitrogen monoxide (68%) Polypropylene (74%) Dinitrogen monoxide (65%) Ionizing radiation Electricity (79%) Radon‐222 (77%) Electricity (85%) Radon‐222 (83%) Ozone formation, Human health Polyethylene, high density (84%) Nitrogen oxides (74%) Polypropylene (84%) Nitrogen oxides (75%) Fine particulate matter formation Polyethylene, high density (84%) Sulfur dioxide (44%) Polypropylene (83%) Sulfur dioxide (46%) Ozone formation, Terrestrial ecosystems Polyethylene, high density (84%) Nitrogen oxides (69%) Polypropylene (84%) Nitrogen oxides (71%) Terrestrial acidification Polyethylene, high density (84%) Sulfur dioxide (62%) Polypropylene (83%) Sulfur dioxide (62%) Freshwater eutrophication Polyethylene, high density (83%) Phosphate, water (83%) Polypropylene (82%) Phosphate, water (82%) Marine eutrophication Polyethylene, high density (75%) Nitrate (58%) Polypropylene (73%) Nitrate (54%) Terrestrial ecotoxicity Polyethylene, high density (83%) Copper (56%) Polypropylene (82%) Copper (59%) Freshwater ecotoxicity Polyethylene, high density (82%) Copper (49%) Polypropylene (81%) Copper (49%) Marine ecotoxicity Polyethylene, high density (82%) Copper (45%) Polypropylene (81%) Copper (45%) Human carcinogenic toxicity Polyethylene, high density (83%) Chromium VI, water (78%) Polypropylene (82%) Chromium VI, water (76%) Human non‐carcinogenic toxicity Polyethylene, high density (82%) Zinc (50%) Polypropylene (81%) Zinc (49%) Land use Polyethylene, high density (79%) Occupation, forest, intensive (37%) Polypropylene (77%) Occupation, forest, intensive (35%) Mineral resource scarcity Polyethylene, high density (80%) Gold (24%) Polypropylene (81%) Titanium (22%) Fossil resource scarcity Polyethylene, high density (85%) Oil, crude (50%) Polypropylene (85%) Oil, crude (50%) Water consumption Polyethylene, high density (81%) Water, turbine use, unspecified natural origin, FR (6%) Polypropylene (79%) Water, turbine use, unspecified natural origin, FR (4%)
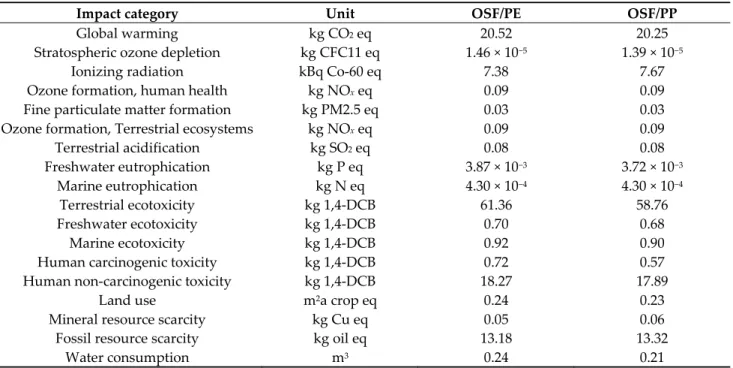
Table 11. Results of the environmental impact categories from a cradle‐to‐gate perspective for the production of 1 m2 olive
pomace‐based composite lath.
Impact category Unit OSF/PE OSF/PP
Global warming kg CO2 eq 20.52 20.25
Stratospheric ozone depletion kg CFC11 eq 1.46 × 10⁻⁵ 1.39 × 10⁻⁵
Ionizing radiation kBq Co‐60 eq 7.38 7.67
Ozone formation, human health kg NOx eq 0.09 0.09
Fine particulate matter formation kg PM2.5 eq 0.03 0.03
Ozone formation, Terrestrial ecosystems kg NOx eq 0.09 0.09
Terrestrial acidification kg SO2 eq 0.08 0.08
Freshwater eutrophication kg P eq 3.87 × 10⁻³ 3.72 × 10⁻³ Marine eutrophication kg N eq 4.30 × 10⁻⁴ 4.30 × 10⁻⁴ Terrestrial ecotoxicity kg 1,4‐DCB 61.36 58.76 Freshwater ecotoxicity kg 1,4‐DCB 0.70 0.68 Marine ecotoxicity kg 1,4‐DCB 0.92 0.90 Human carcinogenic toxicity kg 1,4‐DCB 0.72 0.57 Human non‐carcinogenic toxicity kg 1,4‐DCB 18.27 17.89 Land use m2a crop eq 0.24 0.23 Mineral resource scarcity kg Cu eq 0.05 0.06 Fossil resource scarcity kg oil eq 13.18 13.32 Water consumption m3 0.24 0.21 4. Discussion and Perspectives 4.1. Comparison with a Conventional Lath For comparing the performance of the herein biocomposites made of olive stone flour and its application as a building material, it is important to compare it with a business‐as‐ usual scenario for this type of application. A common material used for this is “PVC deck‐ ing”.
This term is used to refer to plastic decking that uses cellular polyvinyl chloride (PVC) as the building material of the lath. Cellular PVC is lighter than standard PVC due to the addition of a foaming agent throughout the manufacturing process [80]. The au‐ thors reported that the production of 9.3 m2 of installed PVC decking in service for 25
years produces 426 kg CO2 eq. That project considered the full life cycle of the decking
product, starting from the raw material extraction to the final disposal in a municipal solid waste landfill [80]. The preliminary results (cradle‐to‐gate) of this project reported the emission of 368 kg CO2 eq. This translates into 39.6 kg CO2 eq for 1 m2 of PVC decking. In
contrast, the herein work results show that the production of 1 m2 of OSF/PE and OSF/PP
lath releases 20.5 kg CO2 eq and 20.3 kg CO2 eq, respectively. This may indicate that the
pollution caused by PVC decking is almost two times bigger than that caused by the olive pomace‐based composites. What is certain is that PVC is considered carcinogenic and environmentally hazard‐ ous due to the presence of organochlorines. In contrast, PP and PE are chlorine‐free plas‐ tics [81]. 4.2. Biosourcing the Matrix
The most common polymeric matrices used for biocomposites are produced from petrochemicals and are not biodegradable. This type of polymer generates long‐term neg‐ ative impacts on the environment and human health [17]. It should nevertheless be noted here that biosourced polyolefins exist on the market, especially BioPE, which is produced from sugar cane waste, and, to a much lesser extent, BioPP.
Biodegradable and biosourced polymers are raising great interest, due to the grow‐ ing environmental concerns and the decline of the fossil resources [30]. Among the men‐ tioned polymers, PLA (poly(lactic acid)) and polyhydroxyalkanoates (PHAs) (e.g., PHB (polyhydroxybutyrate), PHV (polyhydroxyvalerate), PHBV (polyhydroxy‐butyrate‐co‐ valerate)) are commercially available polymers, produced in large scale and able to com‐ pete with more traditional petroleum‐based plastics [17,30,82]. The environmental assess‐ ment of this biodegradable composite reinforced with OP can be the objective for further studies. 4.3. Impact of the Diversion of the Olive Pomace from its Original Use It is important to contemplate the consequences of diverting the olive pomace from its original use. The conventional uses of olive oil by‐products explained earlier (1. Introduction) are their controlled spreading, their use as a mixture in animal nutrition, and composting. Olive wastes are frequently discharged on soil. The production of 1 L of extra virgin olive oil (EVOO) leads to the emission of around 57 g CO2 eq. This practice is widespread around the European Community as it is supported by the law in many countries [6,83]. Duman et al. [23] studied the composting scenario in Turkey, and found that 2.25 kg of OP in a mixture with 0.34 kg of wheat straw and 0.67 kg of poultry manure can produce 2.09 kg of compost and release to the atmosphere 6.82 kg CO2 eq, with nitrous oxide as the main emission [23]. For the production of the herein functional unit (1 m2 of lath (building material) made of olive pomace‐based composite), an average of 46.7 kg OP is used. Compared with the results of Duman et al. [23], the composting of the same quantity of OP would liberate to the environment 141.5 kg CO2 eq, which is almost seven times higher than the pollution caused by the olive pomace‐based composites. The controlled spreading of those 46.7 kg OP would liberate to the environment 0.665 kg CO2 eq. This is taking into account that, on average, olive fruit contains 20 wt.% of oil, and the remaining 80 wt.% together with the water added during the olive oil extraction process form OP. The production of 1 L of EVOO generates 4 kg of OP. The controlled spreading of OP is about thirty times less polluting than the production of 1 m2 of olive pomace‐based composites. Nevertheless, the direct application of this olive oil by‐product can cause negative effects on soil due to its high mineral salt content, low pH and presence of polyphenols [6]. 4.4. Carbon Sequestration To deepen the information obtained on this work, the importance of an expected ben‐ efit of biocomposites can be discussed, namely long‐term carbon sequestration. The U.S. Environmental Protection Agency defines biogenic CO2 emissions as CO2 emissions associated with the natural carbon cycle, together with the emissions resulting from the combustion, harvest, digestion, fermentation, decomposition, or processing of biologically based materials [84]. Products and residues of the olive orchard cultivation contain biogenic carbon derived from the uptake of CO2 by the crop [85]. When talking about olive oil production, the biogenic carbon from the agricultural phase (olive tree permanent components, especially taking into account the longevity of olive groves) does not become part of the product (olive oil). Therefore, in accordance with PAS 2050, the assessment of biogenic carbon should be taken into account when per‐ forming an LCA that considers this phase within its system boundaries [12]. Storing car‐ bon during a long lifespan (composite decking can last between 25 and 30 years) can mit‐ igate climate change because of the delay in the carbon emissions into the technosphere. This advantage, however, could not be quantified with the static LCA approach used in this study. A rough estimation of biogenic carbon, based on the work herein presented, shows that 1 FU of the olive pomace based‐composite could contribute to delaying the
emission of over 32.5 kg CO2 (considering a humidity content of OP of 53% and a percent‐ age of total carbon for a three‐phase centrifugation of 29%). 5. Conclusions In this study, the valorization of an olive pomace‐based biocomposite was evaluated through the environmental criteria, with the LCA method. The functional unit is the pro‐ duction of 1 m2 of a lath (building material) made of an olive pomace‐based biocomposite. Two scenarios with different thermoplastic matrices (PE, PP) were assessed. In both cases, the twin‐screw compounding process contributed the major burden in most of the mid‐ point impact categories. Compounding is mainly affected by the production of the respec‐ tive polymers. When comparing the OSF/PE and OSF/PP materials, the impacts are rela‐ tively similar. Therefore, a further study at the end of life of the material should be carried out to conclude which of the proposed biocomposites is the less polluting one. The results obtained showed that human health is the most affected area of protec‐ tion; it represented 89% for both scenarios, i.e., OSF/PP and OSF/PE. The main contribu‐ tors to this damage category are energy, carbon dioxide and sulfur dioxide, used and pro‐ duced in the manufacturing process. Ecosystems and resources availability represented a lower contribution to the total impact. Scenarios presented values of 6% and 4.5% for eco‐ systems and resources availability, respectively. The comparison of the olive pomace‐based‐composite with the business‐as‐usual sce‐ nario shows that the biocomposite released half of the pollution produced by the PVC decking, when considering the same FU. Besides, given the long lifespan of the biocom‐ posites, the CO2 stored on it can mitigate climate change because of the delay in the carbon emissions into the technosphere. This case study evaluates a new path for olive pomace‐based composites as an alter‐ native eco‐material for the building sector, based on environmental criteria. Future works can include the use of biosourced polymer matrices, which could reduce the impact of the production of olive pomace‐based composites.
Author Contributions: Methodology, G.E.‐A.; investigation, G.E.‐A., P.G.‐A. and P.E.; writing—
original draft, G.E.‐A. and P.G.‐A.; writing—review and editing, C.V., J.‐P.B., P.E. and C.S.; valida‐ tion, C.V., J.‐P.B., P.E. and C.S.; supervision, C.V., J.‐P.B. and C.S.; visualization, G.E.‐A. All authors have read and agreed to the published version of the manuscript. Funding: The work was carried out as part of the doctoral thesis of G. Espadas‐Aldana, her work being financed by the Mexican National Council for Science and Technology (CONACYT Mexico) under the scholarship No. 471707. Institutional Review Board Statement: Not applicable. Informed Consent Statement: Not applicable. Data Availability Statement: Data is contained within the article. Conflicts of Interest: The authors declare no conflict of interest. References 1. del Mar Contreras, M.; Romero, I.; Moya, M.; Castro, E. Olive‐derived biomass as a renewable source of value‐added products. Process Biochem. 2020, 97, 43–56, doi:10.1016/j.procbio.2020.06.013. 2. Notarnicola, B., Salomone, R., Petti, L., Renzulli, P.A., Roma, R., Cerutti, A.K. Life Cycle Assessment in the Agri‐Food Sector: Case Studies, Methodological Issues and Best Practices; Springer International Publishing: Berlin/Heidelberg, Germany, 2015; ISBN 978‐ 3‐319‐11939‐7. 3. Boskou, D. Olive Oil: Chemistry and Technology, Second Edition; AOCS Publishing: Urbana, IL, USA, 2006; ISBN 978‐1‐893997‐88‐ 2. 4. Vidal, A.M. Mejora de Las Características Organolépticas, Funcionales y Nutricionales de Aceites de Oliva Vírgenes. PhD The‐ sis, Universidad de Jaén, Jaén, Spain, 2019. 5. Dermeche, S.; Nadour, M.; Larroche, C.; Moulti‐Mati, F.; Michaud, P. Olive mill wastes: Biochemical characterizations and va‐ lorization strategies. Process Biochem. 2013, 48, 1532–1552, doi:10.1016/j.procbio.2013.07.010.