HAL Id: hal-01835605
https://hal.umontpellier.fr/hal-01835605
Submitted on 18 Dec 2020
HAL is a multi-disciplinary open access
archive for the deposit and dissemination of
sci-entific research documents, whether they are
pub-lished or not. The documents may come from
teaching and research institutions in France or
abroad, or from public or private research centers.
L’archive ouverte pluridisciplinaire HAL, est
destinée au dépôt et à la diffusion de documents
scientifiques de niveau recherche, publiés ou non,
émanant des établissements d’enseignement et de
recherche français ou étrangers, des laboratoires
publics ou privés.
Distributed under a Creative Commons Attribution| 4.0 International License
Cholesterol Homeostasis Through the ERK5/MEF2
Pathway
Abrar Ul Haq Khan, Nerea Allende-Vega, Delphine Gitenay, Sabine
Gerbal-Chaloin, Claire Gondeau, Dang-Nghiem Vo, Sana Belkahla, Stefania
Orecchioni, Giovanna Talarico, Francesco Bertolini, et al.
To cite this version:
Abrar Ul Haq Khan, Nerea Allende-Vega, Delphine Gitenay, Sabine Gerbal-Chaloin, Claire Gondeau,
et al..
The PDK1 Inhibitor Dichloroacetate Controls Cholesterol Homeostasis Through the
ERK5/MEF2 Pathway. Scientific Reports, Nature Publishing Group, 2017, 7 (1),
�10.1038/s41598-017-10339-5�. �hal-01835605�
www.nature.com/scientificreports
The PDK1 Inhibitor Dichloroacetate
Controls Cholesterol Homeostasis
Through the ERK5/MEF2 Pathway
Abrar Ul Haq Khan
1,2, Nerea Allende-Vega
1,2, Delphine Gitenay
1,2, Sabine Gerbal-Chaloin
1,2,
Claire Gondeau
1,2,3, Dang-Nghiem Vo
1, Sana Belkahla
1, Stefania Orecchioni
4, Giovanna
Talarico
4, Francesco Bertolini
4, Milica Bozic
5, Jose M. Valdivielso
5, Fabienne Bejjani
6,
Isabelle Jariel
6, Isabel C. Lopez-Mejia
7, Lluis Fajas
7, Charles-Henri Lecellier
6, Javier
Hernandez
1, Martine Daujat
1,2& Martin Villalba
1,2Controlling cholesterol levels is a major challenge in human health, since hypercholesterolemia can lead to serious cardiovascular disease. Drugs that target carbohydrate metabolism can also modify lipid metabolism and hence cholesterol plasma levels. In this sense, dichloroacetate (DCA), a pyruvate dehydrogenase kinase (PDK) inhibitor, augments usage of the glycolysis-produced pyruvate in the mitochondria increasing oxidative phosphorylation (OXPHOS). In several animal models, DCA decreases plasma cholesterol and triglycerides. Thus, DCA was used in the 70 s to treat diabetes mellitus, hyperlipoproteinemia and hypercholesterolemia with satisfactory results. However, the mechanism of action remained unknown and we describe it here. DCA increases LDLR mRNA and protein levels as well as LDL intake in several cell lines, primary human hepatocytes and two different mouse models. This effect is mediated by transcriptional activation as evidenced by H3 acetylation on lysine 27 on the LDLR promoter. DCA induces expression of the MAPK ERK5 that turns on the transcription factor MEF2. Inhibition of this ERK5/MEF2 pathway by genetic or pharmacological means decreases LDLR expression and LDL intake. In summary, our results indicate that DCA, by inducing OXPHOS, promotes ERK5/MEF2 activation leading to LDLR expression. The ERK5/MEF2 pathway offers an interesting pharmacological target for drug development.
Elevated level of low-density lipoprotein (LDL) in blood is a predominant risk factor for atherosclerosis, a large cause of mortality1. Control of plasma cholesterol levels largely depends on low-density lipoprotein receptor
(LDLR), which mediates the endocytosis of cholesterol-rich LDL2, 3. This process takes place mainly in the
liver2, 3. LDL is degraded in lysosomes and cholesterol made available for repression of microsomal enzyme
3-hydroxy-3-methylglutaryl coenzyme A (HMG CoA) reductase, the rate-limiting step in cholesterol synthesis2, 3.
Hence, LDLR regulates intracellular and extracellular cholesterol homeostasis and is involved in atherosclerosis due to accumulation of LDL-cholesterol in blood4.
Lipid and carbohydrate metabolic pathways are interconnected and targeting the latter may result in altered cholesterol levels. The pyruvate dehydrogenase (PDH) kinase (PDK) inhibitor dichloroacetate (DCA) acti-vates PDH, the rate-limiting enzyme of aerobic glucose oxidation5. PDH converts glycolysis-produced
pyru-vate in acetyl-CoA that enters the mitochondria and is consumed in the process of oxidative phosphorylation (OXPHOS). Thus, DCA inhibits glycolysis and lactate production and induces OXPHOS6–10. DCA concentration
in DCA-treated patients is unclear because its half-life is less than 1 hour and it is not detectable in patients during the initial phase of treatment that can last 2 to 3 months11, 12. However, DCA inhibits its own metabolism
1INSERM, U1183; Université de Montpellier, UFR Medecine, 80, av. Augustin Fliche, 34295, Montpellier Cedex 5,
France. 2Institut de Médecine Régénératrice et Biothérapie (IRMB), CHU Montpellier, Montpellier, 34295, France. 3Département d’Hépato-gastroentérologie A, Hôpital Saint Eloi, CHU, Montpellier, France. 4Laboratory of
Hematology-Oncology, European Institute of Oncology, Milan, Italy. 5Vascular and Renal Translational Research
Group. Institut de Recerca Biomedica de Lleida (IRBLLIDA), Lleida, Spain. 6IGMM, CNRS, Univ. Montpellier,
Montpellier, France. 7Center for Integrative Genomics, University of Lausanne, Lausanne, Switzerland.
Correspondence and requests for materials should be addressed to M.V. (email: martin.villalba@inserm.fr) Received: 25 April 2017
Accepted: 8 August 2017 Published: xx xx xxxx
and serum concentrations increase, eventually reaching a plateau, with plasma concentrations around 0.3 mM11.
Michelakis et al. gave 50 mg/Kg/day of DCA to patients and obtained similar values: 0.44 ± 0.16 mM12.
DCA treatment decreases plasma triglyceride and cholesterol in animal models and humans13, 14. This effect
is likely indirect due to the decrease in plasma of very-low-density lipoproteins (VLDL) by stimulation of triglyc-eride oxidation5, 14, although the mechanism remains unknown. After these findings there was an attempt to use
DCA to treat two cases of familial hypercholesterolemia (FH)15. DCA reduced circulating cholesterol levels in
both patients by decreasing LDL cholesterol15. Unfortunately, DCA had to be discontinued following
neuropatho-logical effects and this precluded its use to treat high cholesterol levels15. The biological mechanism underlying
DCA effects on cholesterol was unknown and, to the best of our knowledge, no further studies were conducted to investigate it. Nowadays, the most accepted explanation would be that the change in carbohydrate metabolism alters lipid metabolism. In this sense, DCA, by inhibiting glycolysis, activates AMPK9, which inhibits cholesterol
synthesis16, 17 leading to LDLR expression18, 19. Enhanced LDLR expression is mediated by a MAPKK because the
MAPKK inhibitors PD9805918 and U012620, 21 restrain it. This would indicate that DCA has a similar mechanism
of action than the alkaloid berberine and its analogs18, 19. An alternative explanation could be that DCA induces
ROS production9, 10 and the cellular oxidative state regulates LDLR expression22. Hence, changes in ROS could
mediate DCA-induced LDLR expression.
In preliminary experiments, we found by transcriptome analysis that LDLR was one of the most downregu-lated genes in hematopoietic cells expressing a small hairpin RNA for ERK5 (shERK5) and one of the most upreg-ulated after DCA treatment. We have previously observed that DCA increased mRNA and protein expression of the MAPK ERK5, which is essential for cell survival in OXPHOS conditions8, 10, 23–26. ERK5 activates the MEF2
family of transcription factors27–30 that in turn mediates most of the effects of ERK5 on metabolism8, 10, 23–26. In
fact, DCA activates multiple genes with promoters containing MEF2 binding sites. Genomic analysis using the UCSC genome browser (http://genome.ucsc.edu/) showed that LDLR is one of such genes because its promoter contains several binding sites for at least two MEF2 proteins, MEF2A and MEF2C, which have been validated in several cell lines by Chromatin Immunoprecipitation (ChIP; (http://genome.ucsc.edu/). We investigate here how DCA reduces cholesterol levels and the role of the ERK5/MEF2 pathway.
Results
DCA enhances LDLR expression.
We first observed that DCA increased LDLR mRNA in hematopoietic cells (Fig. 1A, left panel). Since liver is the main organ that takes up LDL-cholesterol from blood, we tested the effect of DCA in two hepatic cell lines, finding that LDLR mRNA levels were also increased (Fig. 1A, right panel). Augmented LDLR mRNA levels correlated with an increase of LDLR protein in the plasma membrane (Fig. 1Band Supplemental Fig. 1A). We then tested the functional consequence of this enhanced expression by incubating control or DCA-treated cells with fluorescently labeled LDL. DCA increased LDL transport into these cell lines (Fig. 1C and Supplemental Fig. 1B).
Cells performing OXPHOS increase LDLR activity.
DCA induces OXPHOS in leukemic cells8–10, 24, 25, 31.To investigate whether the metabolic switch from aerobic glycolysis to OXPHOS mediated by DCA affect LDLR expression, we used a glucose-free culture medium containing a final glutamine concentration of 4 mM and 10 mM galactose. Glutamine is used to drive mitochondria to utilize OXPHOS and galactose allows cells to syn-thesize nucleic acids through the pentose phosphate pathway8, 24, 32, 33. We called it ‘OXPHOS medium’ because
it forced leukemic cells to use OXPHOS as primary ATP source8, 9, 23. We observed that acute myeloid leukemia
(AML) OCI-AML3 cells growing in OXPHOS medium for 2 weeks, such as those treated with DCA, presented an increase of ERK5 and LDLR mRNA (Supplemental Fig. 2A), LDLR protein and LDL intake (Fig. 1D). These results indicated that, as expected, the effect of DCA on LDLR expression was due to a metabolic switch. DCA and OXPHOS also increased LDLR mRNA and protein as well as LDL intake in primary lymphoma cells derived from a B cell lymphoma patient (BCL-P2; Fig. 1A, Supplemental Fig. 1B and Fig. 1E). We found similar results in the hepatic cell lines HepG2-C3A and HuH7, with OXPHOS media increasing LDLR protein and uptake (Supplemental Fig. 3).
In primary human hepatocytes, DCA also induced LDLR expression at 6 and 24 h post treatment (Fig. 2A). However, effects disappeared at 48 and 72 h with a net decrease (Fig. 2A). This is likely due to the short DCA half-life, since LDLR mRNA levels were kept high when fresh DCA was added to the medium every 24 h (Fig. 2B).
Reactive Oxygen Species (ROS) do not mediate DCA-induced LDLR expression.
The cellular oxidative state can regulate LDLR expression22 and DCA induces ROS production in certain hematopoieticcell lines but not in others9, 10. We observed a similar phenomenon in two different hepatic cell lines. In Huh7
cells there was an increase of ROS, but not in HepG2-C3A cells, after DCA treatment (Fig. 3A). In contrast, in all cell lines utilized in this study, DCA increased LDLR expression, suggesting that ROS production was not essential (Figs 1A and 3B). Next, we incubated both hepatic cell lines with the antioxidant N-acetyl-cysteine (NAC). NAC efficiently blocked DCA-induced ROS production in HuH7 cells (Fig. 3A); however, it did not affect DCA-induced LDLR mRNA (Fig. 3B) or plasma membrane protein (Fig. 3C). To definitively exclude that ROS played any role in LDLR induction, we incubated primary hepatocytes with DCA in presence or absence of NAC. We found that NAC did not inhibit and in fact increased LDLR mRNA expression (Fig. 3D). These results exclude a major role for de novo ROS production in LDLR expression after DCA treatment.
DCA induces LDLR in vivo.
We next assessed whether DCA enhances LDLR expression in vivo. We engrafted human AML primary cells in non-obese diabetic/severe combined immunodeficient (NOD/ SCID)-interleukin-2 receptor γ chain null (NSG) mice, as previously described9, 10. Mice with established tumorswww.nature.com/scientificreports/
Figure 1. OXPHOS induced LDLR expression and LDL uptake. (A) The hematopoietic cell lines Jurkat and
OCI-AML3 and primary cells from a BCL patient (BCL-P2) as well as HepG2-C3A and Huh7 hepatic cell lines were treated with 10 mM DCA for 24 h and LDLR mRNA was analyzed by RT-qPCR. (B) Cell lines were treated for 72 h with 5 mM DCA and LDLR protein in plasma membrane was analyzed by FACs. (C) Cells were treated as in (B) and fluorescent LDL intake analyzed by FACs. (D) OCI-AML3 cells were grown in OXPHOS medium for 2 weeks and LDLR expression (left) and LDL intake (right) were analyzed by FACs. (E) BCL-P2 cells were treated with 5 mM DCA for 1 week (left) or were grown in OXPHOS medium for 2 weeks (center) and LDLR protein in plasma membrane analyzed by FACs. LDL intake (right) was analyzed in cells growing in OXPHOS. The bar graphs represent means ± SD of 3 independent experiments performed in triplicate; *p < 0.05, **p < 0.01, ***p < 0.005 student t-test compared to control cells.
notable effect on mice survival9. Human tumor AML cells gather in murine spleen and bone marrow, hence
we isolated mRNA from these organs. We used human-specific primers and observed that DCA significantly increased expression of LDLR mRNA (Fig. 4A).
We also found augmented mouse LDLR mRNA levels in normal liver and spleen from wt mice that were treated daily, for 1 and up to 3 days, with DCA (Fig. 4B). The effect was first observed in hematopoietic cells
Figure 2. DCA induced LDLR expression in primary human hepatocytes. (A) Primary hepatocytes were
treated with the indicated concentrations of DCA for the indicated times. (B) Cells were treated at time 0 with DCA and some were treated every 24 h before harvesting as indicated. LDLR mRNA was analyzed by RT-qPCR. The bar graphs represent means ± SD of 3 independent donors performed in triplicate; *p < 0.05, **p < 0.01, ***p < 0.005 one-way ANOVA with post-hoc Tukey test.
www.nature.com/scientificreports/
gathering in spleen and, later, in liver. Thus, DCA induced LDLR expression in multiple cell populations in vivo. This could, at least partially, explain the reduction in plasma cholesterol levels after DCA treatment in several species including humans5, 13–15, 34.
Figure 3. Increase in ROS levels was not required for LDLR expression. (A) Both hepatic cell lines were treated
with 2 mM NAC 1 h before adding DCA (10 mM) for 24 h. Cells were labeled with CH-H2DCFDA and analyzed by FACs for ROS production. LDLR mRNA (B) or protein (C) from these cells were analyzed as described in Fig. 1. Results represent the means ± SD of these donors with experiments performed in triplicate. The data represent means ± SD; *p < 0.05, **p < 0.01, ***p < 0.005 student t-test compared to cells non treated with DCA. D) Primary hepatocytes from 2 independent donors were treated for 6 and 24 h as in (A) but with two different DCA concentrations before analyzing LDLR mRNA expression. The data represent means ± SD; *p < 0.05, **p < 0.01, ***p < 0.005 one-way ANOVA with post-hoc Tukey test.
ERK5 regulates LDLR expression.
We further investigated the underlying mechanism of DCA-induced LDLR expression and the role of the ERK5/MEF2 pathway, which is activated by DCA8, 10, 23, 24. To this end, wetargeted ERK5 utilizing a small hairpin RNA (shERK5). Reducing ERK5 expression resulted in decreased LDLR mRNA levels in non-treated hematopoietic cells (Fig. 5A). We could not investigate DCA effects on cells express-ing shERK5 because ERK5 is essential to perform OXPHOS and hence DCA is highly toxic in cells with reduced ERK5 levels8, 10, 23, 24. Conversely, overexpression of ERK5 increased LDLR mRNA levels (Fig. 5A). As shown in
Supplemental Fig. 4A, transfection with shERK5 or ERK5 expressing vectors efficiently decreased and increased ERK5 protein levels respectively. Decreasing ERK5 levels with small interference RNA for ERK5 (siERK5) also impaired LDLR expression in primary hepatocytes (Fig. 5B) or in HuH7 hepatic cells (Supplemental Fig. 5A), in which we observed a reduction of 40% on ERK5 protein levels (Supplemental Fig. 4B). Overexpression of ERK5 in Jurkat cells augmented LDLR protein and enhanced LDL uptake (Fig. 5C). The MAPKK MEK5 activates ERK5 in different physiological contexts35. Thus, we next used the MEK5 inhibitor BIX02189, which inhibits its catalytic
function, and showed that it decreased LDLR protein and LDL uptake in Jurkat and OCI-AML3 cells (Fig. 5D). We validated these findings in primary tumor cells derived from a BCL patient (Supplemental Fig. 6). Treatment of these cells with an extremely selective ERK5 inhibitor, XMD8–92, resulted in the reduction of LDLR protein (Supplemental Fig. 6). Taken together, these results indicate that ERK5 is essential for LDLR expression and function in multiple cell lines.
Figure 4. DCA induced LDLR expression in vivo. (A) NSG mice were engrafted with primary human AML
cells. At day 80 post-graft, they were treated with DCA (n = 4) or leave untreated (n = 4). At day 140, mRNA from bone marrow or spleen was isolated and human LDLR mRNA expression was quantified by qPCR. The data represent means ± SD; *p < 0.05, **p < 0.01, ***p < 0.005 student t-test compared to non treated mice. (B) B6 wt mice (n = 4/5 per group) were treated with a dose of DCA (50 mg/kg) everyday intraperitoneally and mouse LDLR mRNA was analyzed in spleen and liver at indicated time points. The data represent means ± SD; *p < 0.05, **p < 0.01, ***p < 0.005 one-way ANOVA with post-hoc Tukey test.
www.nature.com/scientificreports/
Figure 5. ERK5 controled LDLR expression and LDL uptake. (A) 107 Jurkat-TAg cells were transfected with
5 µg of the empty pSUPER Neo vector (control) or with this vector containing a small hairpin RNA for ERK5 (shERK5) or with a pcDNA vector expressing ERK5 (ERK5). Forty-eight hours later mRNA expression of the whole population was analyzed by qPCR and represented as the % of mRNA compared to cells transfected with the empty vector. (B) Primary hepatocytes were transfected with control siRNA (control) or with siRNA against ERK5 (siERK5). 96 h later mRNA was collected and ERK5 and LDLR mRNA expression was analyzed by qPCR. (C) Jurkat cells were transfected with ERK5 as described in (A) and LDLR plasma membrane protein (left) and LDL intake (right) were analyzed by FACs. D) Jurkat (left and center) and OCI-AML3 (right) cells were treated with 5 μM of the MEK5 inhibitor BIX02189 for 24 h and LDLR protein (left) or LDL intake (center and right) were analyzed by FACs. Bar graphs represent means ± SD; *p < 0.05, **p < 0.01, ***p < 0.005 student t-test compared to empty vector transfected cells (control).
AMPK does not mediate DCA-induced LDLR expression.
DCA induces AMPK activation, the main cellular metabolic sensor36. AMPK, by blocking de novo cholesterol production16, 17, could mediate LDLRexpres-sion as it has been observed with berberine or its analogs18, 19. The effect of berberine on LDLR expression was
inhibited by PD9805918 and U012620, 21, In fact, a PD9805918 and U012620, 21 sensible pathway mediated
ber-berine effect. Although these MAPKK inhibitors were initially described as specific MEK1 inhibitors, they also inhibit the ERK5 upstream kinase MEK537. This indicates that DCA may have a similar mechanism of action
than berberine. To test this hypothesis, we used metformin, which stimulates AMPK in Jurkat and OCI-AML cells36. Surprisingly, metformin did not increase, but rather decreased, LDLR mRNA levels (Fig. 6A), protein
levels (Fig. 6B) and LDL intake (Fig. 6C) in two hematopoietic cell lines. Metformin also decreased LDL uptake in HEPG2-C3A cells (Fig. 6D). Moreover, blocking expression of the catalytic subunit of AMPK, AMPKα, with two different siRNA that effectively decrease AMPKα levels38, did not statistically decrease LDLR mRNA. In
summary, these data indicated that the AMPK pathway did not modulate DCA-induced LDLR expression and suggested that we uncovered a totally new pathway that controlled LDLR expression.
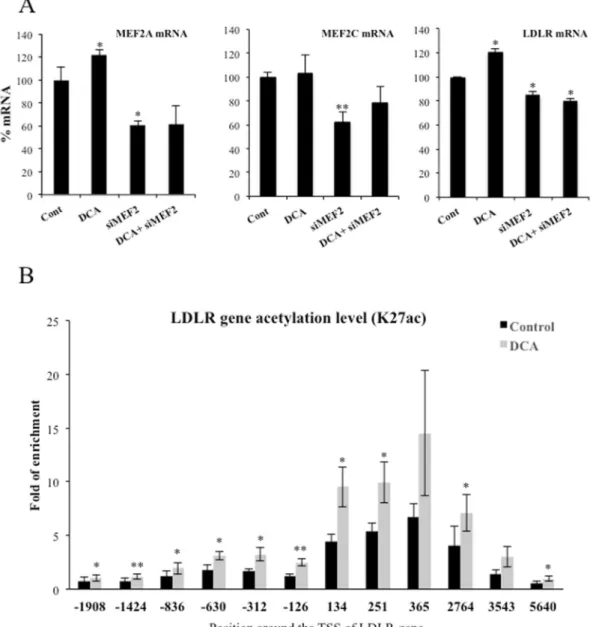
LDLR expression requires MEF2.
ERK5 mediates part of its metabolic functions through the MEF2 fam-ily of transcription factors8, 10, 23, 24. Interestingly, LDLR promoter contains predicted binding sites for MEF2A andC that have been validated in several cell lines (http://genome.ucsc.edu/). Therefore, we performed a knockdown of MEF2A and C in OCI-AML3 cells by siRNA. These siRNA halved mRNA expression of both transcription factors (Fig. 7A) and reduced between 25 and 50% protein levels (Supplemental Fig. 4C). The level of knockdown was sufficient to significantly decrease LDLR mRNA levels (Fig. 7A). Finally, to further investigate whether DCA activated LDLR promoter, we checked the Histone H3 lysine 27 acetylation (H3K27Ac), a modification associated with active gene expression39. We observed that H3K27Ac increased after DCA treatment indicating an increase
of LDLR gene transcription (Fig. 7B).
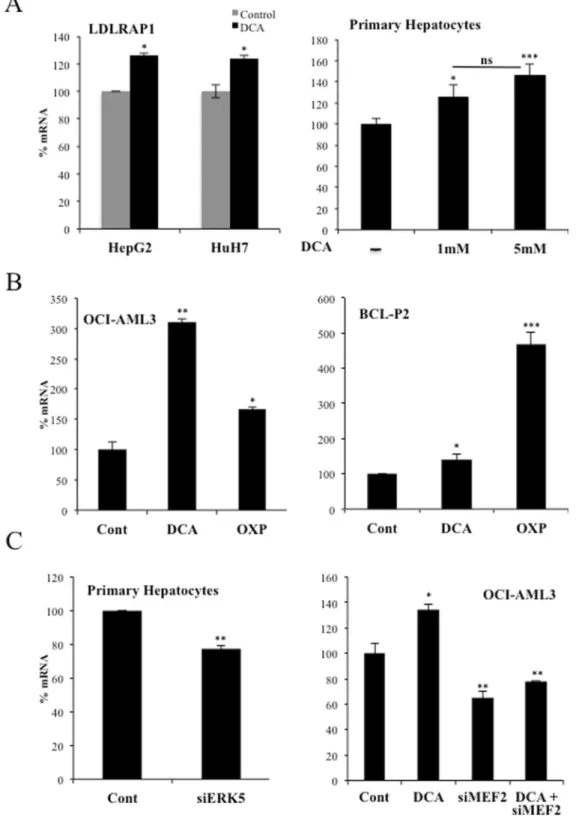
The ERK5/MEF2 pathway also controls expression of the LDL receptor-adapter protein 1
(LDLRAP1).
The LDL receptor-adapter protein 1 (LDLRAP1) is a cytosolic protein that interacts with the cytoplasmic tail of LDLR40. LDLRAP1 promoter contains MEF2 binding sites (http://genome.ucsc.edu/),sug-gesting that the same ERK5/MEF2 pathway could regulate this gene. Consequently with this hypothesis, DCA enhanced LDLRAP1 expression in hepatic cell lines and primary hepatocytes (Fig. 8A). OCI-AML3 and primary tumor B cells also increased LDLRAP1 mRNA after DCA treatment or after incubation in OXPHOS medium (Fig. 8B). In non-stimulated cells, siERK5 reduced LDLRAP1 mRNA in primary hepatocytes, Huh7 cells and primary tumor cells (Fig. 8C (left), Supplementary Fig. 5C). Similarly, OCI-AML3 cells transfected with siMEF2 repressed the expression of LDLRAP1 mRNA (Fig. 8C (right). In summary, cells performing OXPHOS increased the expression of an additional protein involved in LDLR activity.
Discussion
Carbohydrate and lipid metabolism are intrinsically bound and their dysfunction play a major role in cardiovas-cular disease. Diabetes is typically associated to dyslipidemia, but vice versa, lipid changes also disturb glucose metabolism41. DCA, by stimulating PDH activity, decreases glucose catabolism and stimulates OXPHOS6, 7. To
fuel it, cells could rely on fatty acid oxidation (FAO), suggesting that DCA could increase lipid catabolism. LDL particles transport cholesterol and triglycerides; hence an increase in LDLR should allow cells to increase fat avail-ability. We propose that the avidity for fatty acids induces DCA-treated cells to increase LDLR expression and, subsequently, cholesterol uptake. This is supported by our observations showing that OXPHOS, which mediates FAO, reproduces DCA effects on LDLR expression in vitro (Fig. 1 and Supplemental Figs 2 and 3). The mecha-nism requires ERK5, which directs the choice of catabolic substrates8, 10, 23–26 and, hence, is a good candidate to
control increase on fat avidity. Inhibiting ERK5 function by pharmacological or genetic means decrease LDL intake (Fig. 5). This reduces the consumption of exogenous cholesterol but should also affect the consumption of fatty acids. In contrast, in vivo ERK5 stimulation, e.x; by DCA treatment, induces LDLR mRNA (Fig. 4) and would induce triglyceride oxidation as previously observed5, 14.
The ERK5 target MEF2 also regulates this pathway, likely because LDLR promoter contains MEF2 binding sites (see Introduction). ERK5 induces activation of several members of the MEF2 family of transcription factors by several mechanisms. It induces direct phosphorylation at different serines and threonines on MEF2A, C and D27, 28.
It can also activate MEF2A and D by direct interaction because ERK5 serves as a MEF2 coactivator through its signal-dependent direct association with the MEF2 MADS domain. Although, at least MEF2A-dependent tran-scription requires ERK5 kinase activity29, 30. MEF2 mediates several ERK5 effects on metabolism10. However, the
exact mechanism via which DCA stimulates LDLR expression could be multifactorial, although it is a general phenomenon that we have confirmed in several hematopoietic, colon and hepatic cells (Fig. 1), including primary human hepatocytes (Fig. 2), which are the main regulators of cholesterol levels2, 3.
We cannot exclude that other mechanisms play a role in DCA-induced LDLR expression. For example, DCA inhibits HMG CoA reductase activity in liver and leukocytes6. This could lead to an even higher demand on
exogenous cholesterol and subsequently to an increase in LDLR levels. In addition, we have also recently shown that the MAPK ERK5 induces Sirt1 expression24 that also stabilizes LDLR protein42. Therefore, ERK5 could target
LDLR function in multiple ways and some of them independently of MEF2 family. In contrast, we have mainly excluded that ROS levels or AMPK activation play a major role in this process (Figs 3 and 6).
Other drugs could modulate the ERK5/MEF2 pathway to regulate the expression of LDLR. Berberine induces LDLR expression by a MAPK pathway sensitive to PD9805918 and U012620, 21, two inhibitors that block the ERK5
pathway37. Then, ERK5 could also partly mediate berberine effects, although independently of AMPK (Fig. 6).
DCA decreases cholesterol plasma levels in several animal models and humans5, 13–15. In this study, we have
www.nature.com/scientificreports/
5 mM) for chronic treatments. These latter values are in the range of those used in DCA-treated patients11, 12.
Michelakis et al. gave 50 mg/Kg/day of DCA to patients12. On average, this amount of DCA should give a blood
concentration of 4.6 mM, i.e. by considering 70 Kg/patient and a total of 5 L of blood. However, DCA plasma con-centration was around 0.4 mM11, 12 and the ultimate destination of the DCA that was not in blood was unknown.
Figure 6. AMPK did not regulate DCA-induced LDLR expression and LDL uptake. Two different
hematopoietic cell lines were treated with 5 mM metformin for 24 h and LDLR mRNA (A), protein (B) and LDL uptake (C) were analyzed. (D) HepG2-C3A cells were treated as in (A) and LDL uptake was measured. (E) HCT116 cells were transfected with 2 small interference RNA (siRNA) for AMPKα or with control siRNA and treated with 20 mM DCA for 6 h before mRNA analysis.
Perhaps the liver processes DCA very fast as suggested by our results using primary hepatocytes (Fig. 2). There was an attempt to use DCA for treating hypercholesterolemia using similar DCA doses to ours in vivo15. DCA
reduced circulating cholesterol levels in two patients through a mechanism involving a reduction in LDL cho-lesterol15, although both patients initially showed low LDLR surface activity. However, DCA was halted due to
its neuropathological effects15 and this precluded its use to treat high cholesterol. These pathological effects have
been observed in other clinical contexts, e.g. lactic acidosis and stroke-like episodes (MELAS)43. At the beginning
of their DCA treatment, patients quickly eliminate DCA11, 12. In this manuscript, we have observed that in
pri-mary hepatocytes fresh DCA should be daily added to media to keep physiological effects (Fig. 2). As expected, hepatocytes probably metabolize DCA faster than other cell types6. After several weeks of treatment, DCA plasma
concentrations reach a plateau around 0.4 mM11, 12, and during this phase neuropathology appears11. From a
phar-maceutical point of view, it would be desirable to use drugs with the LDLR-stimulating effect of DCA, but without its neuropathological effects. The uncovering of ERK5/MEF2 pathway as a regulator of LDLR expression opens an interesting pharmacological possibility.
Figure 7. DCA required the transcription factor MEF2 to target LDLR promoter. (A) OCI-AML3 cells were
transfected with 40 nM siRNA control or with 20 nM siRNA for each MEF2A and MEF2C (siMEF2). Twenty-four hours later cells were incubated for 24 h with 10 mM DCA. mRNA expression was analyzed by qPCR and represented as the % of mRNA compared to cells transfected with the empty vector. (B) OCI-AML3 cells were incubated for 72 h with 10 mM DCA. Cells were prepared for ChIP analysis using an antibody against H3 acetylation on lysine 27. Acetylation was revealed at different points of the LDLR promoter by using specific oligonucleotides. Bar graphs represent means ± SD; *p < 0.05, **p < 0.01, ***p < 0.005 student t-test compared to empty vector transfected cells (control).
www.nature.com/scientificreports/
Figure 8. DCA induced LDLRAP1 expression. (A) Two hepatic cell lines or primary hepatocytes were treated
with DCA as in Figs 1 and 2 and LDLRAP1 mRNA was analyzed. (B) OCI-AML3 cells (left) and primary cells from a BCL patient (BCL-P2; right) were treated with 5 mM DCA or grown in OXPHOS medium for 2 weeks and LDLRAP1 mRNA was measured. (C) Primary hepatocytes were transfected as in Fig. 5 and expression of LDLRAP1 was analyzed by q-PCR. The bar graphs represent means ± SD of 3 independent experiments performed in triplicate; *p < 0.05, **p < 0.01, ***p < 0.005 student t-test or one-way ANOVA with post-hoc Tukey test.
Methods
Ethical statement.
Experimental procedures were conducted according to the European guidelines for animal welfare (2010/63/EU). Protocols were approved by the Animal Care and Use Committee “Languedoc-Roussillon” (approval number: CEEA-LR-12163). The use of human specimens for scientific purposes was approved by the French National Ethics Committee. All methods were carried out in accordance with the approved guidelines and regulations of this committee. Written informed consent was obtained from each patient prior to surgery.In vivo mouse experiments.
In vivo experiments were carried out using 6 to 8 weeks/old male NSGmice. Mice were bred and housed in pathogen-free conditions in the animal facility of the European Institute of Oncology–Italian Foundation for Cancer Research (FIRC), Institute of Molecular Oncology (Milan, Italy). For engraftment of human cells, 1 million AML cells were injected intravenously (i.v.) through the lateral tail vein in non-irradiated mice. NSG mice with established human AML tumors (day 80 post-graft) were treated with DCA (50 mg/kg, 1 dose/day by gavage, starting at day 1 for 16 consecutive days). Human tumor AML cells gather in mouse spleen and bone marrow, hence we isolated mRNA from these organs. We used human-specific primers to visualize expression of human LDLR mRNA. In a different experiment B6 wt mice were treated with a daily single dose of DCA (50 mg/kg/day) intraperitoneally and mouse LDLR mRNA was analyzed in spleen and liver at different time points.
Cell lines and culture conditions.
The leukemic human cell lines T Jurkat TAg and OCI-AML3 were grown in RPMI 1640–Glutamax (GIBCO) supplemented with 5% (Jurkat) or 10% (OCI-AML3) FBS10, 24. Primarycells from a lymphoma B cell patient (BCL-P2) were grown in the same medium with 10% FBS. In certain exper-iments cells were grown in RPMI 1640 without glucose (GIBCO 11879) with the addition of 2 mM glutamine and 10 mM galactose (OXPHOS medium). The Jurkat TAg cells carry the SV40 large T Ag to facilitate cell trans-fection. HepG2-C3A and HuH7 cells were grown in MEM and DMEM respectively supplemented with FBS, sodium pyruvate, glutamine, penicillin and streptomycin. The HCT116 human colon cancer cells were cultured in low glucose (5 mM) DMEM medium supplemented with 10% FBS. Cellular confluence during experiments was between 80–85%.
Human liver samples and preparation of PHHs cultures.
Liver samples were obtained from liver resections performed in adult patients for medical reasons. Human hepatocytes isolation and culture were per-formed as described previously44. Briefly, after liver perfusion, hepatocytes were counted and cell viability wasassessed by trypan blue exclusion test. A suspension of 1 × 10⁶ cells/mL per well was added in 12-well plates
pre-coated with type I collagen (Beckton Dickinson) and cells were allowed to attach for 12 h. Then, the super-natant containing dead cells and debris was carefully removed and replaced with 1 mL of serum-free long-term culture medium (Lanford medium, LNF). The number of confluent attached cells was estimated at ~1.5 × 10⁵
cells/cm2.
Reagents and antibodies.
DCA was from Santa Cruz Technologies. Galactose and glutamine were from GIBCO. Human anti-LDLR-PE and IgG were from BD Biosciences and 7AAD from Beckman. The MEK5 inhib-itor BIX02189 and the ERK5 inhibinhib-itor XMD8–92 were from Selleck. RIPA buffer to prepare protein extracts was from Euromedex. The complete protease inhibitor cocktail (Complete EDTA-free) and the phosphatase inhibitor cocktail (PhosSTOP) were from Roche. ERK5 and MEF2A/C antibodies were from Cell Signaling Technology and Abcam respectively. The antibody against β-Actin and HRP-labeled secondary antibodies were from Sigma.Transient transfection.
Jurkat cells in logarithmic growth phase were transfected with the indicated amounts of plasmid by electroporation45, 46. In each experiment, cells were transfected with the same total amountof DNA by supplementing with empty vector. Cells were incubated for 10 min at RT with the DNA mix and elec-troporated using the Gene Pulser Xcell
™
Electroporation system (Bio-Rad) at 260 mV, 960 mF in 400 µl of RPMI 1640. Expression of the different proteins was confirmed by western blot. The transfection efficiency in Jurkat TAg cells is between 60 and 80%. OC-AML-3 cells were transfected using Amaxa TM D-Nucleofector TM Lonza Kitaccording to manufactured protocol. In HuH7 and HCT116 cells, transfection of 30–50 nM siRNAs was carried out using Lipofectamine RNAiMAX (Invitrogen) in Opti-MEM (Invitrogen), according to the manufacturer’s instructions. Primary hepatocytes were transfected twice at days 1 and 3 post-seeding. Cells were harvested 48 to 96 h post-transfection.
Plasmids.
The expression vectors for ERK5, the pSUPER expression vector for GFP alone or GFP plus shERK5 and the pSiren-retroQ-puro (BD Biosciences) retroviral vectors for shERK5 and control have been pre-viously described45. Control, MEF2A and C and ERK5 siRNA were ON-TARGETplus SMARTpools (mixture of4 siRNA) were from Dharmacon.
Counting and determination of cell viability.
Cell number, viability and cell death was analyzed with the Muse Cell Analyzer (Millipore) by incubating cells with Muse Count & Viability and Annexin V and Dead Cell kits respectively, following manufacturer’s instructions.ROS measurement.
Cells lines were plated at 300,000 cells/ml and treated with DCA for the indicated times, harvested and counted to perform further analysis. To evaluate ROS levels, we labeled cells with CellROX®
Deep Red Reagent or with CH-H2DCFDA (Life Technologies) for 30 minutes and analyzed them by FACs fol-lowing manufacturer’s instructions.www.nature.com/scientificreports/
RT-PCR and DNA sequencing.
Total RNA was extracted using NucleoSpin RNA isolation col-umns (Macherey-Nagel), reverse transcription was carried out using iScript™
cDNA Synthesis Kit (Biorad). Quantitative PCR was performed with KAPA SYBR Green qPCR SuperMix (Cliniscience) and a CFX Connect™
Real-Time qPCR machine (Biorad) with LDLR, LDLRAP1, ERK5 and actin primers (Supplemented Fig. 7). All samples were normalized to β-actin mRNA levels. Results are expressed relative to control values arbitrarily set at 100.Immunoblotting.
Protein analysis by immunoblotting was performed essentially as previously described45.Briefly, samples were collected, washed out with PBS and lysed with RIPA buffer. Protein concentration was deter-mined by BCA assay (Pierce) before electrophoresis in 4–15% TGX gels (BioRad) and equal amount of protein was loaded in each well. Protein transfer was performed in TransTurbo system (BioRad) in PVDF membranes. After blocking for 1 h with 5% non-fat milk, membranes were incubated overnight at 4 °C in agitation with pri-mary antibodies, washed three times with PBS-Tween 0,1% and incubated with the appropriate HRP-labeled secondary antibody for 1 h. Membranes were washed out three times with PBS-Tween 0,1% and developed with Substrat HRP Immobilon Western (Millipore). Band quantification was performed using the “ImageLab” soft-ware from BioRad and represented as the ratio between the protein of interest and a control protein i.e. actin. The value of 1 is arbitrarily given to control cells. One blot representative of several experiments is shown.
LDL Intake.
After treatment cells were incubated with BODIPY FL LDL (Invitrogen) in PBS with 2% FBS and incubated at 37 °C for 30 min. Cells were then washed and suspended in 200–250 μl PBS 2% FBS and analyzed using a Gallios flow cytometer (Beckman) and the Kaluza software.Flow Cytometry.
Briefly, 1 × 10⁶ cells were stained with antibody in PBS with 2% FBS and incubated at 37 °Cfor 30 min. Cells were then washed and suspended in 200–250 μl PBS 2% FBS and staining was analyzed using a Gallios flow cytometer (Beckman) and the Kaluza software.
ChIP analysis.
OCI-AML3 cells were treated with 10 mM DCA for 72 h. Ten million cells were centrifuged (5 min; 1200 rpm) and the pellet was washed two times in 1X phosphate-buffered saline (PBS) at room tempera-ture and suspended in 10 mL of 1X PBS. Cells were fixed in 1% paraformaldehyde (Electron Microscopy Sciences) at room temperature for 5 min. Fixation wa lysed in 1 ml of cell lysis buffer (5 mM PIPES, 85 mM KCl, 0.5% NP40, Na Butyrate 10 mM + 2X protease inhibitor cocktail (Halt™
Protease Inhibitor Cocktail, EDTA-Free (100X), Thermofischer)) at 0 °C for 10 min. Nuclei were recovered by centrifugation (10 min, 5000 rpm) at 4 °C and lysed in 250 µl nuclei lysis buffer (50 mM Tris-HCl pH 7.5, 1% SDS, 10 mM EDTA, Na Butyrate 10 mM + Halt™
Protease Inhibitor Cocktail (3X)) at 4 °C for at least 2 hours. 250 µl of each sample were then sonicated 2 times for 5 min (30 s on/off) at 4◦C using a Bioruptor (Diagenode). After sonication, absorbances at 280 nm (A280) of 1/100 diluted samples were measured and A280nm and was adjusted to 0.133 with nuclei lysis buffer. One hun-dred microliter were used for ChIP experiments in a final volume of 1 ml. Samples were incubated under gentle agitation at 4 °C overnight in the presence of 3 µg of either a specific antibody or a negative control. Antibodies (anti-K27Ac Ab4729 (Abcam) and negative control IgG (Diagenode)) were previously bound to DYNA Beads Protein G Novex (Life Technology) according to the supplier’s recommendations. Dynabeads-bound immu-noprecipitates were sequentially washed once with a low salt buffer (50 mM Tris-HCl pH 7.5, 150 mM NaCl, 1% triton, 0.1% SDS, 1 mM EDTA, 1 mM Na Butyrate + Halt™
Protease Inhibitor Cocktail (1X)), a high-salt buffer (50 mM Tris-HCl pH 7.5, 500 mM NaCl, 1% triton, 0.1% SDS, 1 mM EDTA, 1 mM Na Butyrate) and a LiCl-containing buffer (20 mM Tris-HCl pH 7.5, 250 mM LiCl, 1% NP40, 1% Na deoxycholate, 1 mM EDTA, 1 mM Na Butyrate) and, then, twice with a TE buffer (10 mM Tris-HCl pH 7.5, 1 mM EDTA, Tween 20 0.02%). Samples were then eluted in 250 µL of elution buffer (100 mM NaHCO3, 1% SDS), and DNA-protein complexes were incubated at 65 °C for 5 hours to reverse crosslinks. Samples were then treated with 100 mg/ml proteinase K and 100 mg/ml RNAse A at 45 °C for 2 hours to digest proteins and contaminating RNA. DNA was purified with an extraction kit (NucleoSpin Gel and PCR clean-up, Macherey-Nagel) according to the manufacturer’s recom-mendations and qPCR analysis was performed using the Roche LightCycler 480 real-time PCR system. The data were normalized with inputs taken from samples before the immunoprecipitation and treated under the same conditions. The primers used to amplify various regions of LDLR gene promoter.Statistical analysis.
The statistical analysis of the difference between means of paired samples was per-formed using the paired t test. Analysis of multiple comparisons with single control was perper-formed using one-way ANOVA with post-hoc tukey test. The results are given as the confidence interval (*p < 0.05, **p < 0.01, ***p < 0.005). All the experiments described in the figures with a quantitative analysis have been performed at least three times in duplicate. Other experiments were performed three times with similar results.Data availability.
All data are available upon request.References
1. Mozaffarian, D. et al. Executive Summary: Heart Disease and Stroke Statistics-2016 Update: A Report From the American Heart Association. Circulation 133, 447–454 (2016).
2. Goedeke, L. et al. MicroRNA-148a regulates LDL receptor and ABCA1 expression to control circulating lipoprotein levels. Nat Med
21, 1280–1289 (2015).
3. Goldstein, J. L. & Brown, M. S. The LDL receptor. Arteriosclerosis, thrombosis, and vascular biology 29, 431–438 (2009).
4. Go, G. W. & Mani, A. Low-density lipoprotein receptor (LDLR) family orchestrates cholesterol homeostasis. The Yale journal of
biology and medicine 85, 19–28 (2012).
6. Stacpoole, P. W. The pharmacology of dichloroacetate. Metabolism: clinical and experimental 38, 1124–1144 (1989).
7. Michelakis, E. D., Webster, L. & Mackey, J. R. Dichloroacetate (DCA) as a potential metabolic-targeting therapy for cancer. Br J
Cancer 99, 989–994 (2008).
8. Charni, S. et al. Oxidative phosphorylation induces de novo expression of the MHC class I in tumor cells through the ERK5 pathway.
J Immunol 185, 3498–3503 (2010).
9. Allende-Vega, N. et al. The presence of wild type p53 in hematological cancers improves the efficacy of combinational therapy targeting metabolism. Oncotarget 6, 19228–19245 (2015).
10. Khan, A. U. et al. Human Leukemic Cells performing Oxidative Phosphorylation (OXPHOS) Generate an Antioxidant Response Independently of Reactive Oxygen species (ROS) Production. EBioMedicine 3, 43–53 (2016).
11. Stacpoole, P. W., Kurtz, T. L., Han, Z. & Langaee, T. Role of dichloroacetate in the treatment of genetic mitochondrial diseases. Adv
Drug Deliv Rev 60, 1478–1487 (2008).
12. Michelakis, E. D. et al. Metabolic modulation of glioblastoma with dichloroacetate. Sci Transl Med 2, 31ra34 (2010).
13. Ribes, G., Valette, G. & Loubatieres-Mariani, M. M. Metabolic effects of sodium dichloroacetate in normal and diabetic dogs.
Diabetes 28, 852–857 (1979).
14. Stacpoole, P. W., Moore, G. W. & Kornhauser, D. M. Metabolic effects of dichloroacetate in patients with diabetes mellitus and hyperlipoproteinemia. N Engl J Med 298, 526–530 (1978).
15. Moore, G. W. et al. Reduction of serum cholesterol in two patients with homozygous familial hypercholesterolemia by dichloroacetate. Atherosclerosis 33, 285–293 (1979).
16. Li, Y. et al. AMPK phosphorylates and inhibits SREBP activity to attenuate hepatic steatosis and atherosclerosis in diet-induced insulin-resistant mice. Cell Metab 13, 376–388 (2011).
17. Liu, S. et al. AICAR-Induced Activation of AMPK Inhibits TSH/SREBP-2/HMGCR Pathway in Liver. PLoS One 10, e0124951 (2015).
18. Brusq, J. M. et al. Inhibition of lipid synthesis through activation of AMP kinase: an additional mechanism for the hypolipidemic effects of berberine. Journal of lipid research 47, 1281–1288 (2006).
19. Wang, Y. X. et al. Synthesis and structure-activity relationship of berberine analogues in LDLR up-regulation and AMPK activation.
Bioorganic & medicinal chemistry 20, 6552–6558 (2012).
20. Kong, W. et al. Berberine is a novel cholesterol-lowering drug working through a unique mechanism distinct from statins. Nat Med
10, 1344–1351 (2004).
21. Abidi, P., Zhou, Y., Jiang, J. D. & Liu, J. Extracellular signal-regulated kinase-dependent stabilization of hepatic low-density lipoprotein receptor mRNA by herbal medicine berberine. Arteriosclerosis, thrombosis, and vascular biology 25, 2170–2176 (2005). 22. Zheng, X. et al. The effects of chylomicron remnants enriched in n-3 or n-6 polyunsaturated fatty acids on the transcription of genes
regulating their uptake and metabolism by the liver: influence of cellular oxidative state. Free Radic Biol Med 32, 1123–1131 (2002). 23. Rathore, M. G. et al. The NF-kappaB member p65 controls glutamine metabolism through miR-23a. Int J Biochem Cell Biol 44,
1448–1456 (2012).
24. Lopez-Royuela, N. et al. Extracellular-signal-regulated kinase 5 modulates the antioxidant response by transcriptionally controlling Sirtuin 1 expression in leukemic cells. Int J Biochem Cell Biol 53, 253–261 (2014).
25. Villalba, M. et al. Chemical metabolic inhibitors for the treatment of blood-borne cancers. Anti-cancer agents in medicinal chemistry
14, 223–232 (2014).
26. Villalba, M. et al. From tumor cell metabolism to tumor immune escape. Int J Biochem Cell Biol 45, 106–113 (2013).
27. Kato, Y. et al. BMK1/ERK5 regulates serum-induced early gene expression through transcription factor MEF2C. EMBO Journal 16, 7054–7066 (1997).
28. Kato, Y. et al. Big mitogen-activated kinase regulates multiple members of the MEF2 protein family. Journal of Biological Chemistry
275, 18534–18540 (2000).
29. Kasler, H. G., Victoria, J., Duramad, O. & Winoto, A. ERK5 is a novel type of mitogen-activated protein kinase containing a transcriptional activation domain. Mol Cell Biol 20, 8382–8389 (2000).
30. Yang, C. C., Ornatsky, O. I., McDermott, J. C., Cruz, T. F. & Prody, C. A. Interaction of myocyte enhancer factor 2 (MEF2) with a mitogen-activated protein kinase, ERK5/BMK1. Nucleic Acids Res 26, 4771–4777 (1998).
31. Catalán, E. et al. MHC-I modulation due to metabolic changes regulates tumor sensitivity to CTL and NK cells. Oncoimmunology 4, e985924 (2015).
32. Reitzer, L. J., Wice, B. M. & Kennell, D. Evidence that glutamine, not sugar, is the major energy source for cultured HeLa cells. J Biol
Chem 254, 2669–2676 (1979).
33. Rossignol, R. et al. Energy substrate modulates mitochondrial structure and oxidative capacity in cancer cells. Cancer Res 64, 985–993 (2004).
34. Stacpoole, P. W., Harwood, H. J. Jr. & Varnado, C. E. Regulation of rat liver hydroxymethylglutaryl coenzyme A reductase by a new class of noncompetitive inhibitors. Effects of dichloroacetate and related carboxylic acids on enzyme activity. J Clin Invest 72, 1575–1585 (1983).
35. Drew, B. A., Burow, M. E. & Beckman, B. S. MEK5/ERK5 pathway: the first fifteen years. Biochim Biophys Acta 1825, 37–48 (2012). 36. Allende-Vega, N. et al. p53 is activated in response to disruption of the pre-mRNA splicing machinery. Oncogene 32, 1–14 (2013). 37. Kamakura, S., Moriguchi, T. & Nishida, E. Activation of the protein kinase ERK5/BMK1 by receptor tyrosine kinases. Identification
and characterization of a signaling pathway to the nucleus. Journal of Biological Chemistry 274, 26563–26571 (1999).
38. Allende-Vega, N., Dias, S., Milne, D. & Meek, D. Phosphorylation of the acidic domain of Mdm2 by protein kinase CK2. Mol Cell
Biochem 274, 85–90 (2005).
39. Wang, Z. et al. Combinatorial patterns of histone acetylations and methylations in the human genome. Nat Genet 40, 897–903 (2008).
40. Fellin, R., Arca, M., Zuliani, G., Calandra, S. & Bertolini, S. The history of Autosomal Recessive Hypercholesterolemia (ARH). From clinical observations to gene identification. Gene 555, 23–32 (2015).
41. Parhofer, K. G. Interaction between Glucose and Lipid Metabolism: More than Diabetic Dyslipidemia. Diabetes & metabolism
journal 39, 353–362 (2015).
42. Miranda, M. X. et al. The Sirt1 activator SRT3025 provides atheroprotection in Apoe−/− mice by reducing hepatic Pcsk9 secretion and enhancing Ldlr expression. European heart journal 36, 51–59 (2015).
43. Kaufmann, P. et al. Dichloroacetate causes toxic neuropathy in MELAS: a randomized, controlled clinical trial. Neurology 66, 324–330 (2006).
44. Pichard, L. et al. Human hepatocyte culture. Methods Mol Biol 320, 283–293 (2006).
45. Garaude, J. et al. ERK5 activates NF-kappaB in leukemic T cells and is essential for their growth in vivo. J Immunol 177, 7607–7617 (2006).
46. Garaude, J. et al. SUMOylation regulates the transcriptional activity of JunB in T lymphocytes. J Immunol 180, 5983–5990 (2008).
Acknowledgements
FACs analysis was performed at the platform Montpellier Rio Imaging (MRI). The collection of clincial data and samples (HEMODIAG_2020) at the CHRU Montpellier was supported by funding from Région Languedoc
www.nature.com/scientificreports/
Roussillon. All our funders are public or charitable organizations. This work was supported by a grant from Fondation de France (0057921), fellowship from the Higher Education Commission, Pakistan (AK) and fellowships from the Ministère de l’Enseignement Supérieur et de la Recherche (MESR) (DNV).
Author Contributions
A.K., N.A.-V., D.G., S.G.-C., C.G., D.-N.V., S.B., S.O., G.T., M.B., F.B. and I.L.-M. perform experiments. F.B., J.-M.V., I.J., L.F., C.-H.L., J.H., M.D.-C. and M.V. wrote the main manuscript text. All authors reviewed the manuscript.
Additional Information
Supplementary information accompanies this paper at doi:10.1038/s41598-017-10339-5 Competing Interests: The authors declare that they have no competing interests.
Publisher's note: Springer Nature remains neutral with regard to jurisdictional claims in published maps and
institutional affiliations.
Open Access This article is licensed under a Creative Commons Attribution 4.0 International
License, which permits use, sharing, adaptation, distribution and reproduction in any medium or format, as long as you give appropriate credit to the original author(s) and the source, provide a link to the Cre-ative Commons license, and indicate if changes were made. The images or other third party material in this article are included in the article’s Creative Commons license, unless indicated otherwise in a credit line to the material. If material is not included in the article’s Creative Commons license and your intended use is not per-mitted by statutory regulation or exceeds the perper-mitted use, you will need to obtain permission directly from the copyright holder. To view a copy of this license, visit http://creativecommons.org/licenses/by/4.0/.