Computational Evolutionary Genomics:
Phylogenomic Models
Spanning Domains, Genes, Individuals, and Species
by
Yi-Chieh Wu
B.S.E.E., Rice University (2007)
S.M., Massachusetts Institute of Technology (2009)
Submitted to the Department of Electrical Engineering and Computer Science
in partial fulfillment of the requirements for the degree of
Doctor of Philosophy in Electrical Engineering and Computer Science
at the
MASSACHUSETTS INSTITUTE OF TECHNOLOGY
February 2014
@ Massachusetts Institute of Technology 2014. All rights reserved.
OF TECHNOLOGY
LIBRARIES
Author...
....-...---Department of Electrical Engineering and Computer Science January 31, 2014
Certified 14(y ... ...--...
Manolis Kellis
Professor of Computer Science Thesis Supervisor
Accepted by... ...---...
(
(J Leslie A. KolodziejskiComputational Evolutionary Genomics:
Phylogenomic Models
Spanning Domains, Genes, Individuals, and Species
by
Yi-Chieh Wu
Submitted to the Department of Electrical Engineering and Computer Science on January 31, 2014, in partial fulfillment of the
requirements for the degree of
Doctor of Philosophy in Electrical Engineering and Computer Science
Abstract
Computational techniques have long been applied to biological data to address a wide range of evolutionary questions. In phylogenetics, methods for reconstructing gene histories from sequence data have enabled researchers to better understand how evolution shapes gene content; for example, the identification of evolutionarily-related genes has allowed for the mapping of functions across species and the discovery of novel functions. Such predictions have become increasingly important over the last ten to fifteen years, as technology has reduced the cost of sequencing and increased processing power, leading to vast genomic datasets with little, if any, functional information. In turn, the growing availability of genomes has led to increased power for biological signal discovery and revealed insight into the core evolutionary forces that govern our existence.
However, to realize the full potential in genomic and evolutionary studies, we require accurate,
efficient, and scalable methods that are widely applicable. In this thesis, I address this need
by developing novel computational approaches for reconstructing gene evolutionary histories. In
particular, I consider models for gene family evolution that take into account (1) nucleotide or amino acid substitution, (2) genetic drift (leading to deep coalescence), (3) gene duplication and loss, (4) horizontal gene transfer, and (5) domain rearrangement, and I present new phylogenetic algorithms for (1) eukaryotic gene tree reconstruction, (2) prokaryotic gene tree reconstruction,
(3) gene tree-species tree reconciliation, and (4) sub-gene-level reconstruction. Through extensive
benchmarking, I show that these methods dramatically improve reconstructions compared to state-of-the-art programs; in addition, they are efficient and require few modeling assumptions or parameters, making them applicable to a broad range of species and large datasets. As evidence, I apply these methods to clades of 12 Drosophila, 16 fungi, 15 primates, and 11 cyanobacteria, as well as to simulated phylogenies with up to 200 taxa, and demonstrate the large impact of accurate phylogenetic inference on downstream evolutionary analyses.
These results demonstrate the power of computational phylogenetics, and I believe that with the continued development and adoption of such methods, we can address fundamental biological questions with many important implications for future investigations of gene and genome evolution. Thesis Supervisor: Manolis Kellis
Title: Professor of Computer Science
Acknowledgments
I express my sincerest thanks to the following, without whom this thesis would not have been possible:
To my advisor, Manolis Kellis, for his advice, support, and mentorship throughout my graduate career. I am so grateful and privileged to have met an advisor willing to take the risk of letting a graduate student with little biological background enter the computational biology field. His continuous encouragement and guidance have been invaluable. I also appreciate the enormous freedom granted in choosing projects and the opportunities to collaborate with various consortia. To members of the Computational Biology Group, for the many discussions and insights, and for their friendship. I would particularly like to thank Matt Rasmussen and Mukul Bansal, who taught me much about evolution and phylogenetics and who contributed greatly to the work presented in this thesis. Many thanks also to the rest of the evolution office: Ran Libeskind-Hadas, Mike Lin,
Irwin Jungreis, Rob Waterhouse, Olivier Jaillon, Max Wolf, and Eva Novoa.
To my collaborators, in particular, Javier Herrero, for discussions on phylogenetic pipelines. Thanks also to various members of the ENCODE, modENCODE, and mouseENCODE consortia and the Boston Evolutionary Genomics Supergroup.
To my thesis committee, Eric Alm, Daniel Hartl, and Constantinos Daskalakis, for discussions at various stages of this work.
To various MIT EECS professors and staff, for their advice, support, and guidance. In particular, I would like to acknowledge my academic advisor, Asuman Ozdaglar; my Masters advisor, John
Wyatt; EECS Graduate Officers, Leslie Kolodziejski and Terry Orlando; and EECS Graduate Office
staff, Janet Fischer and Alicia Duarte.
To Rice University professors Lydia Kavraki, Richard Baraniuk, Michael Orchard, Stephen Wong, and Steven Cox, for their advice, support, and mentorship, and for encouraging me to pursue research and graduate school.
To my friends, for the many conversations, diversions, and support.
Finally, to my parents, Rongsong and Manhung, and my sisters, Emmy and Diana, for their constant love, support, and encouragement.
This work was made possible due to financial support from the National Science Foundation, the Kambourides Fellowship, and the MIT/Whitehead/Broad Computational Genetics Training Program through the National Institutes of Health.
Contents
1
Introduction1.1 Thesis contributions . . . .
1.2 Gene and genome evolution . .
1.2.1 Mutation . . . .
1.2.2 Genetic drift . . . .
1.2.3 Gene duplication (and loss)
1.2.4 Horizontal gene transfer
1.2.5 Gene fusion and fission.
1.2.6 Other evolutionary events
1.3 Phylogenetics and phylogenomics 1.3.1 Gene trees and species trees
1.3.2 Reconciliation . . . .
1.3.3 Orthologs and paralogs . 1.3.4 Phylogenetic methods . .
1.3.5 Phylogenomic methods. .
2 Statistically informed gene tree reconstruction TreeFix L.1 2.2 2.3 2.4 2.5
with gene duplication and loss:
Euklaryotic gene tree reconstruct on . . . .
2.1.1 Existing work . . . . 2.1.2 Contributions . . . . Gene tree landscape . . . . 2.2.1 Statistical comparison of sequence support for multiple topologies 2.2.2 Reconciliation cost as a heuristic for topological accuracy . . . . 2.2.3 Tree search . . . . The TreeFix algorithm . . . . Benchmarks . . . . 2.4.1 Simulated datasets . . . . 2.4.2 Biological dataset of 16 fungal genomes . . . .
2.4.3 Alternative species tree topologies . . . . Discussion . . . .
3 Species-aware gene tree reconstruction with gene TreeFix-DTL
3.1 Prokaryotic gene tree reconstruction . . . .
3.1.1 Existing work . . . .
3.1.2 Contributions . . . .
3.2 The TreeFix-DTL algorithm . . . .
3.3 Benchmarks . . . .
3.3.1 Simulated datasets . . . .
duplication, transfer, and loss:
3.4 Resolving gene tree-species tree conflict in 11 cyanobacteria genomes . . . .
11 12 13 13 13 14 14 15 15 15 16 17 17 18 19 21 21 22 22 23 24 25 25 26 28 28 32 34 38 41 42 43 43 45 47 47 53 7
3.5 Discussion . . . . 4 Unified reconciliation with gene duplication, loss, and deep coalescence: DLCpar 59
4.1 Gene tree-species tree reconciliation . . . . 60
4.1.1 Existing work . . . . 61
4.1.2 Contributions . . . . 61
4.2 A unified model for gene family evolution . . . . 62
4.2.1 The labeled coalescent tree (LCT) . . . . 64
4.3 The DLCpar algorithm . . . . 65
4.3.1 Inferring an optimal species map . . . . 66
4.3.2 Enumerating locus maps . . . . 66
4.3.3 Inferring and optimal order for each locus map . . . . 68
4.3.4 Computing relative locus maps . . . . 68
4.3.5 Inferring an optimal locus map and order . . . . 69
4.4 Benchmarks . . . . 69
4.4.1 Simulated datasets . . . . 69
4.4.2 Biological dataset of 16 fungal genomes . . . . 75
4.5 D iscussion . . . . 77 5 Evolution and reconstruction with domain rearrangements:
5.1 Domain and architecture rearrangements . . . .
5.1.1 Existing work . . . .
5.1.2 Contributions . . . .
5.2 Architecture-aware phylogenomic pipeline . . . .
5.2.1 D efinitions . . . .
5.2.2 Architecture evolution using directed acyclic graphs . .
5.2.3 Overview of the pipeline . . . .
5.2.4 Identifying modules and module families . . . .
5.2.5 Clustering architectures into architecture families . . . . 5.2.6 Reconstructing gene architecture histories . . . .
5.3 The STAR-MP algorithm . . . .
5.3.1 Inferring most parsimonious architecture scenarios .
5.3.2 Reconstructing simulated architecture scenarios ... 5.4 Analysis of 9 Drosophila genomes . . . .
5.4.1 Validation . . . .
5.4.2 Module boundaries are driven by selection . . . .
STAR-MP 83 84 84 85 88 88 89 89 89 91 91 92 92 93 94 95 97
5.4.3 Gene ontologies associated with rapid architecture evolution reflect adaptation 100
5.4.4 Protein-protein interactions suggest fusion and fission of complementary genes 5.4.5 Trends in architecture scenarios revealed by STAR-MP reconstruction . . . .
5.4.6 Genome annotation errors contribute to lineage-specific events . . . . 5.4.7 Phylogenomic pipeline recovers known examples of chimeric genes . . . .
5.4.8 Gene fusion and fission events reflect a small number of common mechanisms
5.5 D iscussion . . . .
6 Conclusion
6.1 Sum m ary . . . .
6.2 Future directions . . . .. . . . .
6.3 The road ahead . . . .. . . . . 100 101 105 107 109 113 115 115 116 118 8 56
A Models for gene duplication and loss 121
A.1 Likelihood-based tests of topologies ... 121
A.2 Statistical error rate analysis . . . . 122
A.3 Reconciliation cost as a metric of gene tree accuracy . . . . 123
A.4 Parameters for gene tree reconstruction and reconciliation . . . . 124
A .5 Search efficiency . . . . 124
A.6 Scalability with gene family size . . . . 125
A.7 Effect of species tree divergence and size . . . . 126
A.8 Additional figures and tables . . . . 128
B Models for gene duplication, transfer, and loss 135 B.1 The duplication-transfer-loss (DTL) reconciliation model . . . 135
B.2 Complexity analysis of TreeFix-DTL . . . 136
B.3 Parameters for simulated datasets . . . 136
B.4 Parameters for gene tree reconstruction . . . 137
B.5 Scalability and speed . . . 138
B.6 Additional simulated datasets . . . 139
B.7 Additional figures and tables . . . 141
C Models for gene duplication, loss, and deep coalescence 147 C.1 The labeled coalescent tree . . . . 147
C.2 The DLCpar algorithm . . . . 152
C.3 Proofs ... ... ... 159
C.4 Comparison with the three-tree model . . . . 164
C.5 Relating duplication, loss, and deep coalescence in a parsimony framework . . . . 165
C.6 Duplication, loss, and coalescence costs . . . . 166
C.7 Search heuristics . . . . 167
C.8 Simulated species trees . . . . 168
C.9 Additional figures and tables . . . . 170
D Models for domain rearrangements 179 D.1 Model of architecture evolution . . . .. 179
D.2 Domain database annotations . . . . 180
D.3 Promiscuous modules . . . 182
D.4 Known rates of evolutionary events . . . . 182
D.5 Cost of evolutionary events . . . . 182
D.6 Validation . . . ... . . .. . . . . 184
D.7 No substitution rate bias in merge/split families . . . 185
D.8 GO term and Pfam domain enrichment/depletion . . . 186
D.9 Functional complementarity using DroID database . . . . 187
D.10 PPI in conservative set of architecture families . . . . 187
D.11 Detection of frameshift mutations . . . . 187
D.12 Systematic detection of gene fusion and fission by mechanism . . . . 188
D.13 Additional figures and tables . . . . 189
D.14 Bayesian reconstruction of domain rearrangements . . . . 197
Bibliography 204
Chapter 1
Introduction
Evolution of genes and genomes is responsible for the immense biological diversity of our planet, ranging from the multitude of life forms, to the assortment of protein structural domains and gene functions, to the variation of traits between individuals within and across populations of species. However, despite its central role as the most fundamental property of life, the process of evolution remains poorly understood, and current models have typically been unable to span the diversity of scales at which evolution can act.
The field of phylogenetics provides rigorous tools for the study of evolution. At its most basic level, the goal of phylogenetics is to reconstruct the evolutionary history, or phylogeny, of a group of related taxonomic units, for example, of genes or species. Whereas historically, phylogenies relied on observable, typically morphological, traits and were computed by hand, with new technological advances, modern phylogenies use molecular data and increasingly sophisticated computational tools. With the explosion of molecular biology techniques, it is now commonplace to infer phylogenies of hundreds and sometimes thousands of sequences, thus requiring new computational models for their systematic reconstruction.
The field of phylogenomics deals specifically with the study of phylogenetics at the genome scale [58, 59] and is uniquely enabled by the ability to compare multiple complete genomes. Working at the genome scale enables us to study parallels in the effects and dynamics of evolutionary processes across genes in the same species, and across species for the same gene. This has led to a better understanding of how evolution shapes the genomes of many different species, including humans [73, 92, 95, 144, 166, 202, 213, 214, 280], flies [231], fungi [26], plants [122], yeast [130], and cyanobacteria [287]. Even more ambitious goals are on the horizon, as in the next few years, thanks to next-generation sequencing, we expect thousands of human genomes [245], tens of thousands of vertebrate genomes [77], and millions of bacterial genomes.
Despite rapid technological advances, however, we have yet to realize the full potential in
genomic and evolutionary studies. In particular, phylogenomic methods still suffer from a number of limitations, mostly stemming from statistical challenges of distinguishing biological signal from noise, algorithmic challenges of scaling to large datasets, and modeling challenges of generalizing across genomes and genomic features at multiple scales. This leads to inaccurate analyses and can disastrously affect evolutionary-based inferences.
1.1
Thesis contributions
The goal of this thesis is to develop accurate, efficient, scalable, and general computational methods for understanding gene and genome evolution. The thesis is organized as follows:
" I begin with a review of gene and genome evolution, introduce basic phylogenetic concepts,
and discuss existing approaches to the problem of reconstructing and analyzing evolutionary histories (Chapter 1).
" I discuss gene tree reconstruction in the presence of duplications and losses, focusing on the
problem of gene tree topological errors caused by lack of phylogenetic signal. I then present a statistical framework for gene tree error correction in eukaryotic species, implement this framework in the program TreeFix, and demonstrate the accuracy of this method through extensive sets of benchmarks from both real and simulated data (Chapter 2).
" I discuss how gene tree reconstruction is complicated by the addition of horizontal gene transfer,
which plays an important role in prokaryotic gene family evolution. I then present a method, TreeFix-DTL, for gene tree error correction in prokaryotic species. In addition, I apply this method to a data set of eleven cyanobacteria genomes and show that the extent of horizontal gene transfer within this clade has likely been substantially overestimated (Chapter 3).
" I discuss gene family evolution within eukaryotic species separated by small evolutionary
distances, in which it becomes important to consider not only evolutionary events such as duplication and loss, but also population-related phenomenon such as deep coalescence, which can result in incomplete lineage sorting (ILS). To simultaneously model the duplication-loss and coalescent history of a gene family, I introduce a new reconciliation structure, the labeled coalescent tree (LCT), then present a dynamic programming algorithm, DLCpar, for inferring a most parsimonious LCT. I show that the LCT representation enables, for the first time, an exhaustive and efficient search over the space of ILS-aware reconciliations and demonstrate how these properties allow DLCpar to achieve increased accuracy at reduced runtime compared
1 Introduction
to sophisticated probabilistic approaches, thereby enabling inference of complex evolution of gene families across a broad range of species and large datasets (Chapter 4).
" I discuss the need for phylogenetic methods for reconstructing and systematically analyzing
gene family evolution at the sub-gene level, in particular taking into account domain
rearrangements. I present a phylogenomic pipeline for identifying homologous domains
and develop an evolutionary model and reconstruction algorithm, STAR-MP (Species Tree informed Architecture Reconstruction through Maximum Parsimony), that incorporates domain-level events such as generation, duplication, loss, fusion, and fission. I then apply
this pipeline to a
clade
of nine Drosophila species and report numerous striking examples ofarchitecture evolution that cannot be captured by traditional gene-level methods (Chapter 5).
" I discuss the implications of this work to the field, including the central role of computational
techniques in modern biological analysis, and I consider possibilities for future directions (Chapter 6).
1.2
Gene and genome evolution
In this section, we review several major processes responsible for gene and genome evolution.
1.2.1
Mutation
At the most basic level, the genome can change due to a point mutation, that is, via the replacement (substitution) of a single nucleotide with another. Within a gene, mutations can be functionally categorized into three types: silent, in which the mutation results in no change to the amino acid sequence (due to degeneracy of the genetic code); nonsense, in which the mutation results in a premature stop codon; or missense, in which the mutation results in a codon for a different amino acid. A point mutation can also occur via the insertion or deletion of a single base pair, resulting in a frameshift (change in reading frame) and typically substantially altering the resulting protein as, in general, such a mutation causes subsequent nucleotides to code for different amino acids and alters the first stop codon encountered in the sequence.
1.2.2
Genetic drift
We might then be interested in how the frequency of a genetic variant, or allele, in a population changes over time as a result of random sampling. That is, alleles in the offspring are a sample of those in the parents, and which individuals survive and reproduce are determined partly by chance.
Therefore, randomness alone can change allele frequencies from generation to generation. This process of genetic drift will ultimately result in an allele becoming fixed (that is, reach a frequency of 1) or lost (that is, reach a frequency of 0). Thus, because random sampling cannot create new alleles but can cause existing alleles to disappear, genetic drift acts to reduce genetic variation over time (for more on this process, see [105, Ch. 3]).
Note that genetic drift is a neutral process, distinct from the directed process of change that is natural selection. For this reason, it is sometimes referred to as "random genetic drift". The idea that molecular evolution is mainly caused by genetic drift acting on neutral mutations is termed the "neutral theory of molecular evolution" [131, 133, 134] and was later expanded into the "nearly-neutral theory of molecular evolution" [177, 178]. There remains some debate over the relative importance of natural selection versus genetic drift [90, 136] though it is generally agreed that in natural populations, both forces play a role.
1.2.3
Gene duplication (and loss)
At a larger scale, evolutionary events can occur at the gene-level. In particular, gene duplication has long been identified as a major mechanism for generating new genes and functions [154, 158, 176, 191] whereas gene loss plays a similarly important role in shaping genomic content [98, 173]. In the classic model of duplication [133, 176], the ancestral copy maintains its original functions and the duplicate gene, free from selective pressure, can accumulate mutations and evolve new functions; this
is known as
neofunctionalization.
Other evolutionary fates are also possible: in subfunctionalization,the functionality of the original gene is distributed among the two copies [71, 118], and in
non-functionalization, the duplicate gene degenerates into a pseudogene or is lost altogether [67, 100].
In addition to small-scale duplications of individual genes, large-scale duplications are also possible at the segmental chromosomal or genome levels; for example, whole-genome duplication is believed to have occurred in yeast [130] and is responsible for polyploidy in plants [39, 176].
1.2.4
Horizontal gene transfer
In contrast to the vertical transmission of genetic material from a parental generation to its offspring, in horizontal, or lateral, gene transfer (HGT or LGT), a gene is transmitted between organisms [175].
HGT has played a major role in prokaryotic evolution [21, 47, 74]; for example, it is the primary
reason for bacterial antibiotic reason [137] and can convert benign bacteria into pathogens [175]. There is also growing evidence that HGT is common among unicellular eukaryotes [15], and HGT has been observed in the evolution of plant mitochondrial genes [18] and from intracellular bacteria symbionts to their multicellular eukaryotic hosts [115].
1 Introduction 14
1.2.5
Gene fusion and fission
The last process that we shall consider is gene fusion and fission. That is, new genes can arise when multiple genes fuse into a single gene, for example, when two adjacent genes fuse by readthrough transcription, or when a single gene splits into multiple genes, though the underlying mechanism for fission remains unclear [154]. Gene fusions and fissions have been involved in the formation of
~0.5% of prokaryotic genes [227], and gene fusions have also been reported in eukaryotes [252]. More
generally, fusions and fissions can occur in the context of domain rearrangements [20].
1.2.6
Other evolutionary events
We have highlighted only a few evolutionary processes involved in the origin of new genes and functions; others include gene conversion, in which one version of a gene replaces a different version [113, 174, 223] and de novo origination, in which a coding region originates from previously
non-coding genomic region [154]. In addition, new genes can be created by a combination of
mechanisms; for example, the Drosophila gene jingwei arose through exon shuffling, retroposition and gene duplication [155].
1.3
Phylogenetics and phylogenomics
Phylogenetics provides an important foundation for studying evolution. In this field, the goal is
to understand the evolutionary history of a set of taxa, which can be species or genes, or, as is more often the case in population genetics, populations or individuals. The most commonly used representation for depicting an evolutionary history, or phylogeny, is the phylogenetic tree. Nodes within the tree represent taxa, with terminal nodes, or leaves, representing extant taxa and internal, or ancestral, nodes representing ancestral taxa. Taxa are joined together through connecting edges or branches (with no cycles allowed), and together, these nodes and branches form a tree topology that describes how taxa are related. To measure the degree to which taxa are related, branches of the tree may additionally have lengths often represented in units of time (e.g. millions of years) or sequence divergence (e.g. number of substitutions per site).
If the most recent common ancestor (MRCA, also known as the least common ancestor, or LCA) of all taxa under consideration is known, it is called the root and the tree is said to be rooted. In this case, the tree is directed with each node corresponding to the MRCA of all descendants; otherwise, the tree is unrooted and simply illustrates the relatedness of the leaves without any assumptions of ancestry. Several useful relationships exist between nodes in a rooted tree; in particular, each non-root node has a parent and each internal node a set of children. If all internal nodes have at
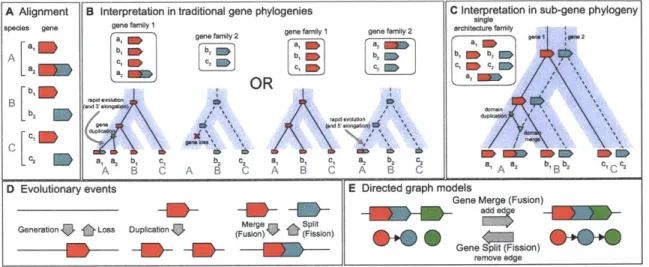
A B---*
ABC
d, h, m1 r, d, m1 m2 rl r2 d, m1 r, m2 r2 dog human mouse rat
dog human mouse rat dog human mouse rat gene tree species tree
Figure 1.1: Gene trees, species trees, and reconciliations. (A) A gene tree (black) evolves
"inside" a species tree (blue). In the simplest scenario, the gene tree and species tree are congruent,
and the gene tree can be explained through speciation events (white circles) imposed by the species tree. (B) In more complex scenarios, gene duplications (yellow star) and gene losses (red 'x') cause the gene tree and species tree to be incongruent. (C) A reconciliation (dashed arrows) maps gene tree nodes to species tree nodes, allowing inference of speciations, duplications, and losses. [Figure and caption adapted with permission from Rasmussen [197].]
most two children, the tree is said to be binary; furthermore, if all internal nodes have exactly two children, the tree is said to be a full binary tree. Unless otherwise stated, all trees in this thesis are
full, rooted, and binary.
1.3.1 Gene trees and species trees
For a cluster of genes with detectable share ancestry, or a gene family, we wish to infer the evolutionary events likely responsible for its creation. To describe this evolutionary history, we will be primarily interested in two types of trees: the gene tree, which describes the evolutionary relationship of a set of genes, and the species tree, which describes the evolutionary relationship of a set of species. In a species tree, the bifurcations represent speciation events, or points in time at which an ancestral population divided into non-interbreeding populations that each began to evolve as distinct species. Similarly, bifurcations in a gene tree represent points at which a gene replicated into distinct sequences that each began to evolve independently. To understand the events responsible for this replication, we can think of the gene tree as evolving "inside" of the
species tree [82, 159, 181] (Figure 1.1).
In the simplest scenario, the gene tree and species tree are congruent, that is, they share the same topology, indicating that a single gene was present in the common ancestral species (represented by the species tree root), and every time an ancestral population speciated, each descendant species inherited a copy. This has resulted in a single copy of the gene in all modern species, and within
the phylogeny, every bifurcation in the gene tree is a speciation event imposed by the species tree
(Figure 1.1A).
1 Introduction
In more complex scenarios in which the two tree topologies differ, evolutionary events other than speciations must be postulated to explain the observed incongruence. For example, in eukaryotic species separated by sufficiently large distances, discordance between the gene tree and species tree typically arises due to gene duplications and gene losses (Figure 1.1B). These can be viewed as complementary events: a gene duplication creates an additional copy of the gene in the genome and is represented as a bifurcation in the gene tree that occurs in the middle of a species branch, and a gene loss deletes a gene from the genome and is represented as "missing" branches in the gene tree.
1.3.2
Reconciliation
The nesting of the gene tree within the species tree is represented by a reconciliation. While several definitions of reconciliation exist [8, 50, 84, 86], the simplest is a mapping from each node in the gene tree to a node in the species tree that specifies the species to which the gene belongs [82, 181] (Figure 1.1C). For a given gene tree and species tree, it is this reconciliation that indicates the particular number and order of evolutionary events that have given rise to the gene tree. Furthermore, there exist multiple ways to reconcile a gene tree to a species tree, with each reconciliation implying a different evolutionary history.
The earliest reconciliation method, Most Parsimionious Reconciliation (MPR), defines an "optimal" reconciliation as one that minimizes the number of implied duplications [181]. Given a mapping that, for each extant gene, defines the extant species to which it belongs, MPR works recursively up the gene tree and determines, for each ancestral node in the gene tree, the species to which its children belong, then maps the ancestral node to the LCA of these species [290]. In addition to minimizing the number of duplications, the LCA mapping also minimizes the number of duplications and losses (mutation cost) [86].
While traditionally, most reconciliation algorithms have used a parsimony framework to minimize the number of implied events for a binary gene tree and species tree, more recently, non-binary [27,
259] and probabilistic [8, 51] formulations have also been developed, as have models incorporating
horizontal gene transfer [33, 52, 84, 102, 137] or incomplete lineage sorting [201].
1.3.3
Orthologs and paralogs
Gene histories are fundamental for inferring relationships between extant genes. In particular, for two genes with shared ancestry, or homologs, it is often useful to distinguish between shared ancestry due to speciation, in which case the genes are orthologs, and shared ancestry due to duplication,
in which case the genes are paralogs [68]. Whereas orthologs often (but not always) have the
same function, duplication allows for paralogs to evolve new functions through neofunctionalization
and subfunctionalization [64]; identifying orthologous and paralagous relationships therefore plays a major role in functional annotation [58]. Furthermore, tracing the history of one-to-one orthologous families can aid researchers in inferring population sizes and structures [44] or in the reconstruction of species histories [32].
1.3.4
Phylogenetic methods
Due to their many powerful applications, accurate gene tree reconstruction, species tree recon-struction, and gene tree-species tree reconciliation are fundamental problems in phylogenetics. For the problem of species tree reconstruction, traditional phylogenetics relies on morphological traits, which suffers from a number of disadvantages: for example, the traits need to be measured and quantified, the selection of traits necessarily reflects a hypothesis about their evolutionary relevance, the distribution in values for continuously varying traits can overlap between species, different traits may yield different phylogenies, and similar traits may have evolved independently in different lineages due to convergent evolution. While it does not address all of these problems, modern phylogenetics relying on molecular data offers the benefit in that the characters in biological sequence data, that is, nucleotides or amino acids, are unambiguous and discretely defined.
Furthermore, unlike morphological phylogenetic analysis, molecular phylogenetic techniques can be applied to the problem of gene tree reconstruction, thereby aiding in our understanding of gene family evolution. In general, these methods take as input a multiple sequence alignment and output a gene tree, and they can be broadly classified into two categories.
In distance-based approaches, the alignment is first converted into a pairwise distance matrix, and this matrix is then used to build a tree such that the discrepancy between the distances observed and those implied by the tree is minimized. Examples of distanced-based methods include Unweighted Pair Group Method with Arithmetic Mean (UPGMA) [228], neighbor-joining (NJ) [215], and least-square error (LSE) [69]. Many theoretical studies have focused on understanding the consistency of these approaches (that is, whether they correctly reconstruct a tree when the distances fit perfectly on that tree) or on the biological relevance of the optimization criterion [10, 23, 38, 76, 167]. Furthermore, distance-based methods remain popular as the trees can be reconstructed in polynomial time [24, 169, 234].
Nevertheless, character-based approaches are now the method of choice for phylogenetic
reconstruction. These can be further subdivided into three categories: maximum parsimony
(MP) [68], maximum likelihood (ML) [65], and Bayesian inference [195]. All build a tree directly from the alignment, are inherently statistical and based on an evolutionary model, and, by using the character data directly, are able to incorporate character state distributions and substitution
1 Introduction
rate variations, thus yielding more accurate reconstructions. However, these advantages come at the cost of increased model complexity, which is problematic as violations of the assumed
model can lead to incorrect trees. Furthermore, the space of possible tree topologies grows
exponentially with the number of leaves; thus, computing a score for all topologies is intractable, and current approaches use heuristic methods that search only a fraction of the tree space, either through local rearrangements [66] or, for Bayesian methods, through Markov Chain Monte Carlo sampling [91, 108, 165]. Finally, existing algorithms are also computationally intensive, making
them impractical for analyzing large datasets.
A key component of molecular phylogenetic techniques is the substitution model under which
sequences evolve. The most common models are neutral, independent, finite-sites, stationary, time-reversible models, and for nucleotide evolution, range from the simplest, Jukes-Cantor [125], through the more complex, including Kimura-2-parameter [132] and Hasegawa, Kishino, and Yano [107], to the most general, generalized time-reversible model [143, 242]. When applied to phylogenetic trees, ancestral sequences states are unknown and are thus marginalized out, sequences along different branches are assumed to evolve independently and often according to a molecular clock, and the prior distribution for nucleotides at the root of the tree is assumed to be equal to the base frequencies in the substitution model [65].
1.3.5
Phylogenomic methods
With the growing availability of genome sequences, phylogenetic analysis can be carried across both sizable clades and whole genomes, in a research field called phylogenomics [58, 59]. This has led to a better understanding of evolutionary conservation and divergence within species such as yeasts [26,
267], flies [99], vertebrates [260], and plants [122]. At the same time, phylogenomic approaches also
benefit from the ability to exploit genome-wide information, for example, by incorporating species tree branch lengths, duplication-loss rates, or synteny [8, 199, 200, 260].
These studies often utilize one or more of the several computational methods that have been
developed for detecting gene families and inferring their histories. The phylogenomic pipeline
typically proceeds as follows: (1) We are given as input multiple fully sequenced genomes along with their gene models. (2) We determine the sequence similarity among the genes and cluster the genes into families. (3) We reconstruct gene trees for each family. (4) We reconcile the gene trees to a common species tree, allowing us to infer homology relationships and all evolutionary events. Note that this pipeline is only one way in which to conduct a phylogenomic study. For example, studies of gene family expansion and contraction need not reconstruct the underlying gene trees [97].
In this thesis, we assume that the species tree is known and that gene annotations and families
exist in literature, in online databases, or can be computed to a high degree of accuracy using existing tools. Therefore, we will focus mainly on methods for improving the last two stages of this pipeline, that of gene tree reconstruction and gene tree-species tree reconciliation.
1 Introduction
Chapter 2
Statistically informed gene tree
reconstruction with gene
duplication and loss: TreeFix
Accurate gene tree reconstruction is a fundamental problem in phylogenetics, with many important applications. However, sequence data alone often lack enough information to confidently support one gene tree topology over many competing alternatives. Here, we present a novel framework for combining sequence data and species tree information, and we describe an implementation of this framework in TreeFix, a new phylogenetic program for improving gene tree reconstructions. Given a gene tree (preferably computed using a maximum likelihood phylogenetic program), TreeFix finds a "statistically equivalent" gene tree that minimizes a species tree based cost function. We have applied TreeFix to two clades of 12 Drosophila and 16 fungal genomes, as well as to simulated phylogenies, and show that it dramatically improves reconstructions compared to current state-of-the-art programs. Given its accuracy, speed, and simplicity, TreeFix should be applicable to a wide range of analyses and have many important implications for future investigations of gene evolution.
2.1
Eukaryotic gene tree reconstruction
Although gene trees have many powerful applications, tree-based analyses depend strongly on the accuracy of the reconstruction [96, 199]. However, unlike species tree reconstruction, which can
The work presented in this chapter has led to the following publication: Wu YC, Rasmussen MD, Bansal MS, Kellis M.
2013. TreeFix: statistically informed gene tree error correction using species trees. Systematic Biology 62(1):110-120.
benefit from the use of well-behaved gene families as well as multi-gene phylogeny construction methods [25, 46], gene tree reconstruction is complicated by the fact that many genes lack enough information to confidently support a single gene tree topology. Thus, "sequence-only" algorithms
that reconstruct gene trees using only the sequence data (e.g. PAUP* [238], BioNJ [751, PhyML [94],
RAxML [230], MrBayes [208]) often produce incorrect and poorly supported gene trees.
2.1.1
Existing work
However, within eukaryotic genomes, recent studies have found that incorporating species tree information can drastically improve gene tree accuracy [200, 260]. This has led to the formulation of "species tree aware" methods, which often combine sequence likelihood with a topology prior based on a known species tree, with the most principled methods adopting a Bayesian approach (e.g. PrIME-GSR [8], SPIMAP [200]), though simpler models (e.g. TreeBest [260], SPIDIR [199]) also exist. However, these models often require additional parameters, such as estimates of divergence times and duplication-loss rates, and they tend to be very computationally intensive.
In parallel, several "hybrid" methods have been developed for resolving gene tree and species tree incongruence to produce "error-corrected" gene trees. These are often based on a reconciliation framework and attempt to minimize a species tree aware cost function based on the inferred evolutionary events. For example, both NOTUNG [30, 55] and tt [85] consider local rearrangements around an initial gene tree to find an error-corrected gene tree that has minimum duplication-loss cost after reconciliation. While these algorithms only require a known species tree topology and are therefore much simpler than model-based species tree aware approaches, they suffer from two important drawbacks: (1) they limit their search space and can therefore miss the correct tree topology if it is distant from the initial tree, and (2) because they ignore whether the corrected gene tree is supported by the sequence data, they cannot guarantee that the corrected gene tree does not overfit to the species tree.
2.1.2
Contributions
To address these shortcomings, we present a novel hybrid method TreeFix. Like other hybrid methods, TreeFix rearranges an input gene tree to minimize the number of inferred duplications and losses. However, TreeFix is novel in that it also uses the sequence data (i.e. nucleotide or peptide alignment) to guarantee that the final corrected gene tree is "statistically equivalent" in likelihood to the initial input tree (i.e. the difference in likelihood between the two trees is not significant). In essence, TreeFix recognizes that although phylogenetic programs often return a single optimal gene tree (or possibly a consensus tree across multiple bootstraps), multiple gene trees are
often statistically equivalent, as measured by likelihood ratio tests, such as the Kishino-Hasegawa (KH) test [135], the Shimodaira-Hasegawa (SH) test [220], or many others [221]. Furthermore, one of these statistically equivalent gene trees will often more accurately reflect the true gene tree topology. By incorporating this statistical test with a reconciliation cost, such as the duplication-loss cost, we can therefore improve phylogenetic accuracy. In addition, because of this guarantee, TreeFix is free to employ an expanded search algorithm that can explore more distant parts of the tree space. We find that together, these techniques lead to a simple yet powerful method that requires few modeling assumptions or parameters and produces highly accurate gene trees ideal for inferring the evolutionary history of gene families. The TreeFix program is available at http://compbio.mit. edu/treef ix.
We have applied TreeFix to both real and simulated datasets and compared its performance to that of several other gene tree reconstruction methods. We find that TreeFix shows drastic improvement over existing sequence-only and hybrid approaches, with performance comparable to the most sophisticated species tree aware Bayesian approaches.
2.2
Gene tree landscape
To understand the basic idea behind TreeFix, consider the likelihood landscape of the gene tree space (Figure 2.1A). Ideally, TreeFix is given as input the ML tree (models with non-unique ML trees should not be used). This tree corresponds to the highest peak in the landscape, but often, this peak is located in a plateau of high likelihood topologies. Methods such as NOTUNG and tt make local rearrangements to explore this surrounding plateau for the topology that minimizes some user-defined cost function (e.g. the number of inferred duplications and losses), where this cost function is used as a heuristic for improving gene tree accuracy. However, these local moves may result in a topology outside the plateau that has significantly worse likelihood than the ML topology. Furthermore, the likelihood landscape may also contain multiple peaks and valleys, necessitating a larger search to explore distant plateaus. TreeFix essentially searches among topologies within the landscape that lie above a certain threshold, using reconciliation cost as a heuristic to determine
an optimal tree among these topologies. In this way, TreeFix is able to move beyond local
rearrangements to find a minimum cost gene tree without overfitting to the species tree.
Note that TreeFix inherently assumes that regions of high sequence likelihood and low reconciliation cost overlap, an assumption held up in practice (Figure 2.1B). When this is not the case, TreeFix errs on the side of sequence support (rather than species tree support) and returns a gene tree with high sequence likelihood and high reconciliation cost.
Our goal is to find, among all gene tree topologies that are statistically equivalent to the maximum
A reconciliation cost B
ThL (e.g. duplication-loss cost) A
T high
7&- 5 15 25
- v. Search
Iteraton end input/Output TreesA roe
ISignificance Level
I I I x n
low 0 20 40 60 80
[j
duplication-loss cost Start
Figure 2.1: Gene tree landscape. (A) Each point within the landscape corresponds to a gene tree
T, whose optimality can be measured via its likelihood L_ (height) and its reconciliation cost c_
(color). The maximum likelihood tree TML is located at the peak of this landscape but may have a high cost. Rearranging TML to a nearby tree T, can result in a negligible decrease in likelihood
(6x = ln LML - ln Lx < 6thr) while simultaneously reducing the tree cost (cx < CML), thus producing
a more congruent gene tree that is statistically equivalent to the ML tree. TreeFix utilizes this basic idea by balancing the two optimality criteria to return an optimal tree T* for which 6* is negligible and c* is minimal. (B) The landscape for a simulated gene family shows a wide range of likelihood and cost values. In this instance, TreeFix searched over 3560 gene trees of the 8.2 x 10²¹ possible unrooted topologies (number of genes = 21). While most trees have statistically worse likelihoods compared to the ML tree (x), a subset of high likelihood trees are statistically equivalent (o). As the search progresses, the search space generally moves towards the top-left, corresponding to topologies with high likelihood and low duplication-loss cost (enlarged at right, accepted trees per iteration shown as N). In this case, TreeFix has rearranged TML (beige A) to produce a new optimal tree T* (purple A) with equivalent likelihood and lower cost. Note that T* is incorrect since the true tree
Ttrue (black A) has a slightly higher duplication-loss cost. (Likelihoods were computed with c = 2.)
likelihood (ML) tree, one that minimizes a user-defined reconciliation cost. Thus, at its core, TreeFix consists of three basic components: (i) a test of statistical equivalence to filter out gene tree topologies that are suboptimal, (ii) a gene tree and species tree reconciliation method to compute the reconciliation cost, and (iii) a tree search to explore the space of alternative gene tree topologies. We elaborate on each of these below:
2.2.1 Statistical comparison of sequence support for multiple topologies
Many statistical tests have been developed for computing the equivalence of two or more tree topologies chosen a priori [81, 135, 220, 221]. In essence, these tests compute a test statistic that captures the observed likelihood difference between trees, then rely on hypothesis testing in which the null hypothesis is that the trees are equally supported by the sequence data, and the alternative hypothesis is that the trees are not equally supported. Because sequence evolution is a stochastic process, these tests determine a p-value that represents the probability of obtaining a test statistic at least as extreme as the one that was actually observed, assuming that the null hypothesis is true.
Given a significance level a that represents the probability of false rejection (i.e. we believe the trees are not equally supported when they actually are), we then reject the null hypothesis and say the trees are not equally supported if p <
a,
or we fail to reject the null hypothesis and say that the trees are equally supported if p > a. Note that if a = 0, all trees are equally supported, effectively removing the statistical test and causing TreeFix to return the minimum cost gene tree regardless of sequence support, whereas if a = 1, no trees are equally supported, effectively causing TreeFix to return only the tree with highest sequence support, e.g. the ML tree.While users may implement their own statistical module, by default, TreeFix uses the SH test provided by the RAxML package. For further information on likelihood tests, including a discussion of statistical power, how to correct for multiple comparisons, and an error rate analysis, see Sections A.1 and A.2.
2.2.2
Reconciliation cost as a heuristic for topological accuracy
To calculate a species tree aware cost, we make use of the reconciliation framework, in which any incongruence between the gene tree and species tree topologies is explained by postulating evolutionary events, such as gene duplication, gene loss, horizontal gene transfer, or incomplete lineage sorting [159]. While users may implement their own cost module, by default, TreeFix uses maximum parsimony reconciliation (MPR) [181, 290] with the duplication-loss cost function [82], which seeks the reconciliation with the fewest total number of inferred duplications and losses. In addition to being the standard model used in many species tree aware and hybrid approaches, e.g. in SPIMAP, TreeBest, NOTUNG, and tt, we found the reconciliation cost to be highly correlated with gene tree topological accuracy (Section A.3, Table A.3), lending support to our approach of using this metric to incorporate information from the species tree into the gene tree reconstruction.
2.2.3
Tree search
Since it is impractical to search through the space of all possible gene tree topologies, we use a heuristic hill climbing search strategy. The idea is to start with the given input gene tree and find a better tree in its neighborhood (defined using some tree edit operation). This constitutes one local search step. This better tree then becomes the starting point for the next local search step, and so on, for either a predefined number of local search steps or until a local optima is reached. Local search forms the basis of almost all known parsimony and likelihood based phylogeny construction programs, e.g., in PAUP*, RAxML, PhyML, and others, and has been employed for gene tree error correction as well.
In our implementation, we use nearest neighbor interchange (NNI) and subtree prune and regraft
(SPR) [66, Ch. 4] to define the neighborhood in each local search step. In addition, we use the reconciliation cost to prescreen topology proposals. In particular, on each iteration, we perform a random NNI or SPR operation on the current optimal gene tree and compute its cost. This proposal is always accepted if it has a lower cost and is accepted with some predefined probability if it has a higher cost, and we repeat this local search until we have nq proposals, after which only those proposals with a cost lower than the optimal are retained. We then sort the proposals by their costs, set the first proposal with statistically equivalent likelihood as the new optimal, and repeat this entire process for ni iterations. Notably, this search strategy allows us to "jump" over valleys of low tree cost or low likelihood and explore distant parts of the gene tree landscape.
2.3
The TreeFix algorithm
TreeFix takes as input a gene tree Ti, (often the ML tree), a multiple alignment A, a species tree
T,, a test statistic stat and significance level a E [0,1] for likelihood equivalence. Additionally, it
takes three search parameters: ni, nq > 1 that control the number of tree proposals, and
f
E [0, 1]that specifies the fraction of proposals to reroot.
For an arbitrary gene tree T, TreeFix evaluates two functions in order to determine how the tree fits within the likelihood landscape: (1) c. = cost(T,; T,) > 0, i.e. the cost of the gene tree
based on the species tree, and (2) px,J, = LHtat(T; A, Ti,), i.e. the statistical significance and
change in log-likelihood
ln
Li, -In
L. of the gene tree (against the input gene tree) based on thetest statistic, multiple alignment, and input tree.
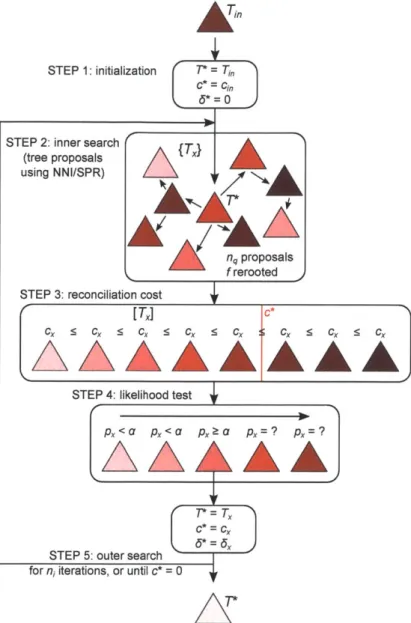
TreeFix outputs the optimal rooted gene tree T*, i.e. the gene tree with minimum cost and statistically equivalent likelihood, if such a tree is found. If multiple trees have minimum cost and are statistically equivalent, the one with minimum change in likelihood is returned. The main algorithm is as follows (Figure 2.2):
1. Initialize T* = Ti, c* = cj, and 6* = In Li, - In L* = 0.
2. ( Tree search) Make nq proposals {T2}, compute c, for all T, in {T,}, and reroot
f
of them tohave minimum cost.
3. (Reconciliation cost) Sort {T.} in order of increasing cost, and retain only those for which c, < c*. Call this [Tm].
4. (Likelihood test) Consider proposal T2 in [T,], and compute p, and
6.
If p2, ;> a and either(a) c_ < c* or (b) c, = c* and J2 < P*, set T* = T,, c* = c, and * = 6, and go to step 5.
Else consider the next proposal.
in
STEP 1: initialization T = T
C* = cx
6* =0
STEP 2: inner search
(tree proposals i tt
using NNI/SPR)
I
A
n. proposalsf rerootedoted
STEP 3: reconciliation cost i [ TX ]C*
Cx ds th a lkiho md axs h ip te we c u eC,
STEP 4: likelihood test
p,<a px<a pxkta px=? px=?
T- = Tx
C* = Cx
5* = (5x
STEP 5: outer search for n; iterations, or until c* = 0
Figure 2.2: TreeFix algorithm. After initialization (step 1), TreeFix proposes nq trees, with f of
them rerooted to have minimum cost (step 2, details of the search strategy omitted for clarity). It then accepts or rejects trees based on their costs (step 3) and likelihood scores (step 4), returning
a new optimal tree T* that is statistically equivalent to the input tree Tin but has minimum cost. This is repeated for ni iterations or until the optimal cost is 0 (step 5).
5. Repeat steps 2-4 for ni iterations or until c* = 0.
Though users can input any tree, in practice, we recommend that users input a ML tree, e.g. from RAxML or PhyML, and use the same likelihood model as the input tree when computing the test statistic.
Note that TreeFix does nothing if the input gene tree contains < 2 genes, is unrooted and contains
< 3 genes, or has a reconciliation cost of 0. Furthermore, if the gene family contains one gene per
species, TreeFix first checks the likelihood and reconciliation cost of the gene tree topology that is congruent to the species tree topology.
To measure the uncertainty of different topologies and events, we also implemented a boot-strapping procedure. To bootstrap the entire pipeline would require resampling the alignments, reconstructing the ML trees using these alignments, then passing both the resampled alignments and associated ML trees to TreeFix for error correction. However, such a procedure would be computationally expensive and infeasible for large datasets. Furthermore, we envision TreeFix as a tool to be used in conjunction with existing ML programs, most of which store only the bootstrap trees and not the bootstrap alignments. Therefore, we have implemented an approximation in
which we bootstrap only the TreeFix stage of the pipeline. If bootstrapping is enabled, then
TreeFix resamples the alignment and error corrects the input gene tree for each resampled alignment. Note that we reuse the original ML tree topology (reconstructed from the full data) across these bootstraps; that is, we do not explore the uncertainty in the topology of Ti,,. However, the likelihood test does optimize the branch lengths and recalculate the likelihood of Ti" on each resampled alignment. Therefore, as long as the ML tree topology reconstructed from the full alignment can be considered as a good proxy for the ML tree topology that would have been reconstructed from the bootstrapped alignments, this approximation should have little effect on the statistical significance of alternative topologies and the resulting TreeFix corrected gene trees.
2.4
Benchmarks
We evaluated TreeFix using two clades of 12 Drosophila and 16 fungi (Figure 2.3) and using the same datasets used to evaluate SPIMAP [200]. This included 1000 simulated gene families (generated
under the SPIMAP model) across each
clade,
as well as 5351 real gene families across the 16 fungalgenomes.
For comparison, we also evaluated several phylogenetic programs, including the "sequence-only" probabilistic program RAxML, the "species tree aware" programs SPIMAP and TreeBest, and the
"hybrid" programs NOTUNG and tt (pipeline and algorithm parameters provided in Section A.4; results using sequence-only methods BioNJ, PHYML, and MrBayes, and species tree aware method PrIME-GSR can be found in Rasmussen and Kellis [200]).
2.4.1
Simulated datasets
In the simulated dataset, the correct phylogeny is unambiguously known, allowing us to analyze several different aspects of the phylogenetic programs.
A B S cerevisiae S. paradoxus S. mikatae S. bayanus D. melanogaster C. glabrata D. sechellia S. castelli D. simulans A. gossypii D. erecta K. lactis D. yakuba K. wali D. ananassae C. albicans D. pseudoobscura C. tropicalis D. persimilis C. parapsilosis D. willistoni L. elongisporus D. mojavensis C. guilliermondii D. virilis D. hansenii D. grimshawi C. lusitaniae 63 myr 180 myr
Figure 2.3: Species and phylogenies used in evaluation. The phylogeny of (A) 12 Drosophila species [240] and (B) 16 fungal species [26].
To measure accuracy, we evaluated several different metrics including topological accuracy, branch accuracy, and sensitivity and precision of duplication, loss, and ortholog inference (Fig-ure 2.4). While we ran TreeFix on both the fly and fungi clades, we focus our discussion here on
the results of the larger fungi
clade,
as the phylogenetic programs performed similarly across manyof the metrics using the smaller fly clade.
We found that TreeFix significantly improves on the input RAxML trees, improving topological accuracy by 82.8-84.8%, branch accuracy by 22.7-23.2%, and duplication and loss precision by
64.6-69.6% and 82.9-89.6%. (The other metrics are less sensitive to gene tree errors, showing between 0.3% reduction and 13.6% improvement.) Additionally, TreeFix performance is comparable to that
of the most sophisticated reconstruction method analyzed (SPIMAP), and both of these dramatically outperform all other methods.
The low performance of RAxML is, of course, expected as it utilizes only sequence data. Among the species tree aware and hybrid methods, TreeBest performs by far the worst, which we believe can be attributed to its relatively simple penalized likelihood approach. (Results presented here used default parameters for TreeBest. Analysis using a variety of parameter settings for TreeBest did not show an appreciable change in accuracy.)
Using quick search parameters, TreeFix performs slightly better than NOTUNG (3.9% improve-ment in topological accuracy, 2.3% and 7.2% in duplication/loss precision) and significantly better than tt (20.4%, 25.1%, 53.5% improvement). Furthermore, we found that 1.8% of the NOTUNG trees and 1.1% of tt trees fail the SH test (compared to the input RAxML trees at a = 0.05), suggesting that the decreased performance of these hybrid methods is at least partially a result of overfitting to the species tree.
In light of this, we analyzed TreeFix to determine the effect of overfitting on gene tree error.
![Figure 2.3: Species and phylogenies used in evaluation. The phylogeny of (A) 12 Drosophila species [240] and (B) 16 fungal species [26].](https://thumb-eu.123doks.com/thumbv2/123doknet/14435385.515904/29.918.231.659.102.345/figure-species-phylogenies-evaluation-phylogeny-drosophila-species-species.webp)


![Figure 4.4: Species and phylogenies used in evaluation. For our evaluation on simulated data, we used (A) 15 primates (plus two outgroup species) [222], (B) 12 Drosophila species [240], as well as simulated phylogenies](https://thumb-eu.123doks.com/thumbv2/123doknet/14435385.515904/70.918.172.770.101.373/species-phylogenies-evaluation-evaluation-simulated-drosophila-simulated-phylogenies.webp)