en fr
Texte intégral
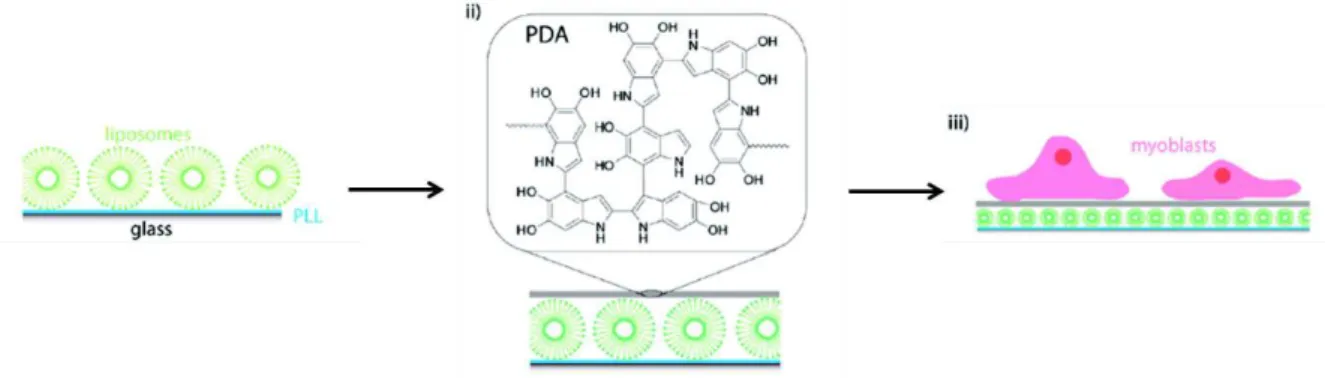
Figure


Documents relatifs
The Cu concentration profile across the analysed volume exhibits Fe gradients and a strong Fe-Cu interdiffusion (figure 7-b). The Fe concentration in the copper phase is up
If a chemist wants to search a database for a molecule similar to a query molecule using this similarity score, he may find many molecules with the same (minimal) RMSD.. Among
We developed an interesting feature generation module that combines classes and properties in a uniform framework to characterize the semantic coherence of the values in a column,
Criterion 5.1 Aspects of plantation and mill management that have environmental impacts are identified, and plans to mitigate the negative impacts and promote the positive ones
The second wound sample is, in terms of voltage taps, a fully-instrumented single pancake which allows recording the transition and its propagation inside the winding
For the purposes of this project, the images were separated into 3 groups: Images of potato leaves in good condition, potato leaves affected by Phytophthora infestans [Fry,
We suggest that integrating the three keynotes – basic notions, history and language of mathematics – into a teachers’ curriculum and thus cross-linking the courses supports
Figure 1: Crack propagation following a tablet sliding mechanism of the nacre “bricks and mortar” structure (SEM picture after a three point bending test). Figure 2:
